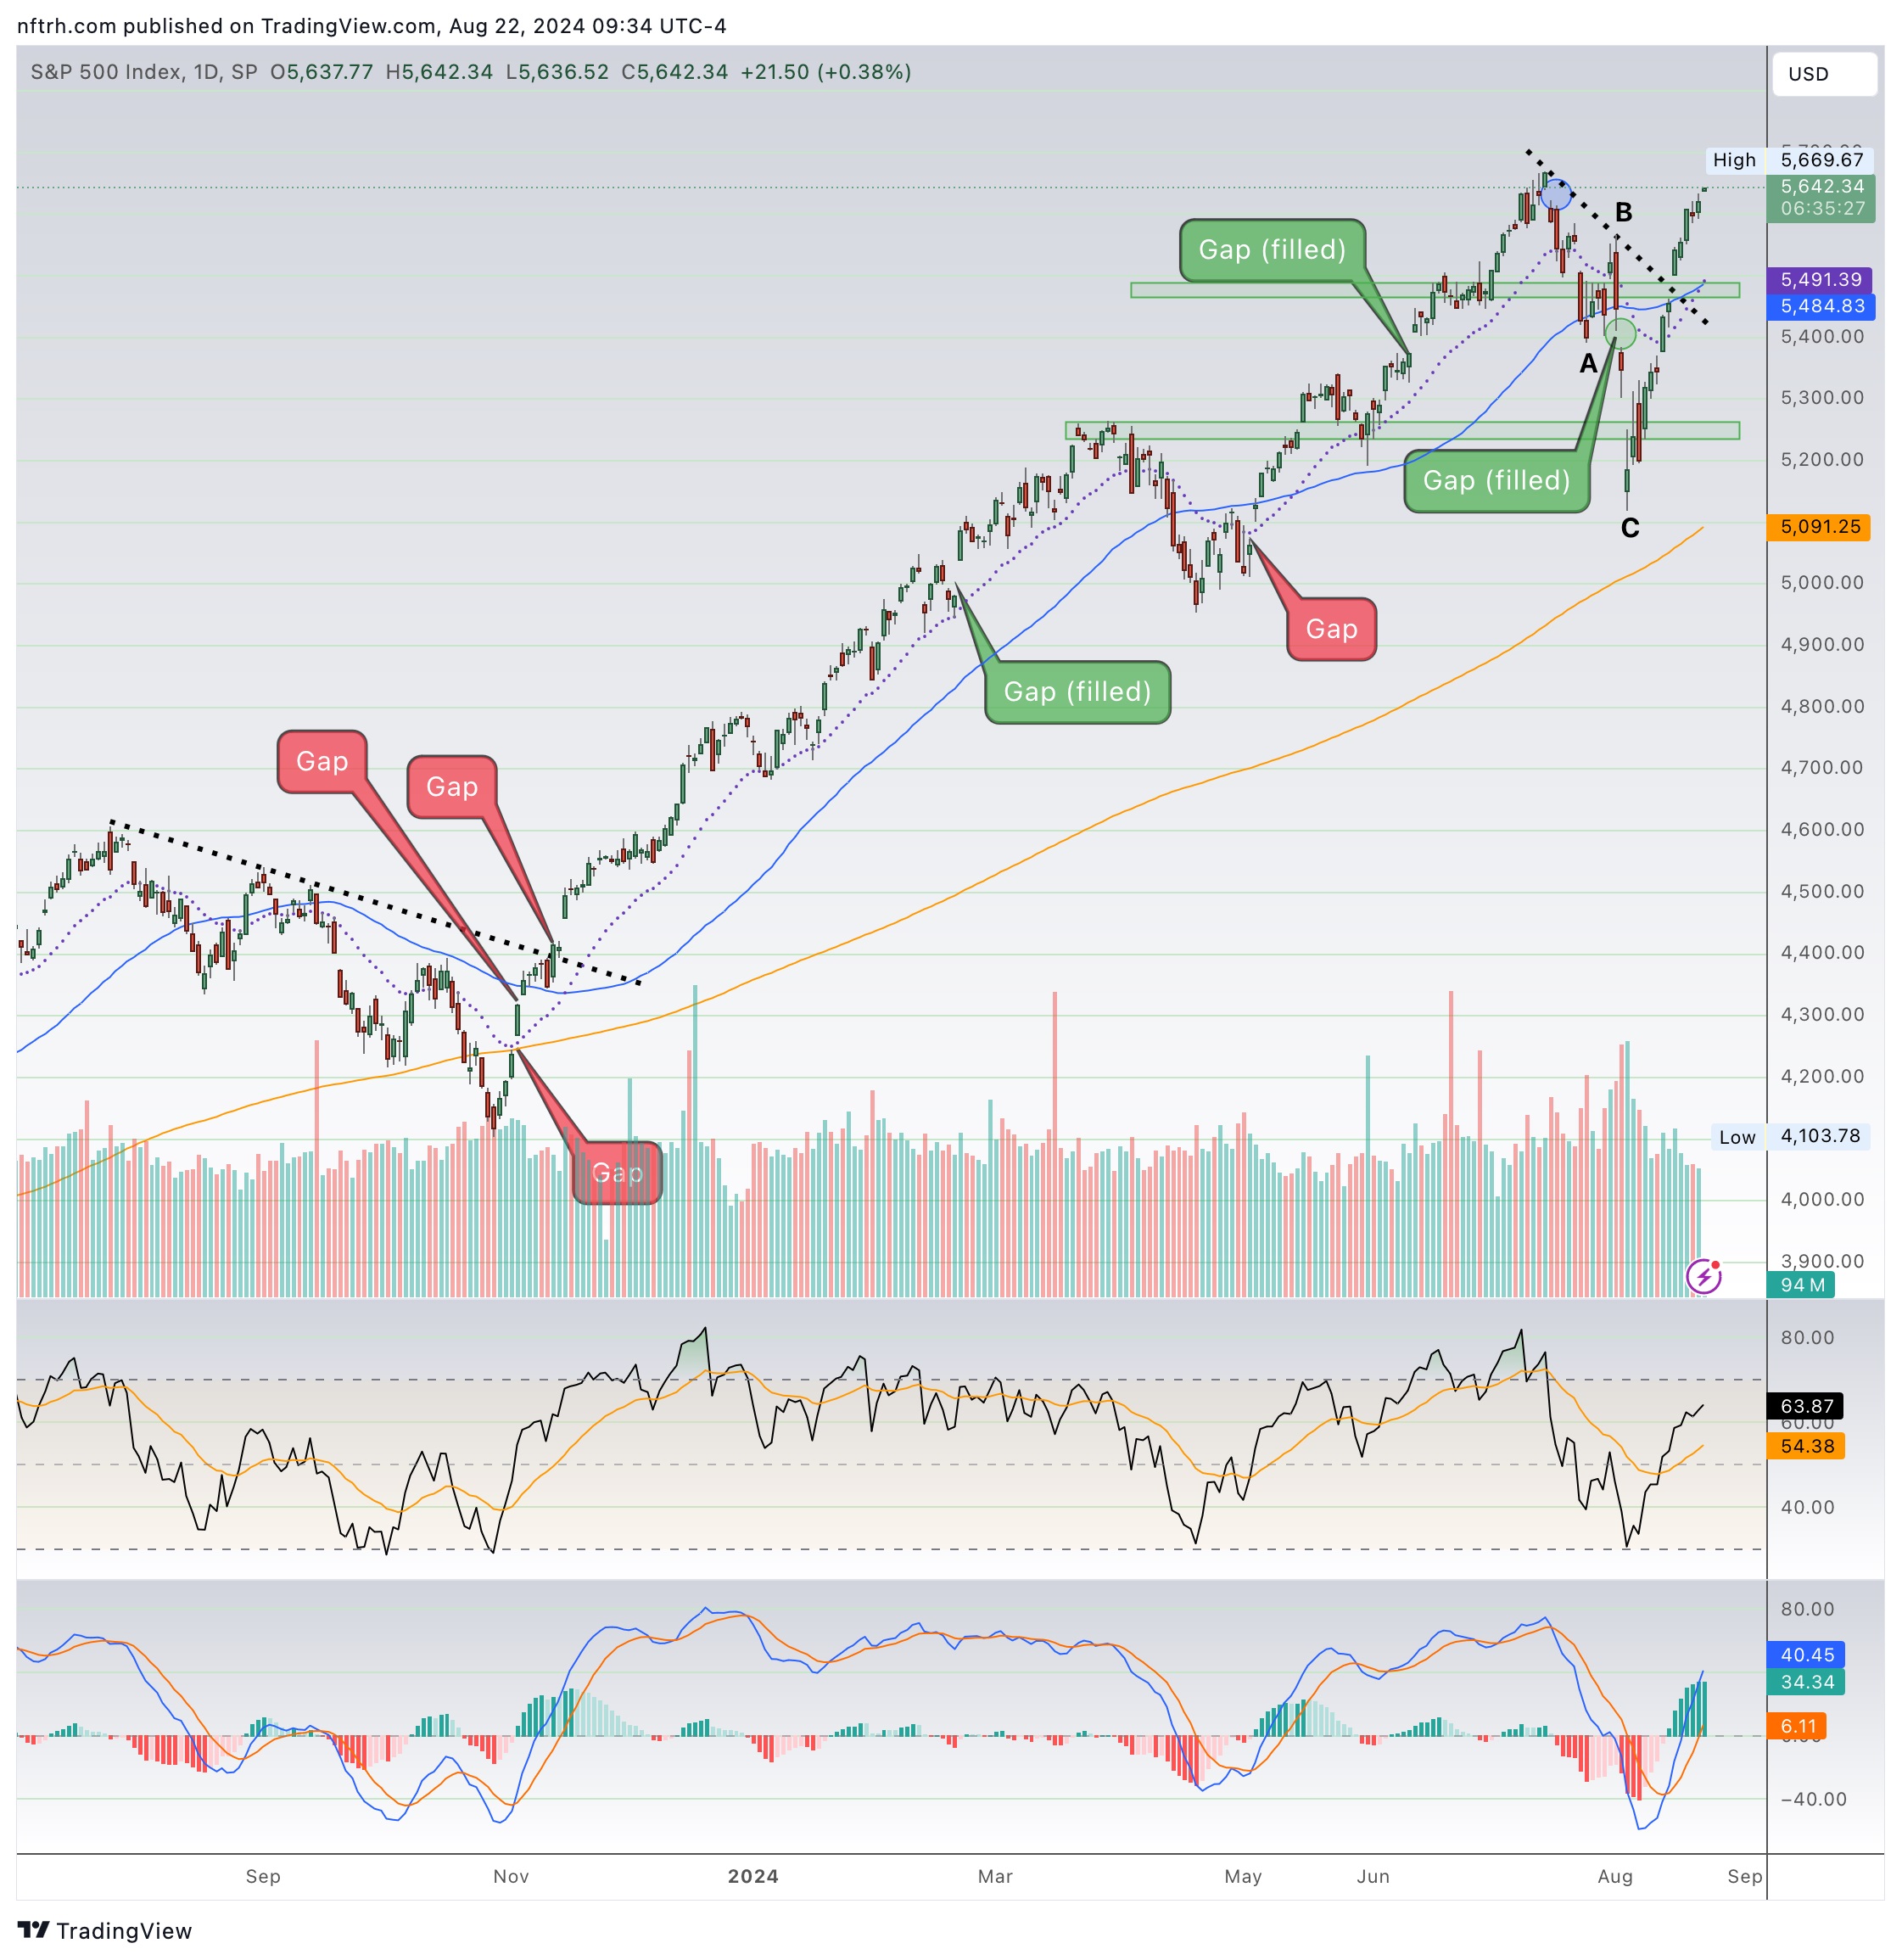
After a nice summer correction the US stock market is where we expected; rallying after a healthy sentiment clean-out.
This (now public) NFTRH+ update on August 16 noted:
As you know, the favored plan was/is for a mid-summer market correction (mini or maxi) to clear the tracks for a next, and possibly final leg up in the markets. The less favored view was that the correction would be the start of a bear market. We look at some signals that appear to be confirming the view.
First, let’s get a look at daily SPX before moving on to a few internal indicators. The A-B-C correction scenario as illustrated in NFTRH 822 [8.11.24] appears to be playing out as the bottom retest scenario, which I’d thought possible, is off the table. Upside gap #1 is filled and now SPX aims for the upper gap which we noted “would be the gateway to a next leg up scenario”. Taking out point ‘B’ would set SPX on its way.
As to the last sentence, point ‘B’ is in the rear view mirror and the index has its sights directly on a fill of the upper gap, which is the gateway to a “next leg up” scenario. In hindsight it’s like ‘of course the market was gonna rally again!’, but a few weeks ago it was not at all like that. The nightly news was scaring the herds out as the machines were selling down hard (in preparation for their re-buying).
This is why I don’t go against the trends unless they break. Day traders probably played the correction to the downside (with varying degrees of success, I’ll bet) but I don’t want to day trade. I want to get the macro right and more importantly, get its intermediate and long-term phases right. I want to think like a machine set for intermediate-term moves with an eye always out for pivots to longer-term changes.
Anyway, here’s SPX ready to re-bull. If you see bearish analysts out there bitching and moaning about it you will know who to avoid in the future. The beginning of the bear market, while possible, was not a probability and it will not be a probability unless either the major daily trend (SMA 200) breaks, a key lower low (e.g. ‘C’) is taken out or an upside blow-off is so dynamic that you just know it’s the end (e.g. silver in 2011).
For “best of breed” top down analysis of all major markets, subscribe to NFTRH Premium, which includes an in-depth weekly market report, detailed market updates and NFTRH+ dynamic updates and chart/trade setup ideas. Subscribe by Credit Card or PayPal using a link on the right sidebar (if using a mobile device you may need to scroll down) or see all options and more info. Keep up to date with actionable public content at NFTRH.com by using the email form on the right sidebar. Follow via Twitter@NFTRHgt.
*********


