Sign up for daily news updates from CleanTechnica on email. Or follow us on Google News!
Overall, gas car sales decreased by 1% in Q2 2024 compared to Q2 2023. Looking back further, US gas car sales are down 14% compared to pre-pandemic Q2 2019. Looking at all auto sales, the market is just down 8% in that period, showing how much more gas sales have been dropping while EV sales have risen..
Looking at how US auto sales compared in the 2nd quarter of this year to the 2nd quarter of each of the last 4 years, we can see how dramatically the market has seen busts and booms from the COVID-19 pandemic. Compared to last year, US auto sales hardly changed. However, they’re up a bit more from 2022, down dramatically compared to the big recovery year of 2021, up dramatically from the shutdown-era year of 2020, and down 8% compared to pre-pandemic 2019.
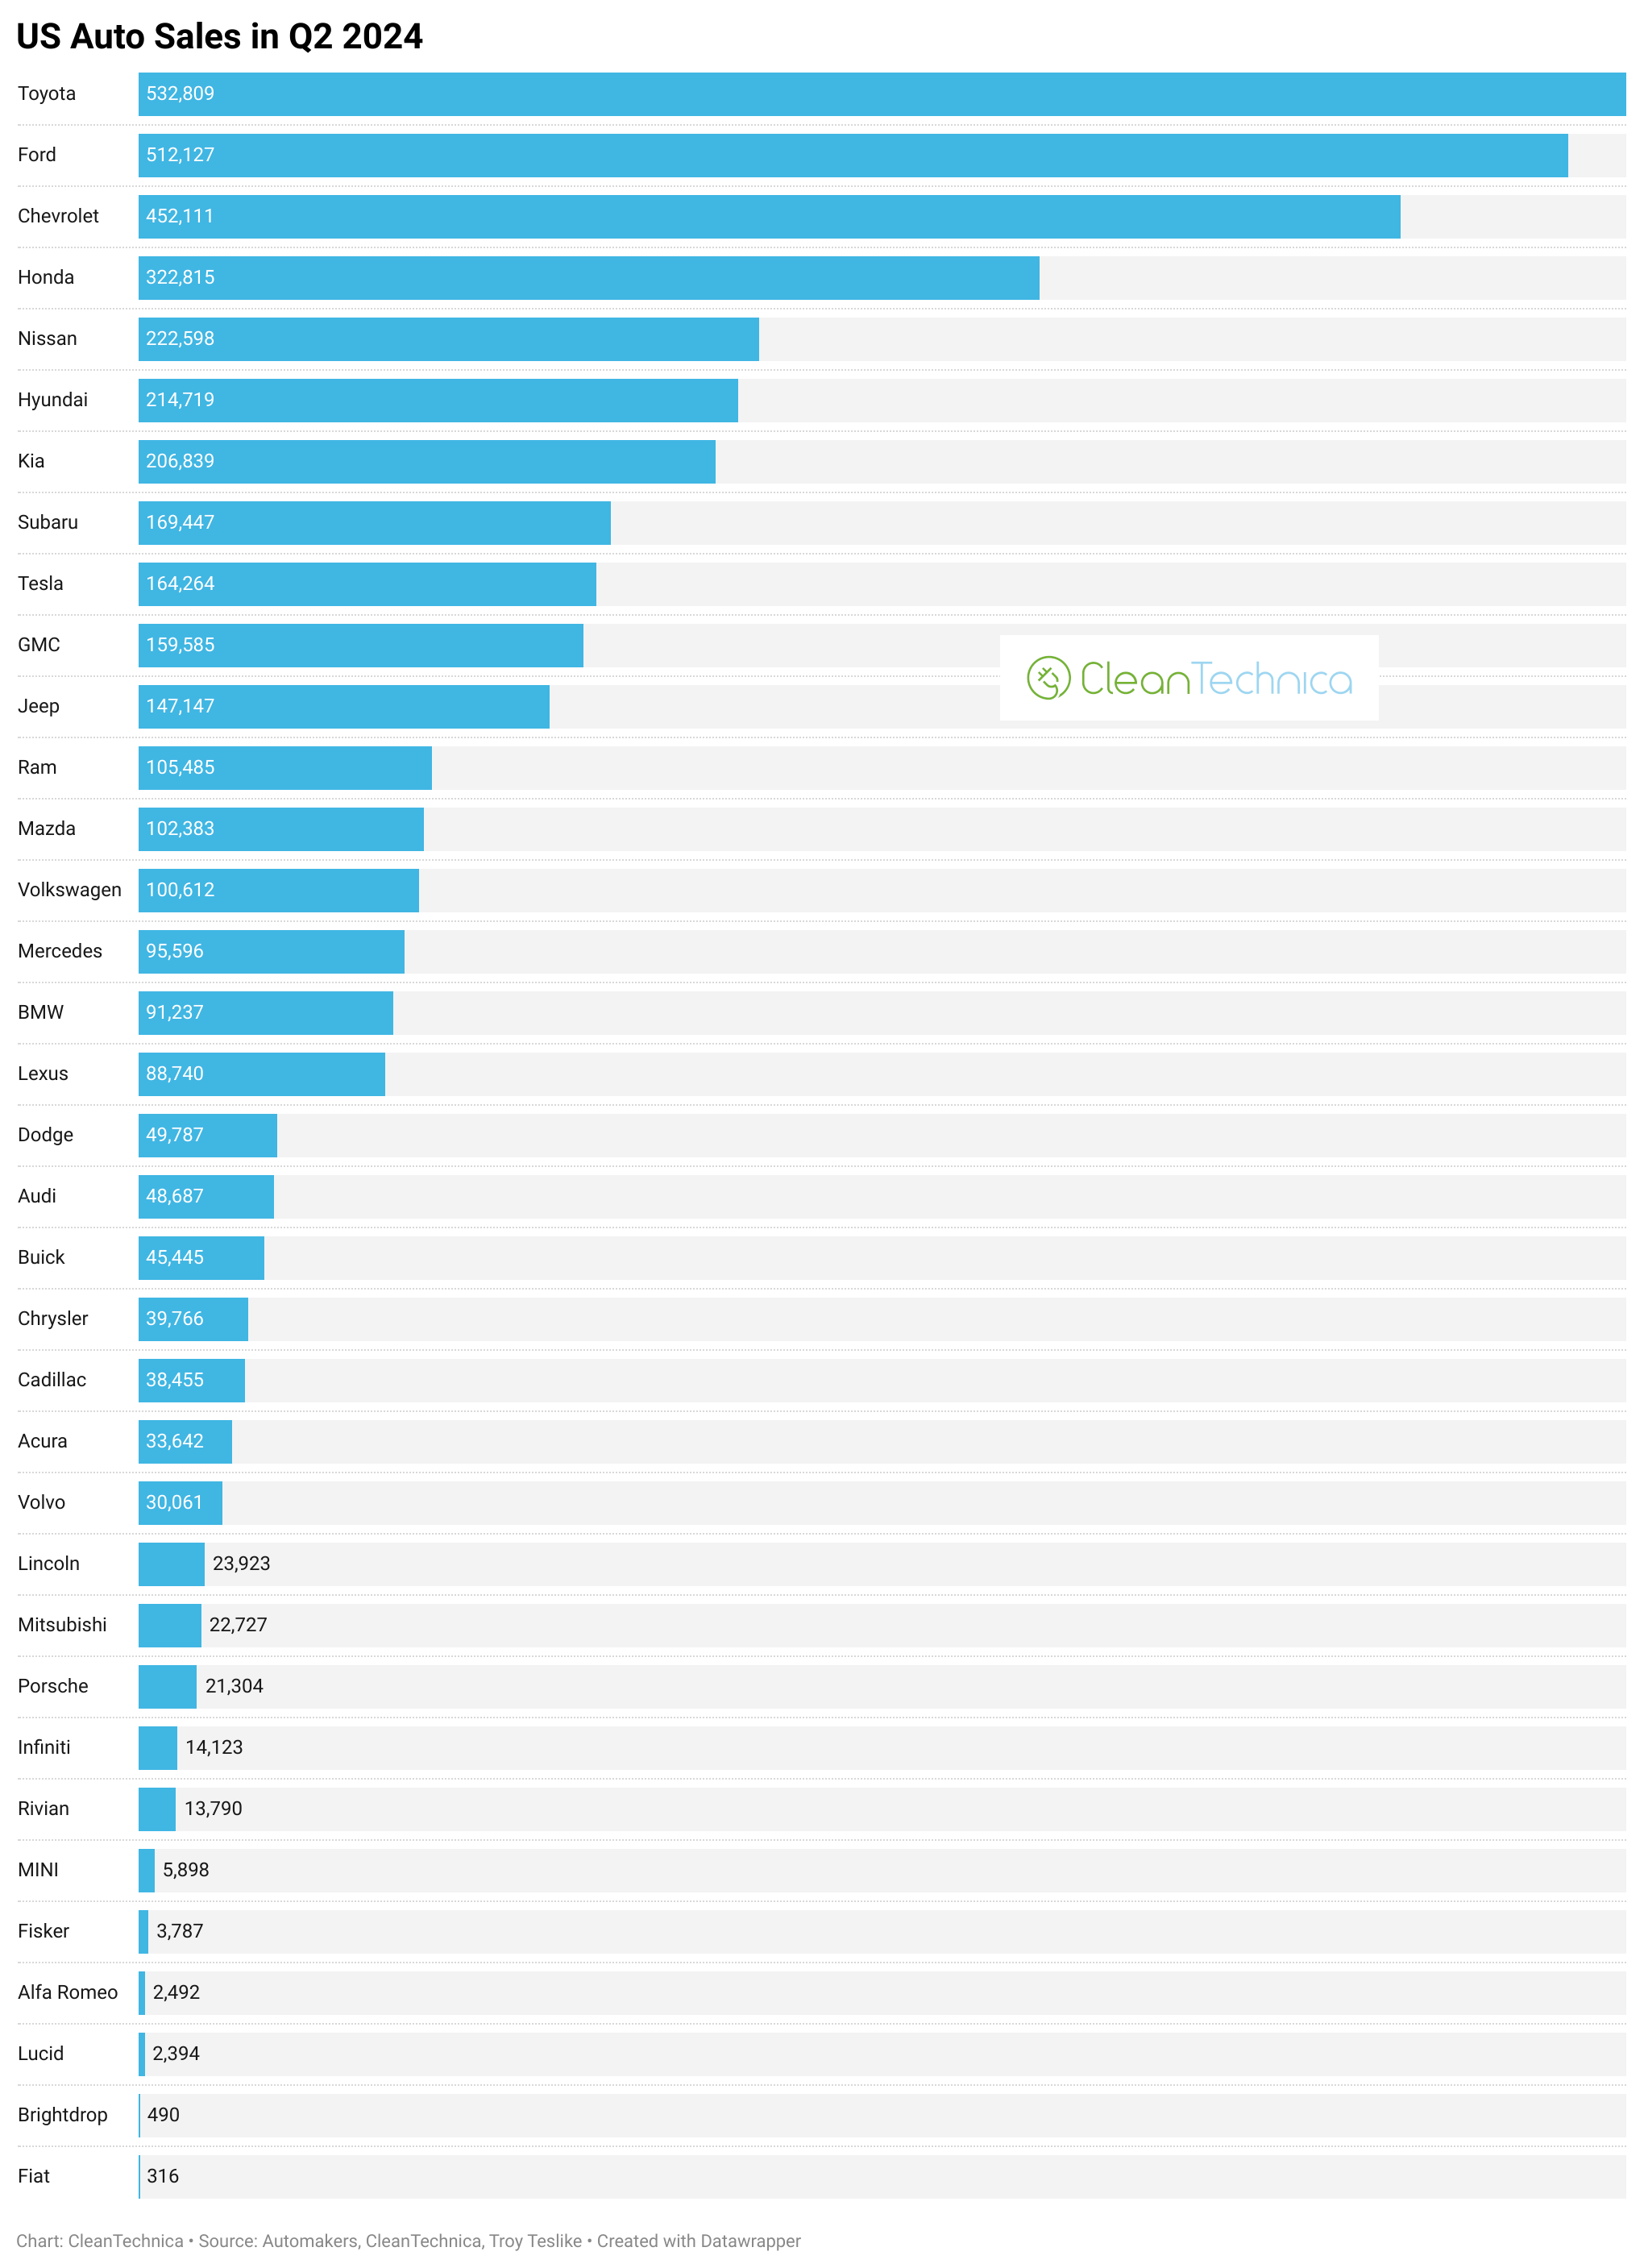
We’ll look at brand-specific year-over-year comparisons in a moment. But, first, here’s the chart of the top selling automakers in the US last quarter:
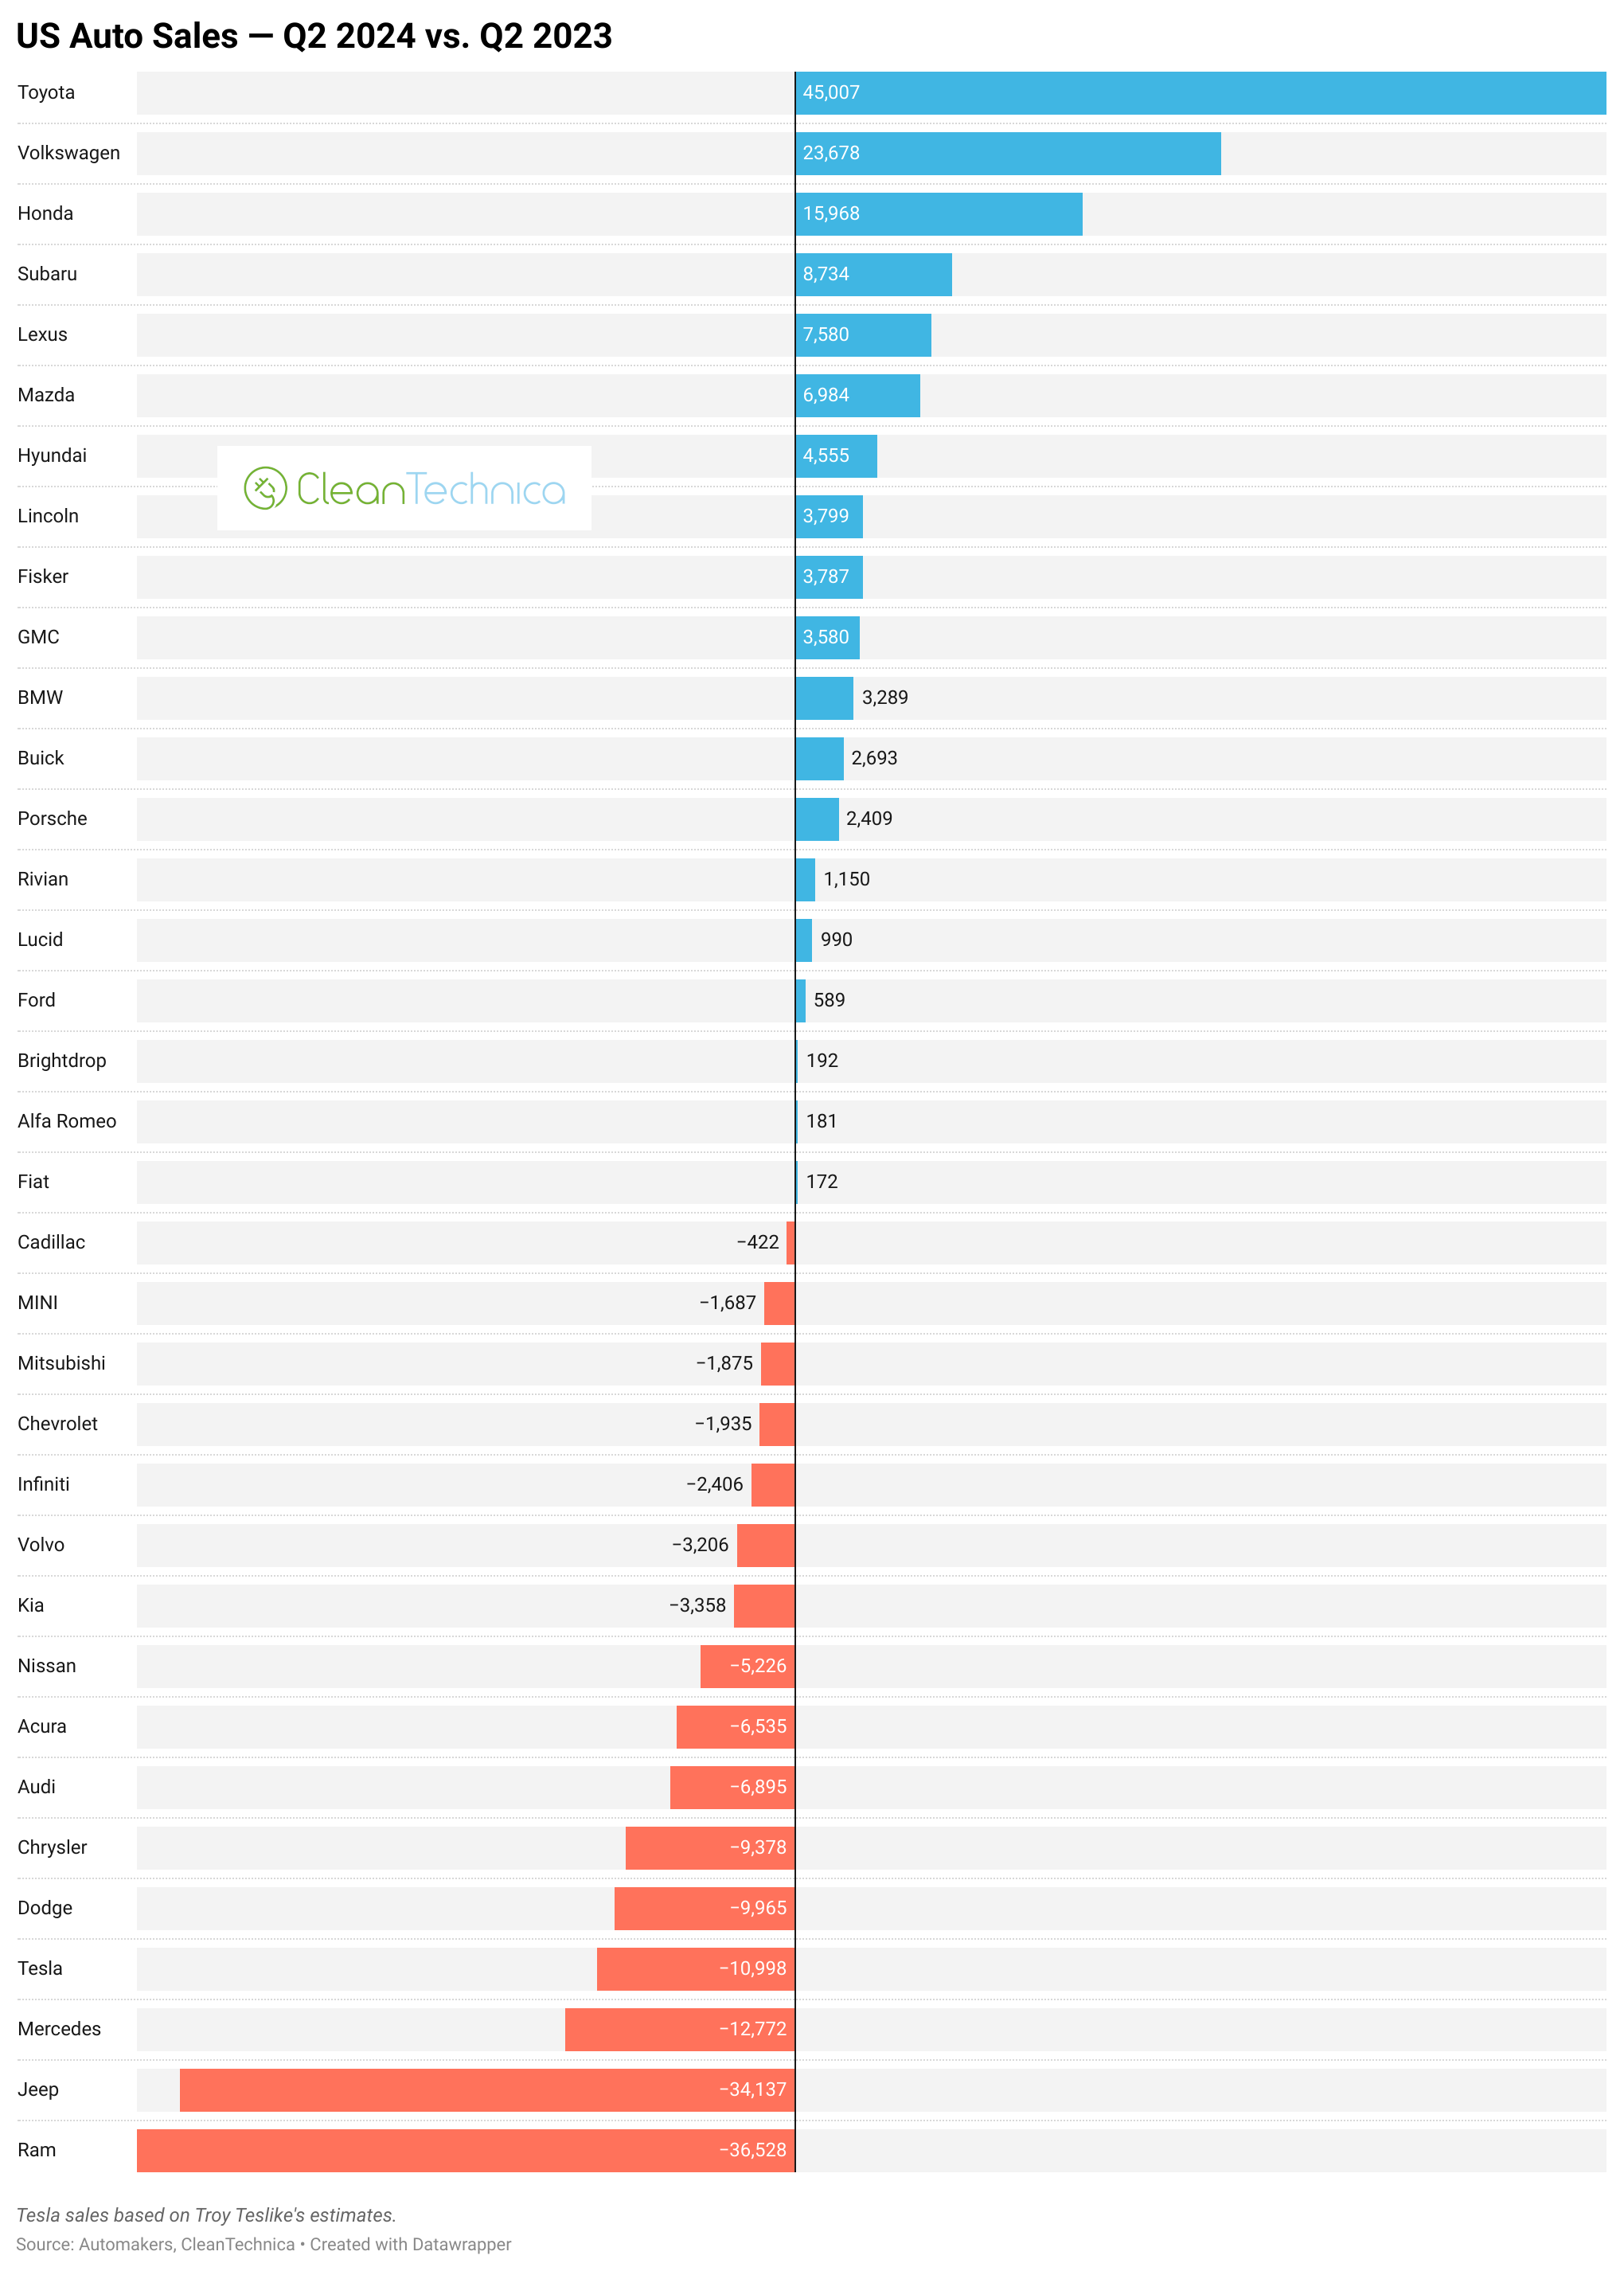
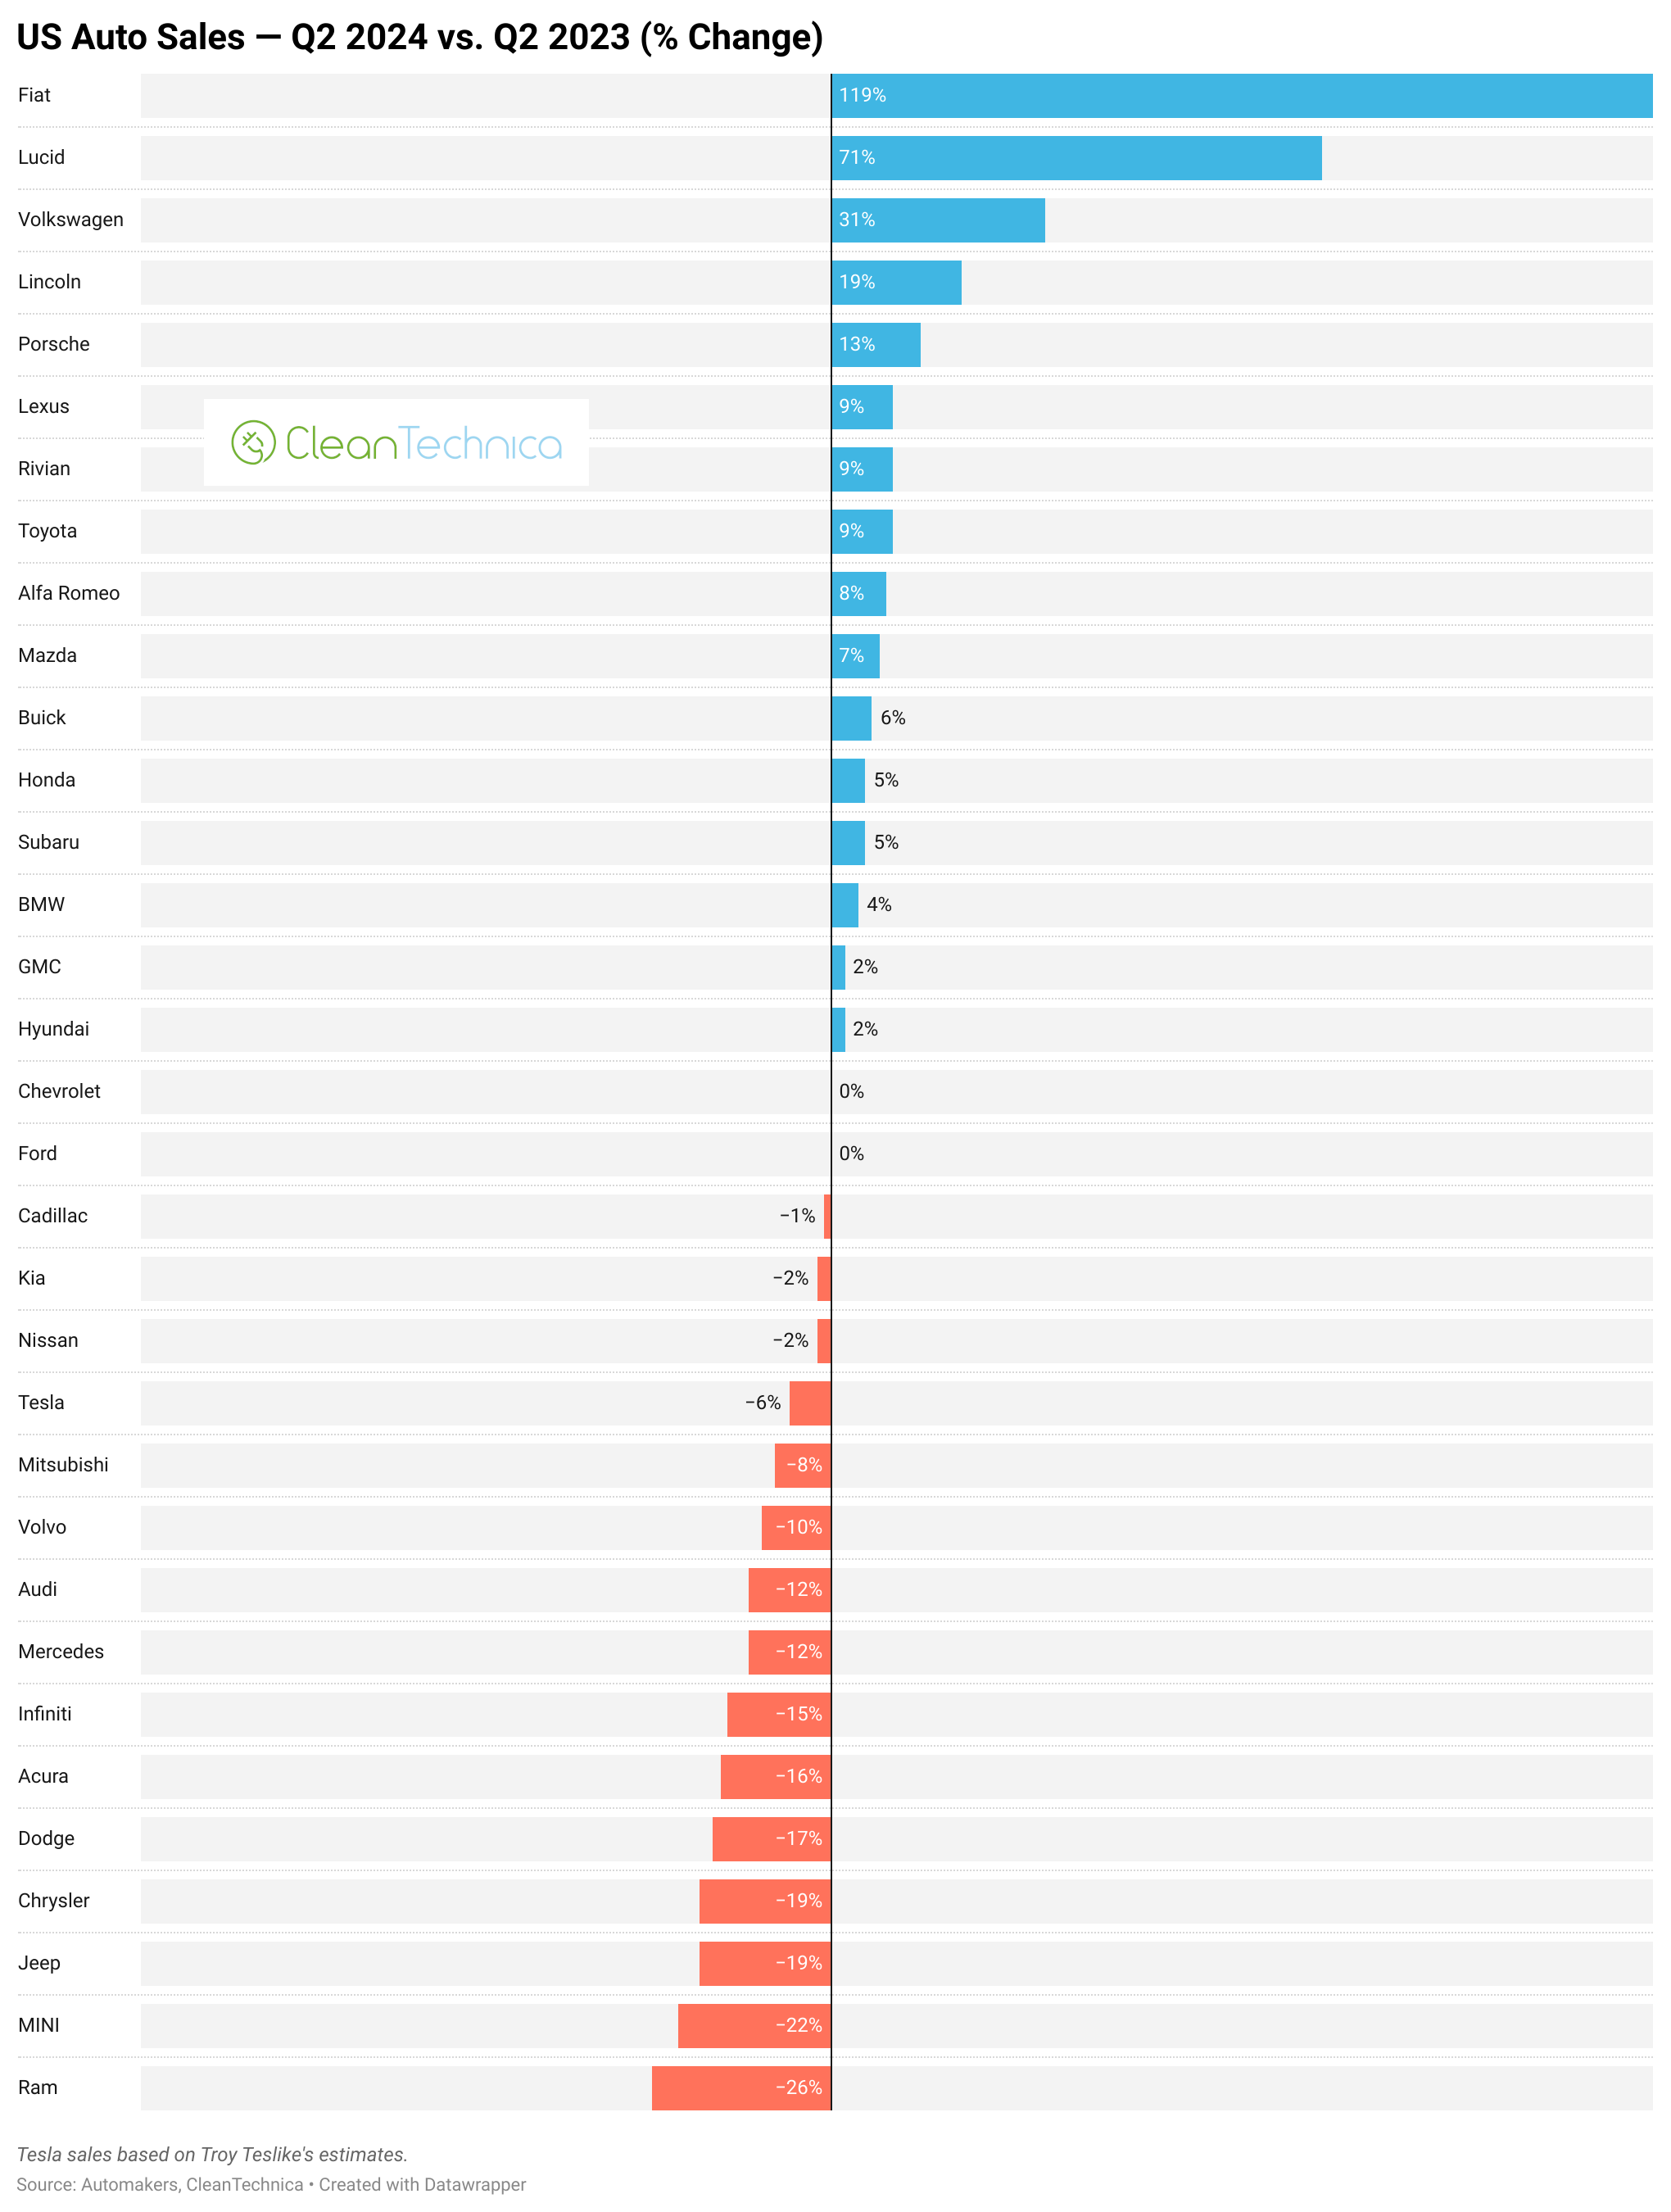
As you can see there, Toyota, Ford, and Chevrolet remain the top three, but the rest are not so far behind them. That said, as you can see in the next charts, Toyota’s sales are up a lot, while Ford’s sales are up a tiny bit and Chevrolet’s sales are down a bit. Next in line, Honda’s sales are up a lot (even if only ⅓ as much as Toyota’s), Hyundai’s sales are also up, and Kia’s sales are down a bit.
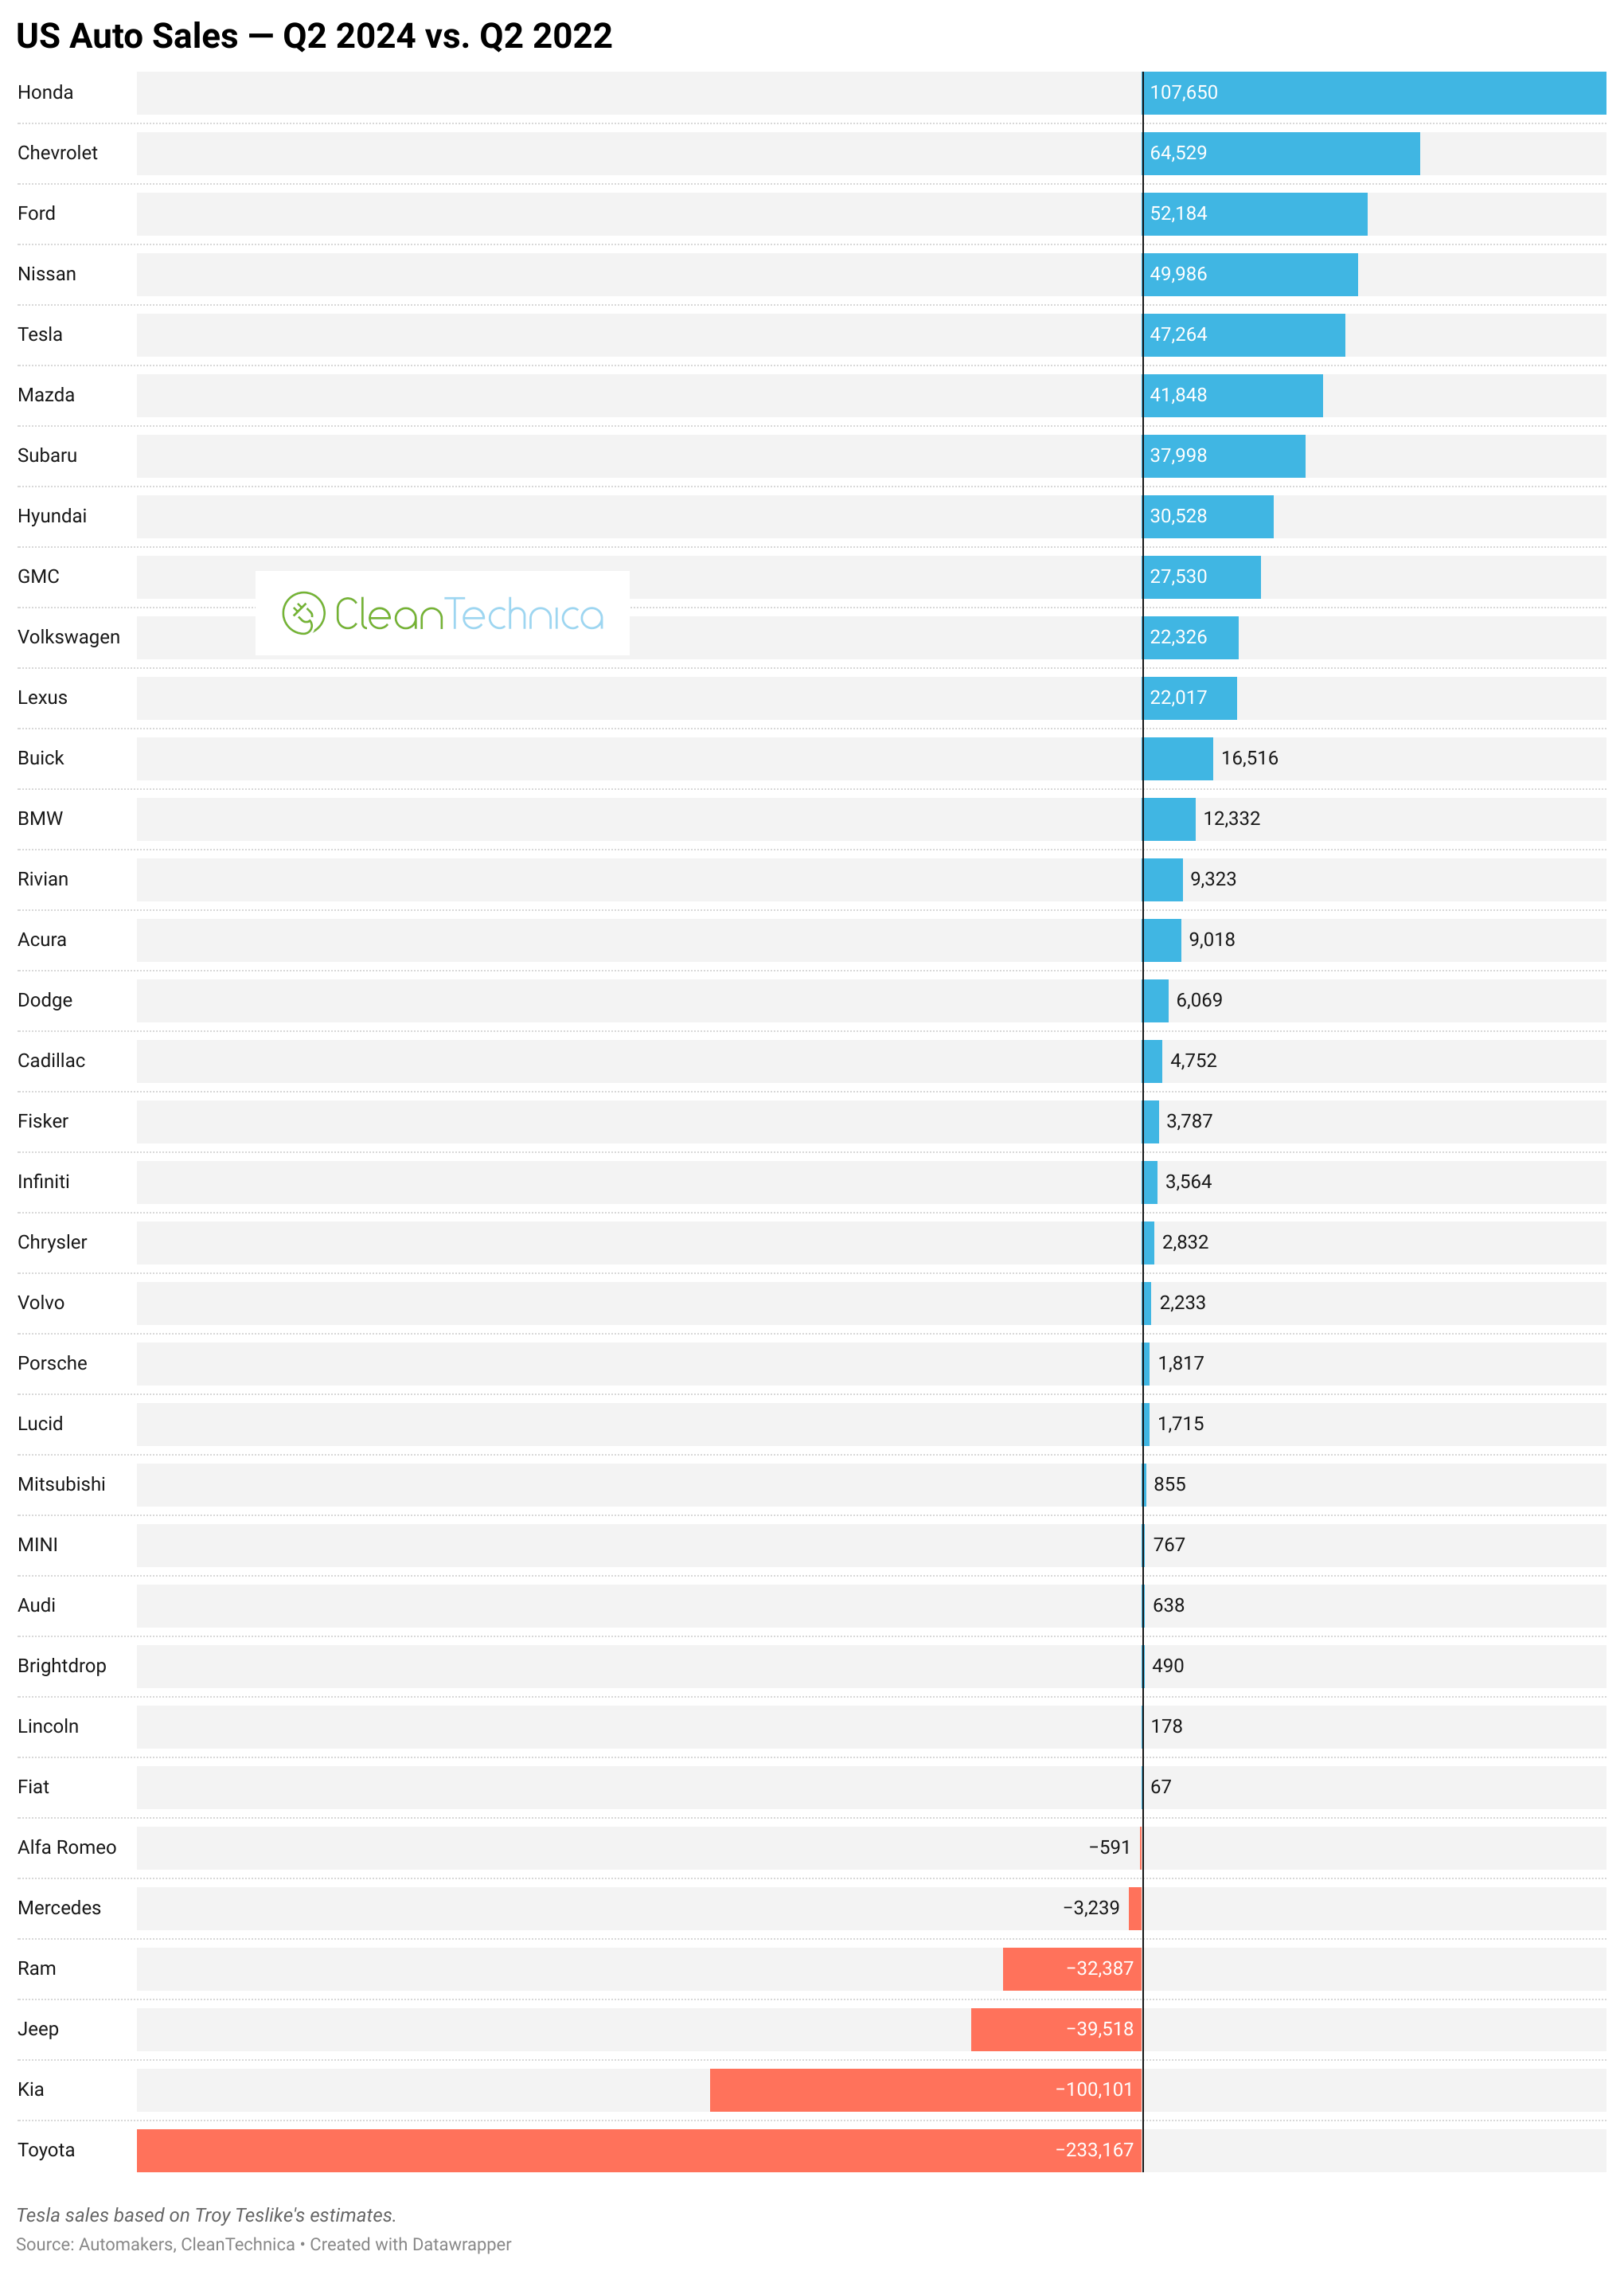
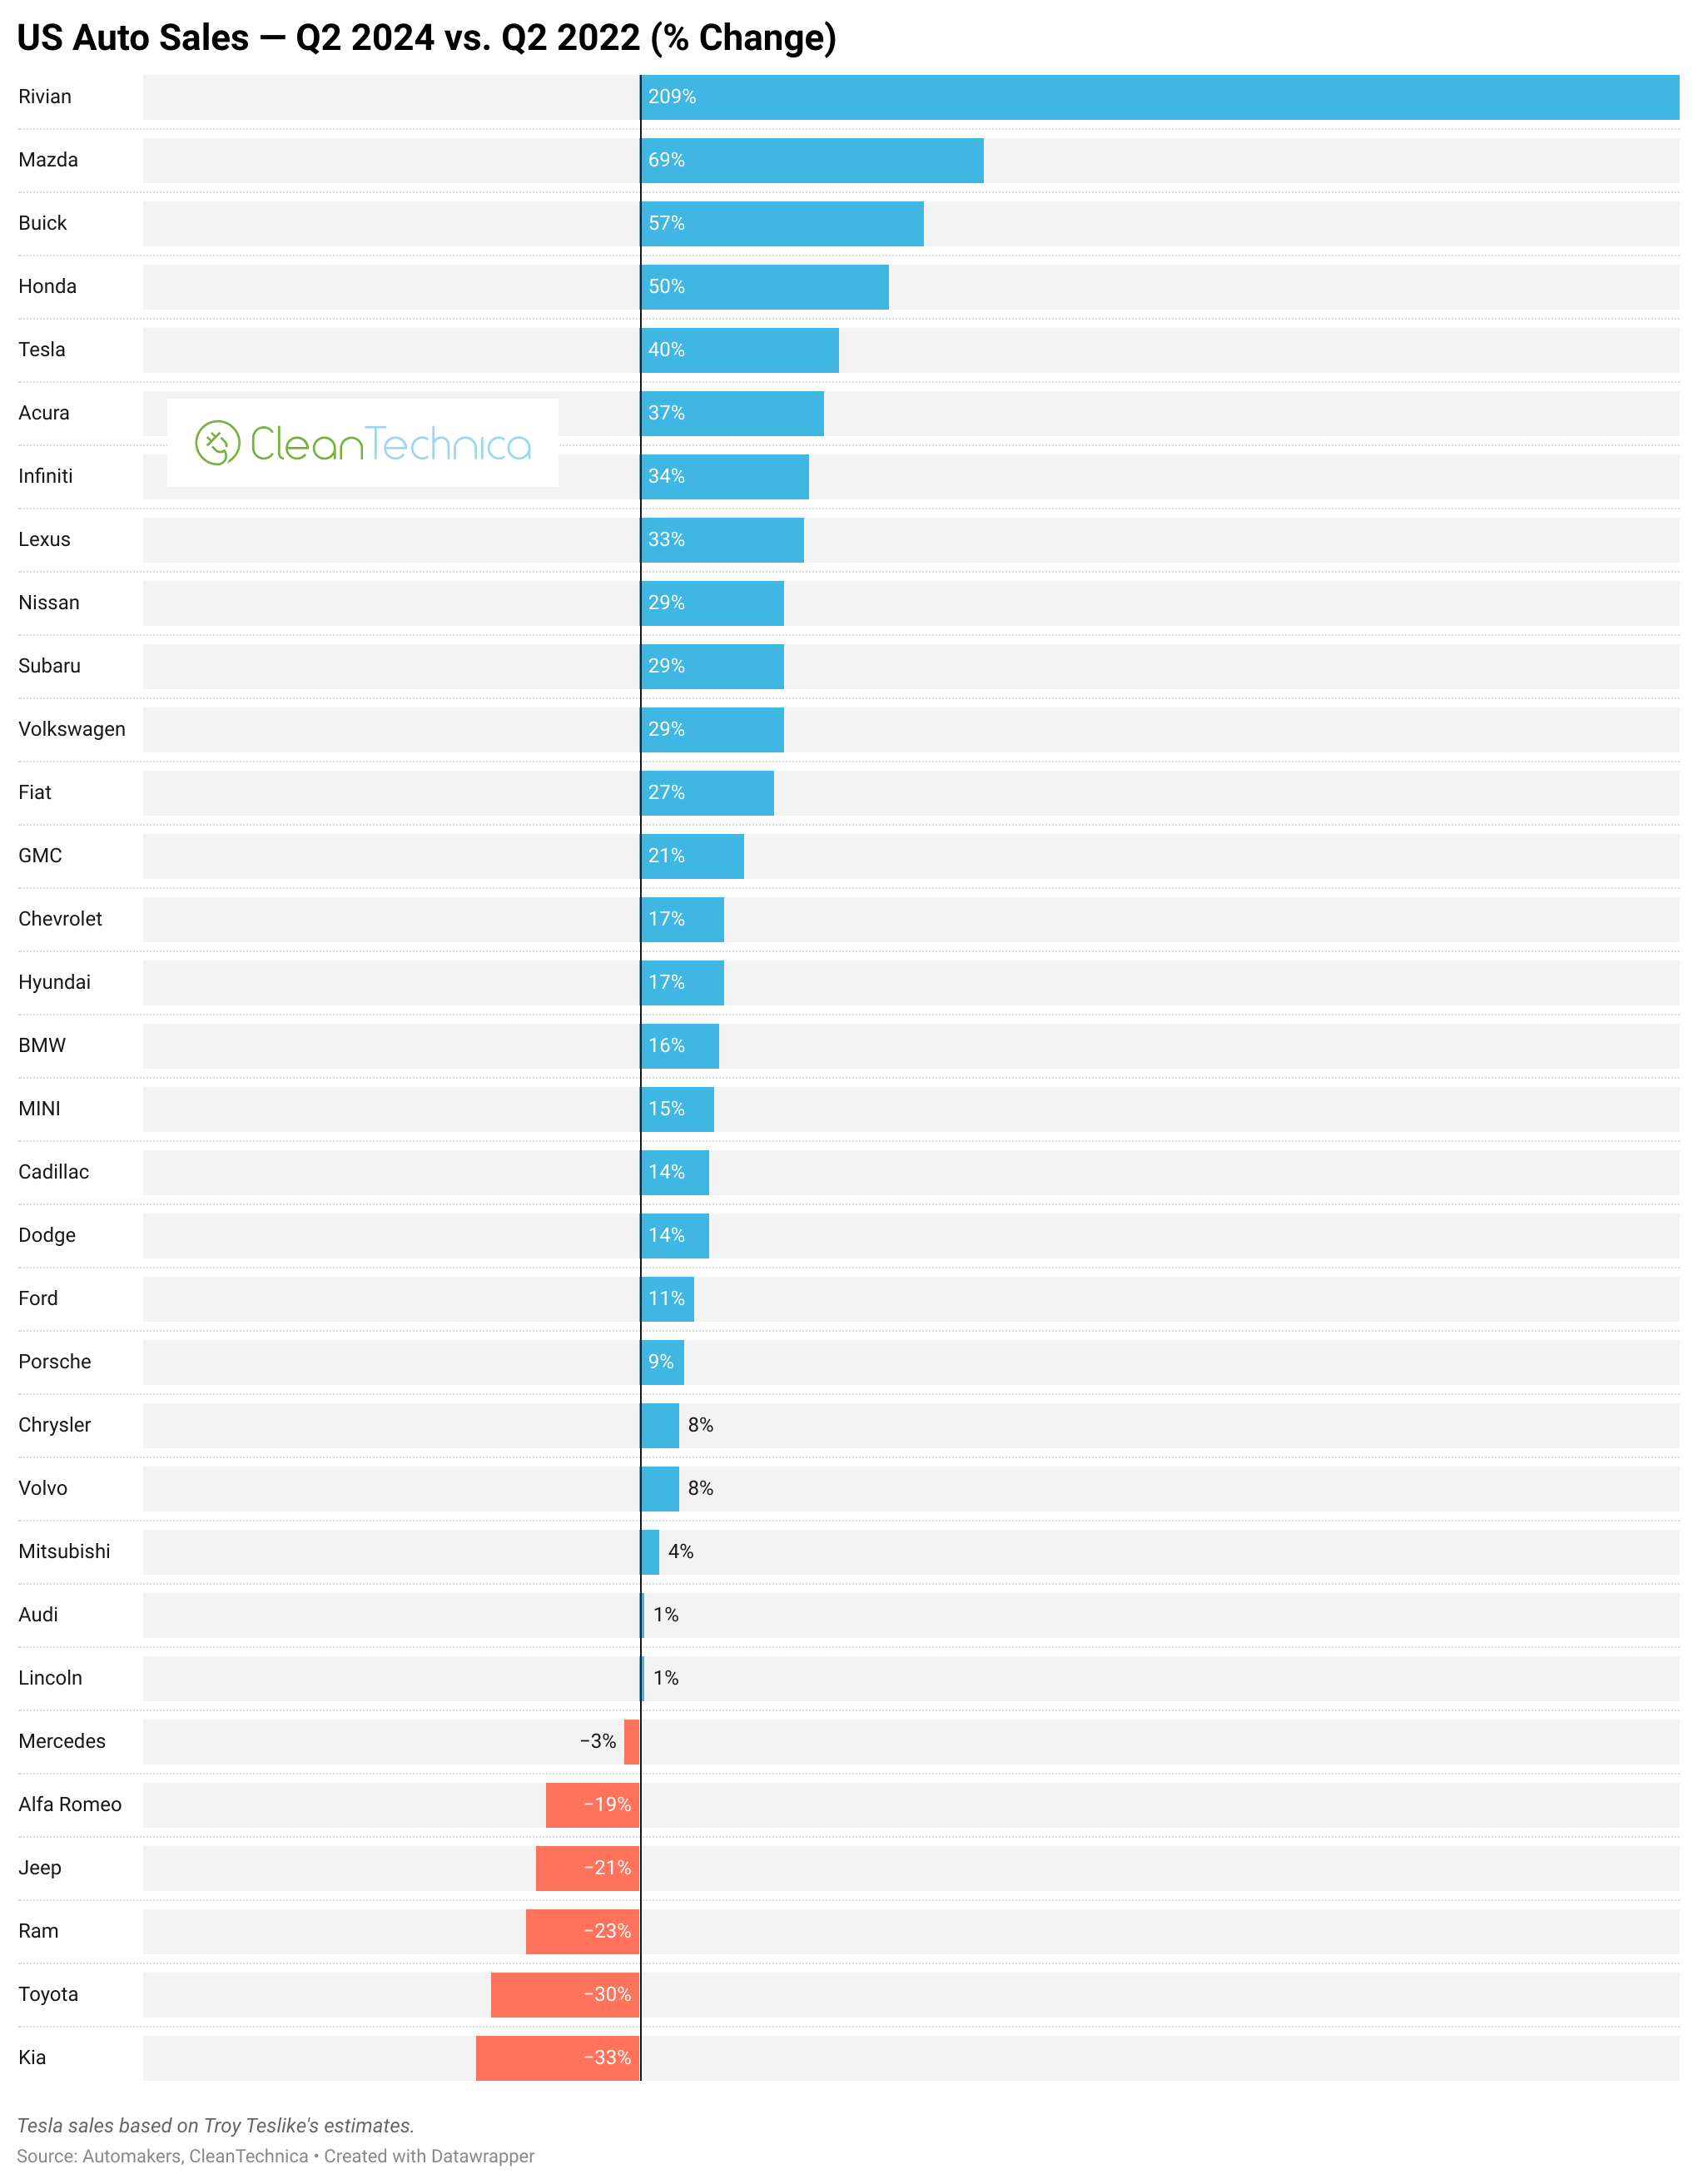
Compared to 2022, we can see (via the charts below) the big winners are Honda, Chevrolet, Ford, Nissan, and Tesla — in volume terms. In percentage terms, Rivian (+209%), Mazda (+69%), Buick (+57%), Honda (+50%), and Tesla (+40%) took the top spots. The first three there were climbing from rather low starting points, whereas Honda and Tesla had strong percentage growth on top of pretty strong starting points.
Meanwhile, Toyota has hemorrhaged sales compared to 2022, and Kia didn’t do too well either.
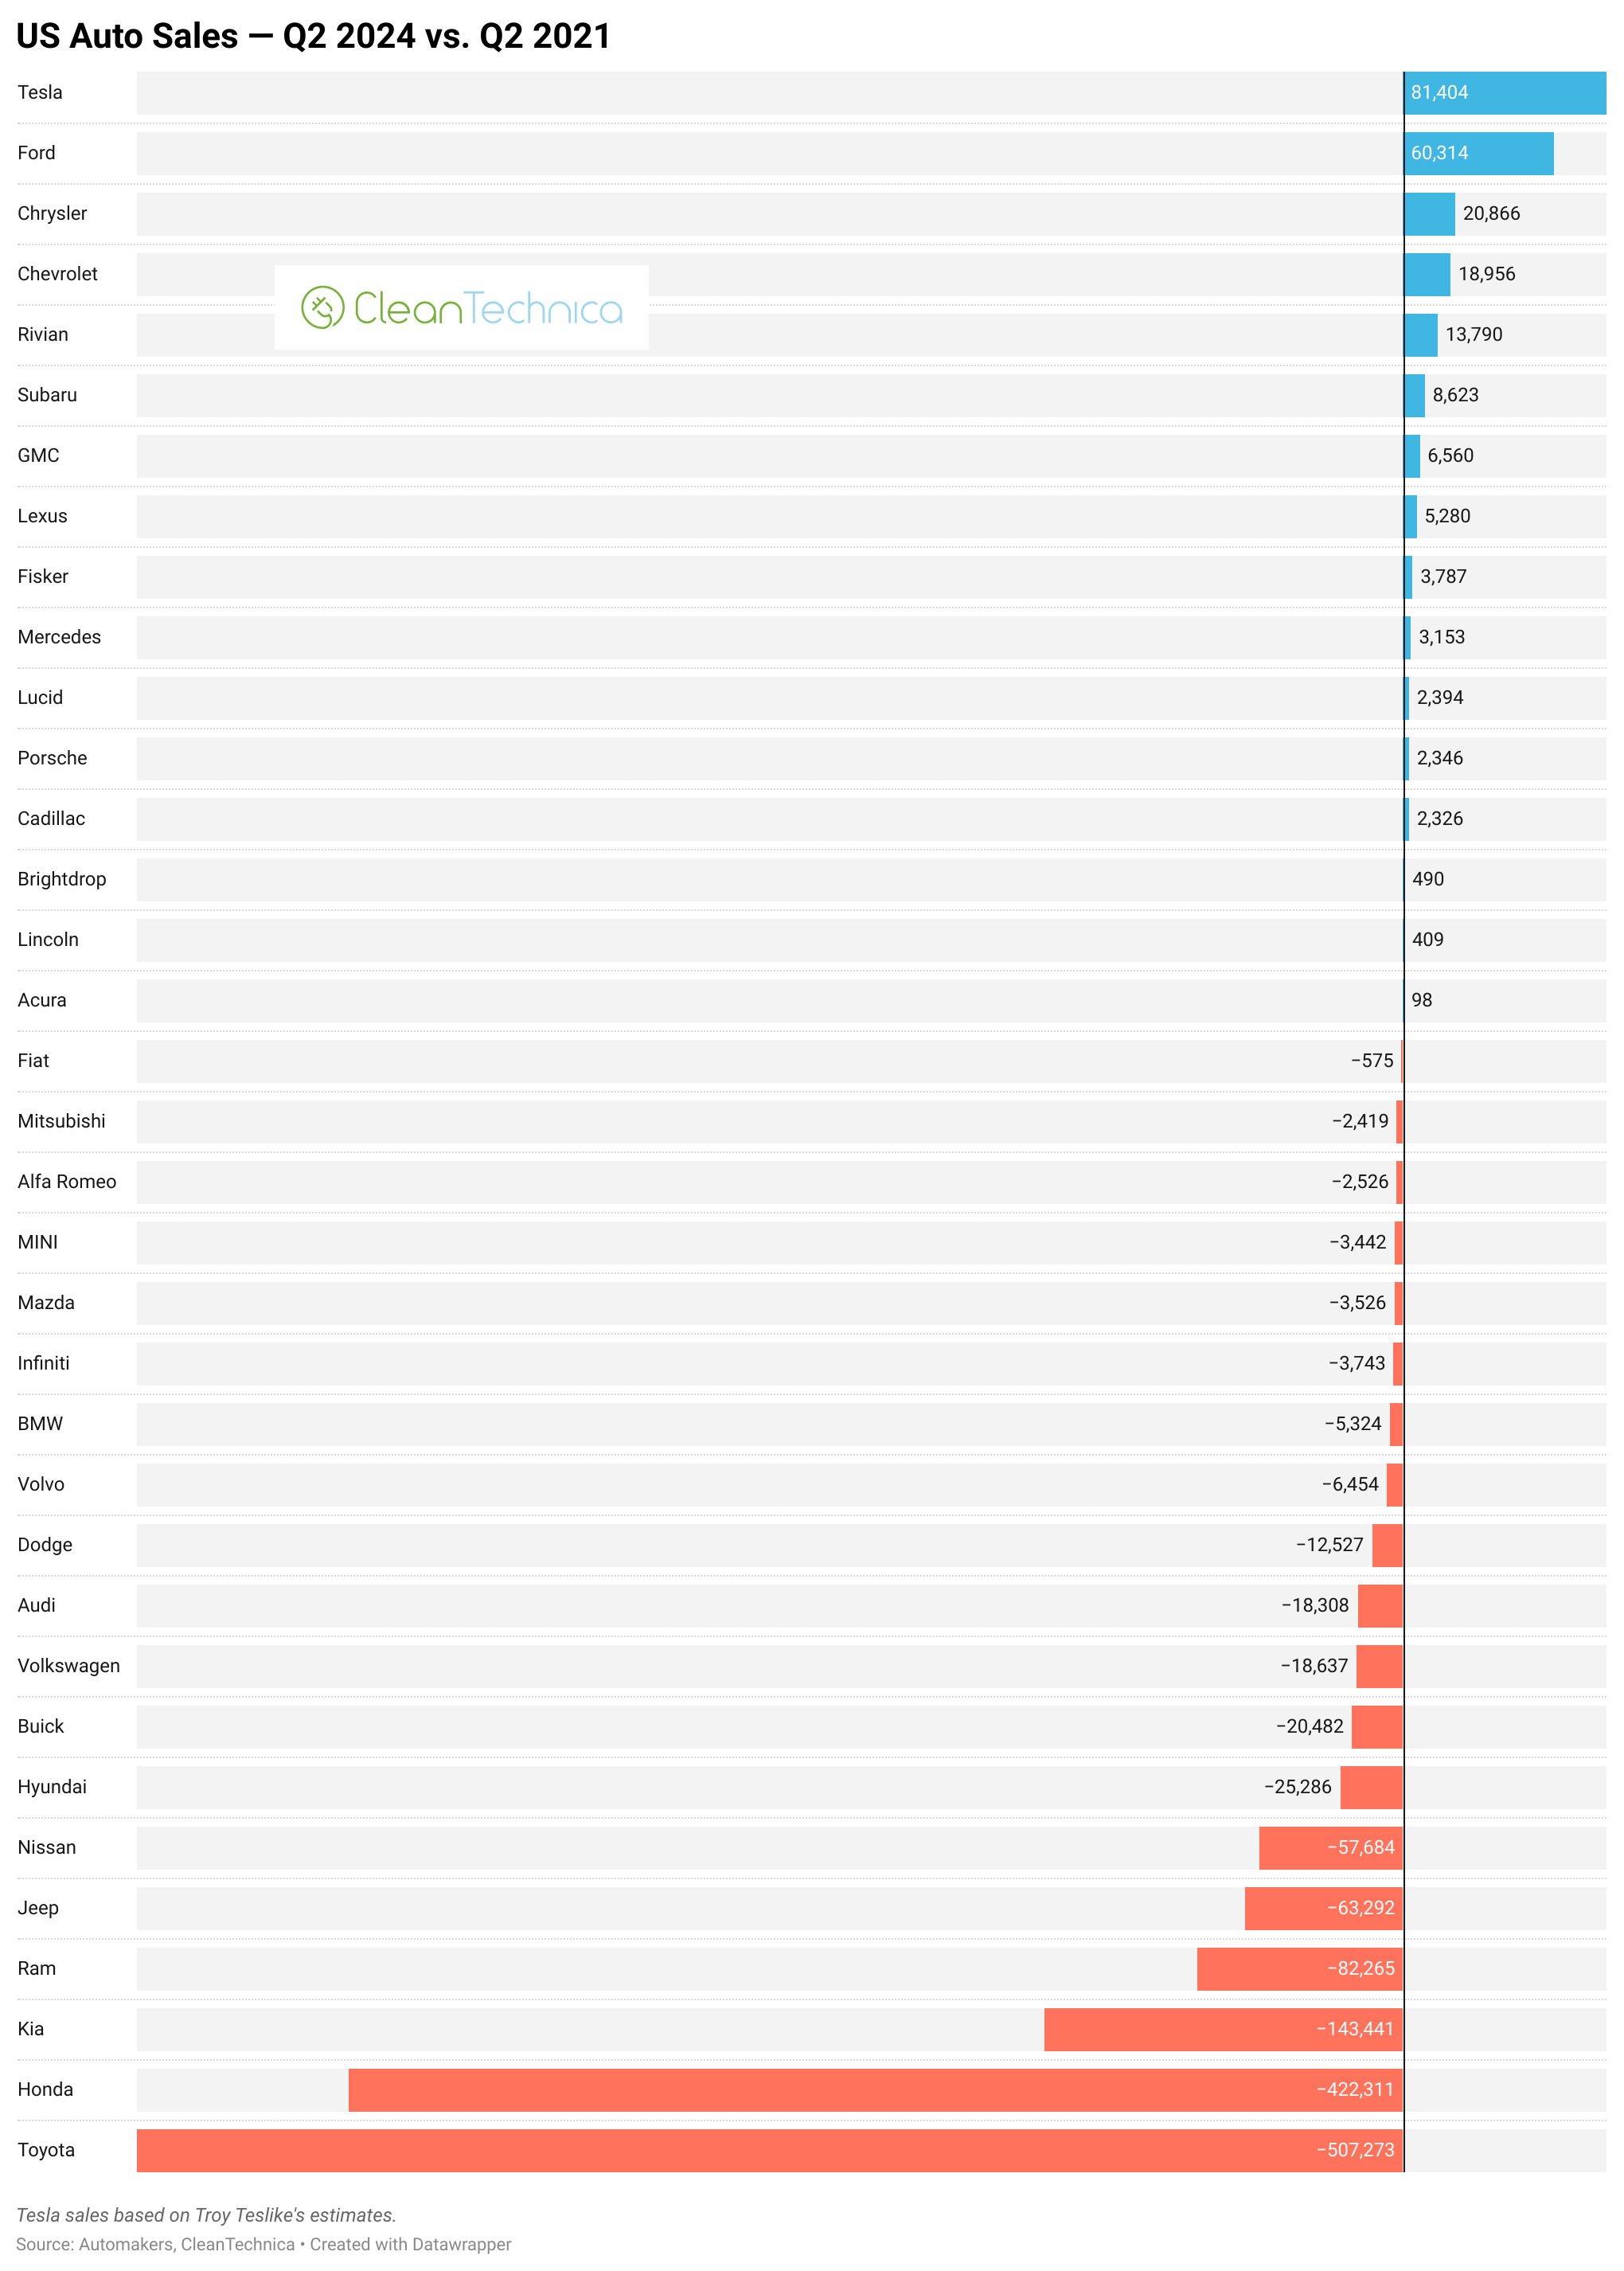
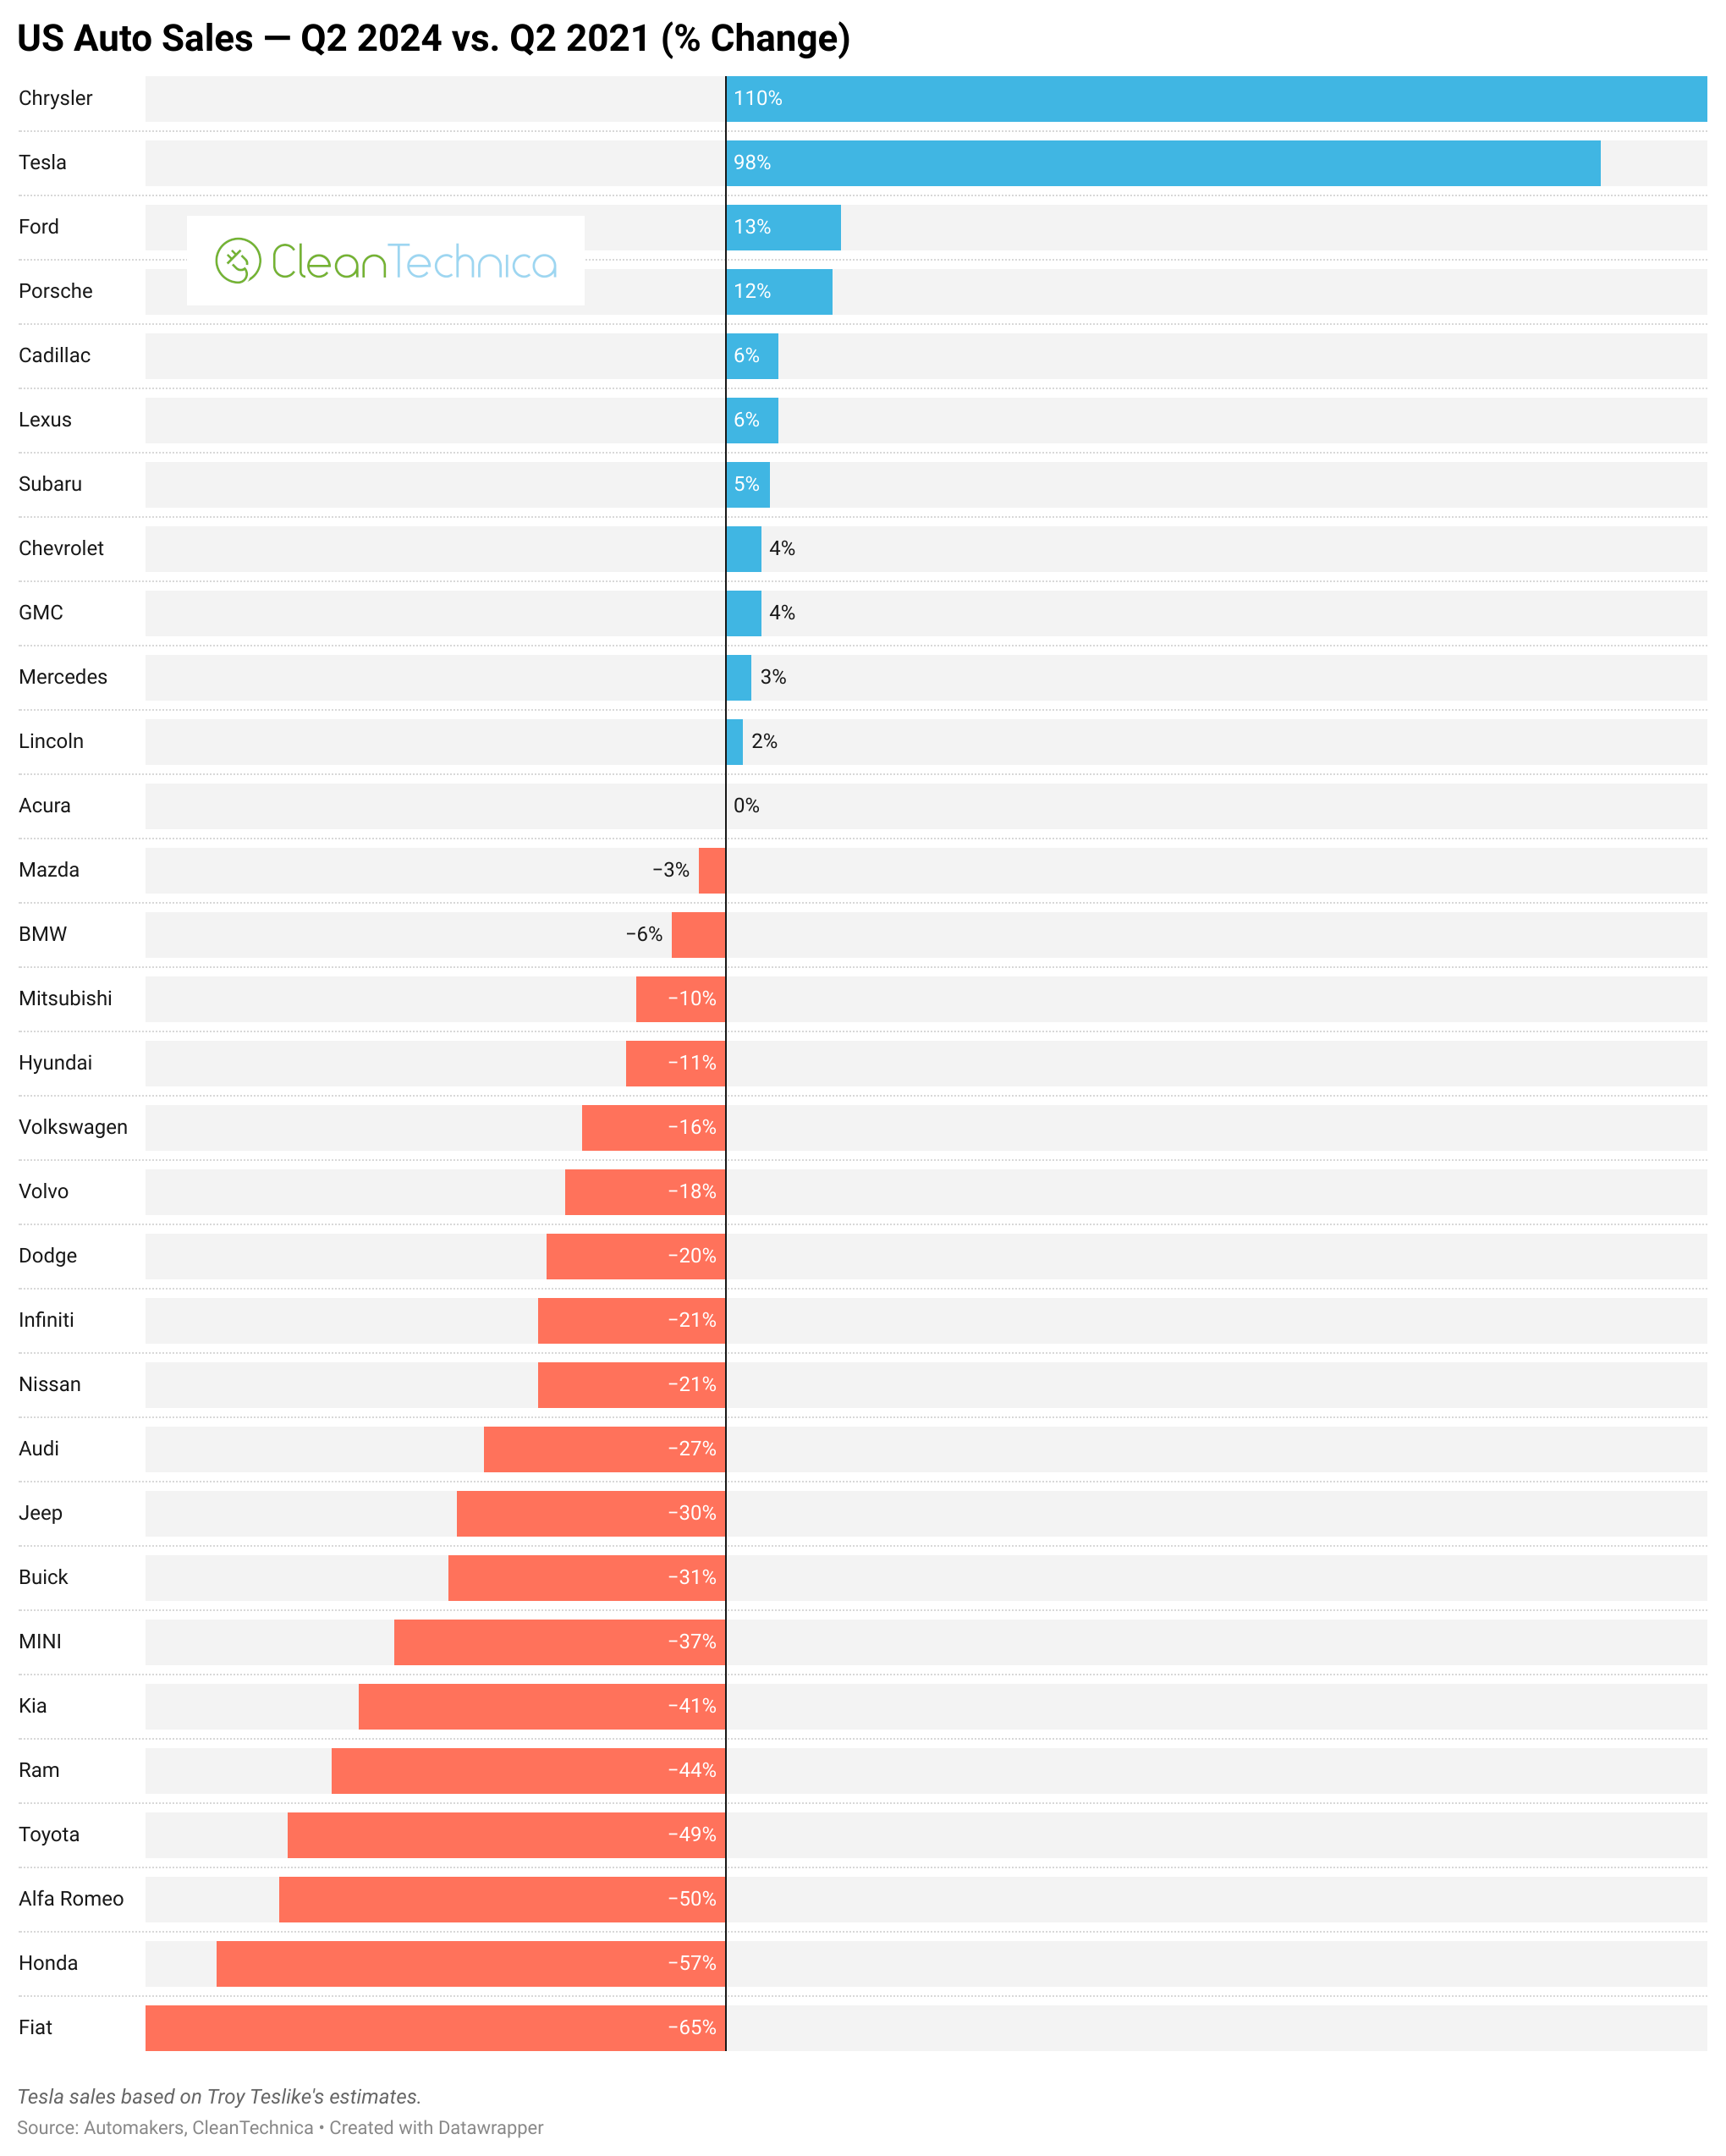
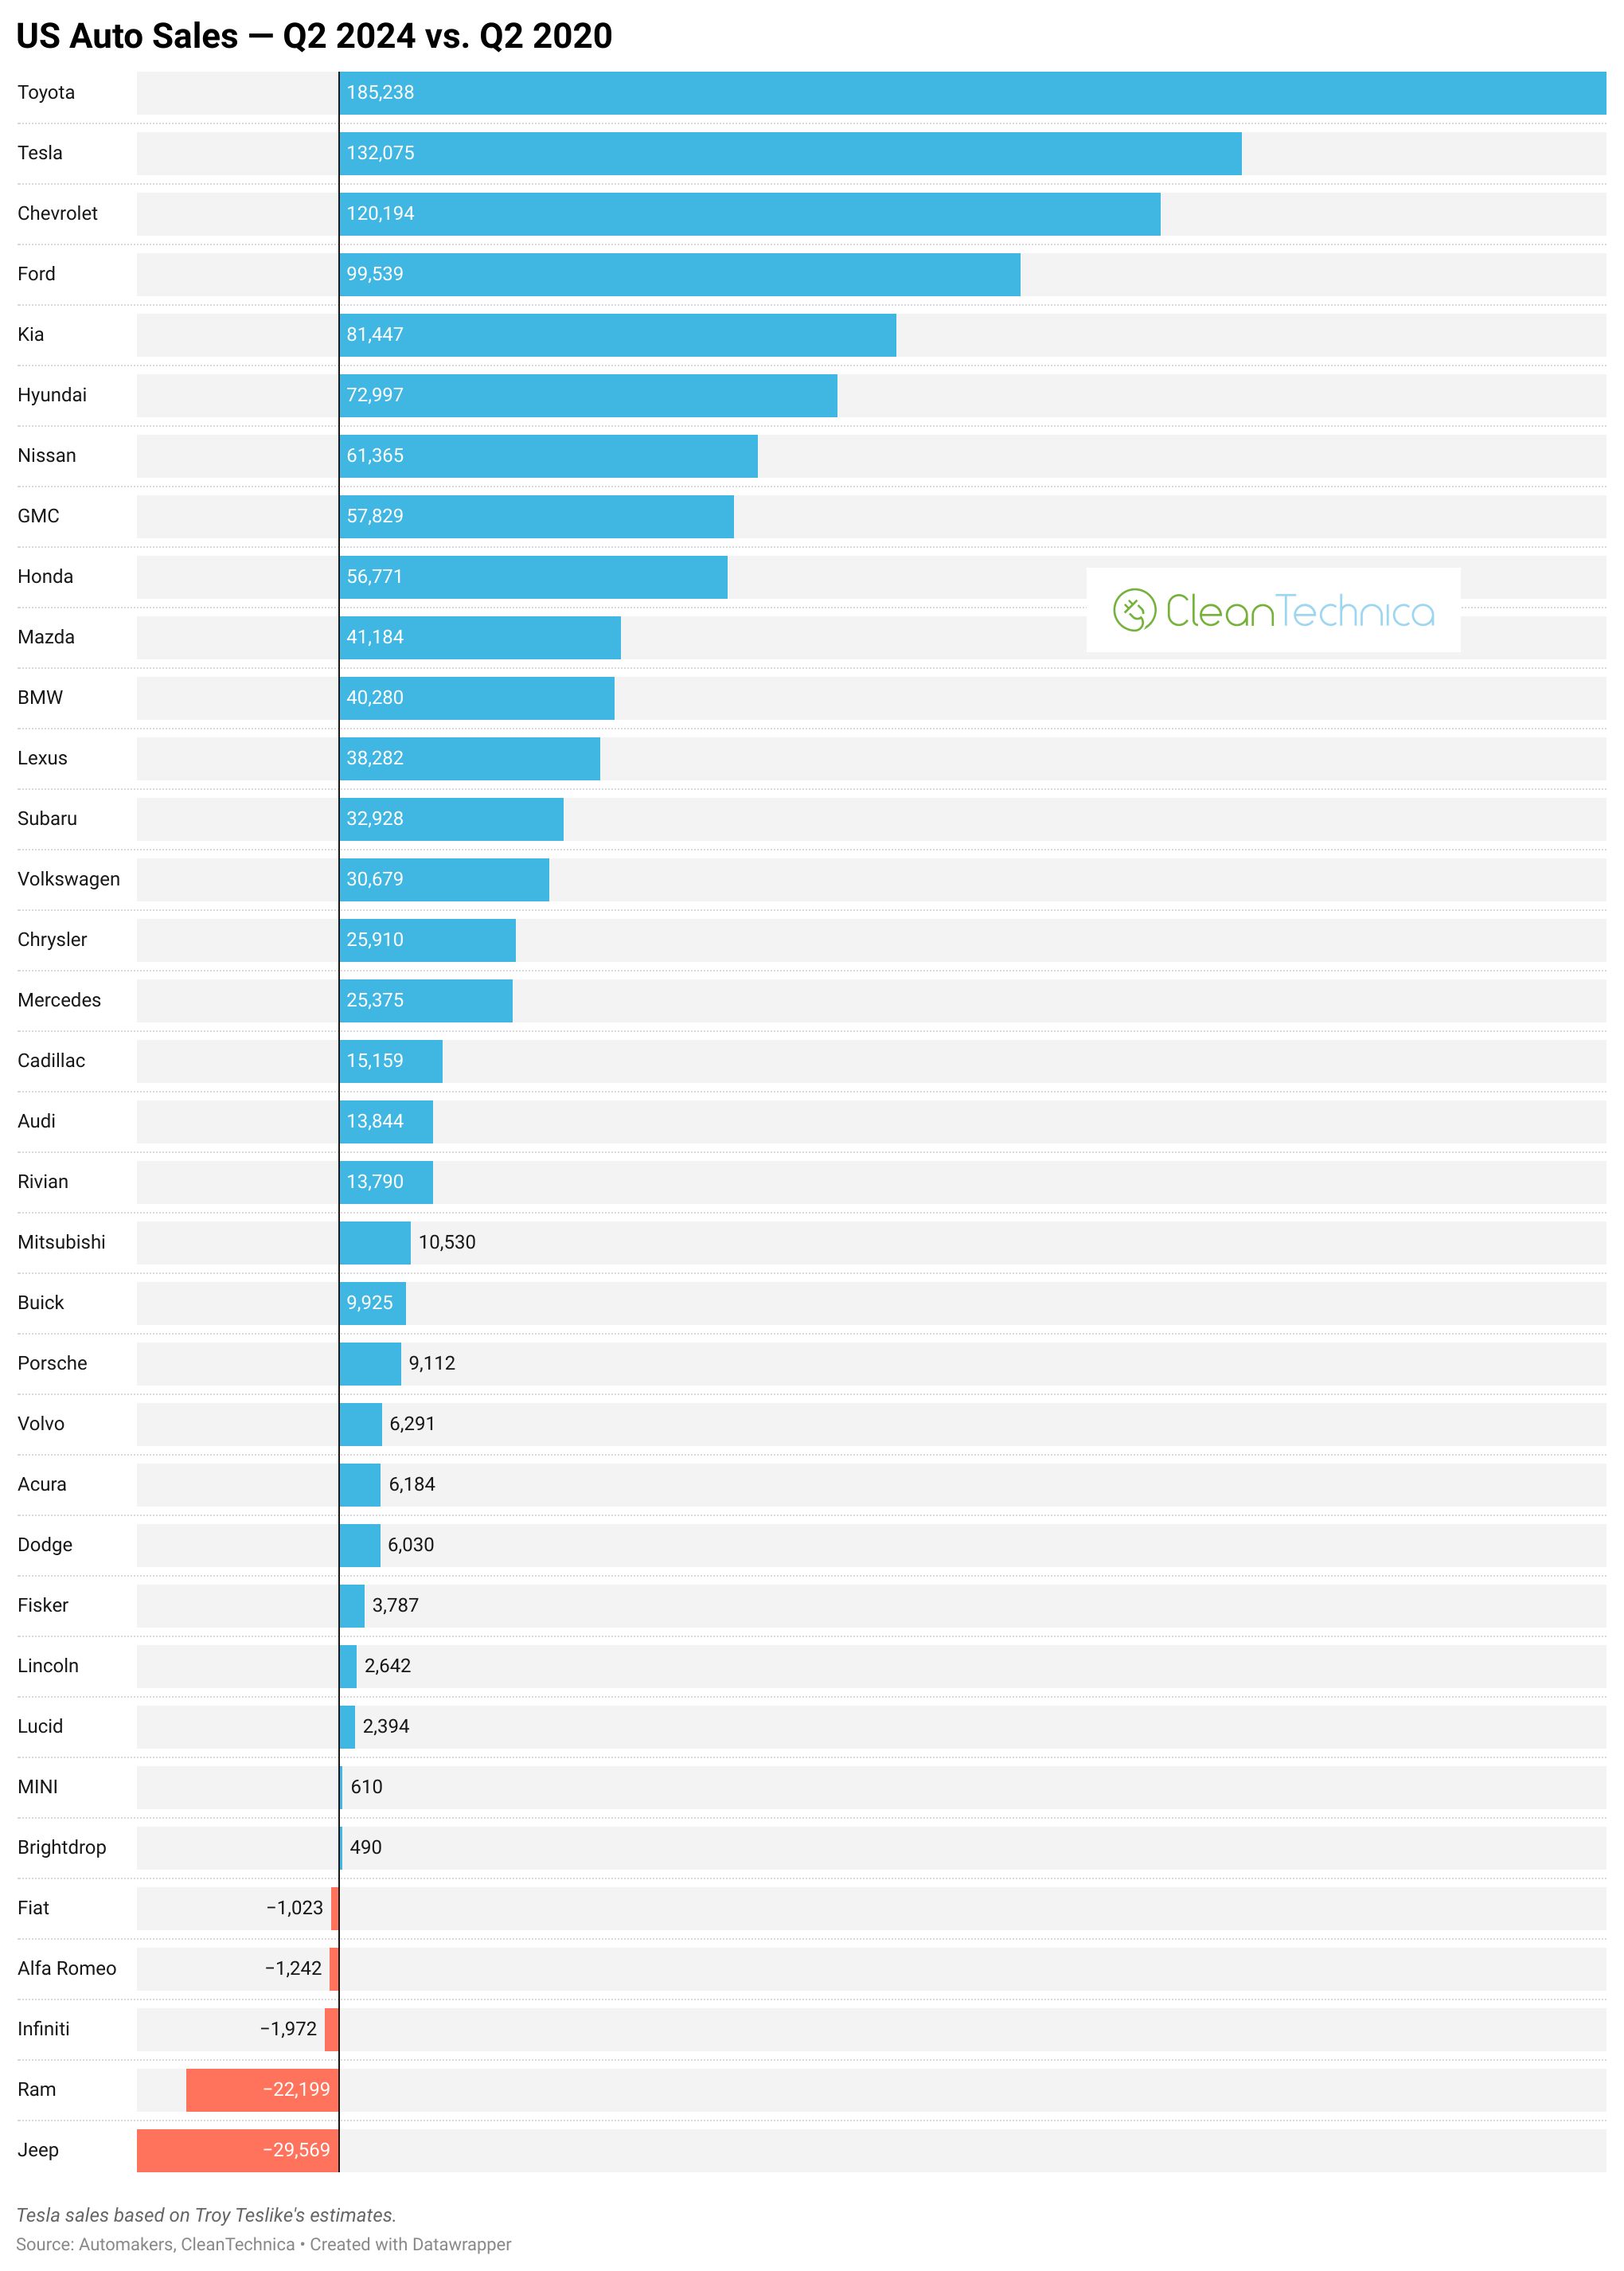
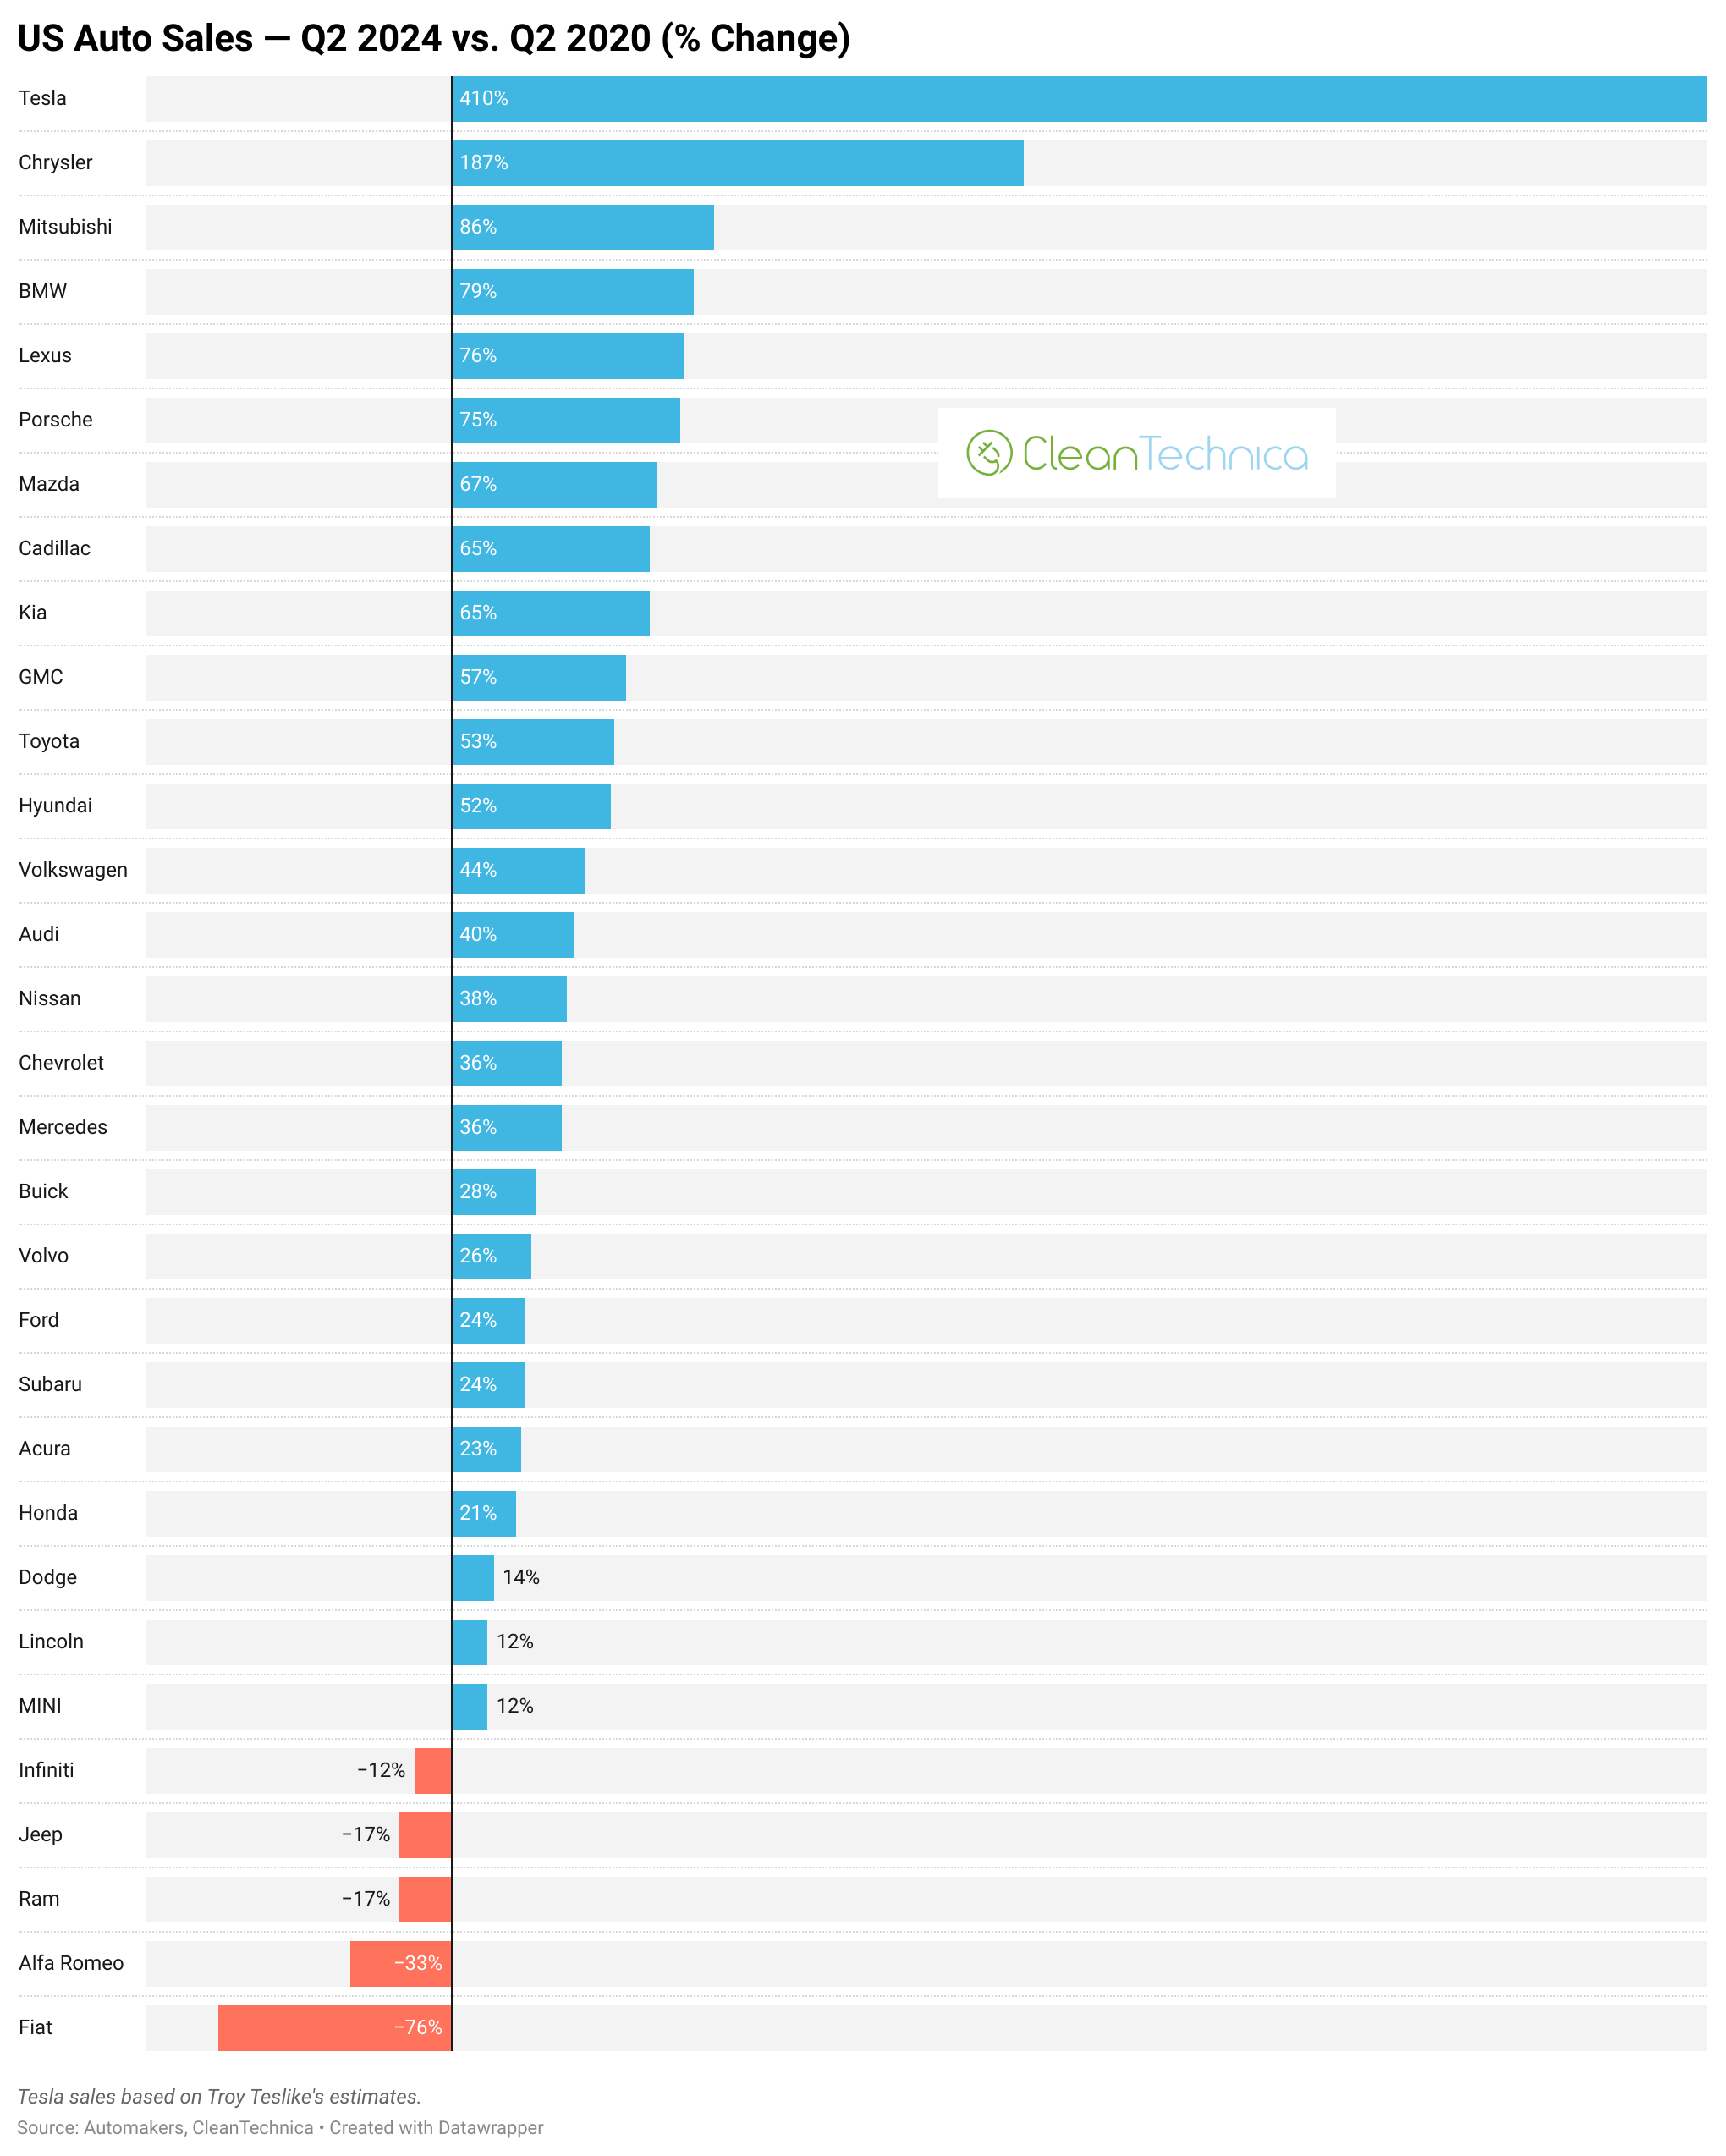
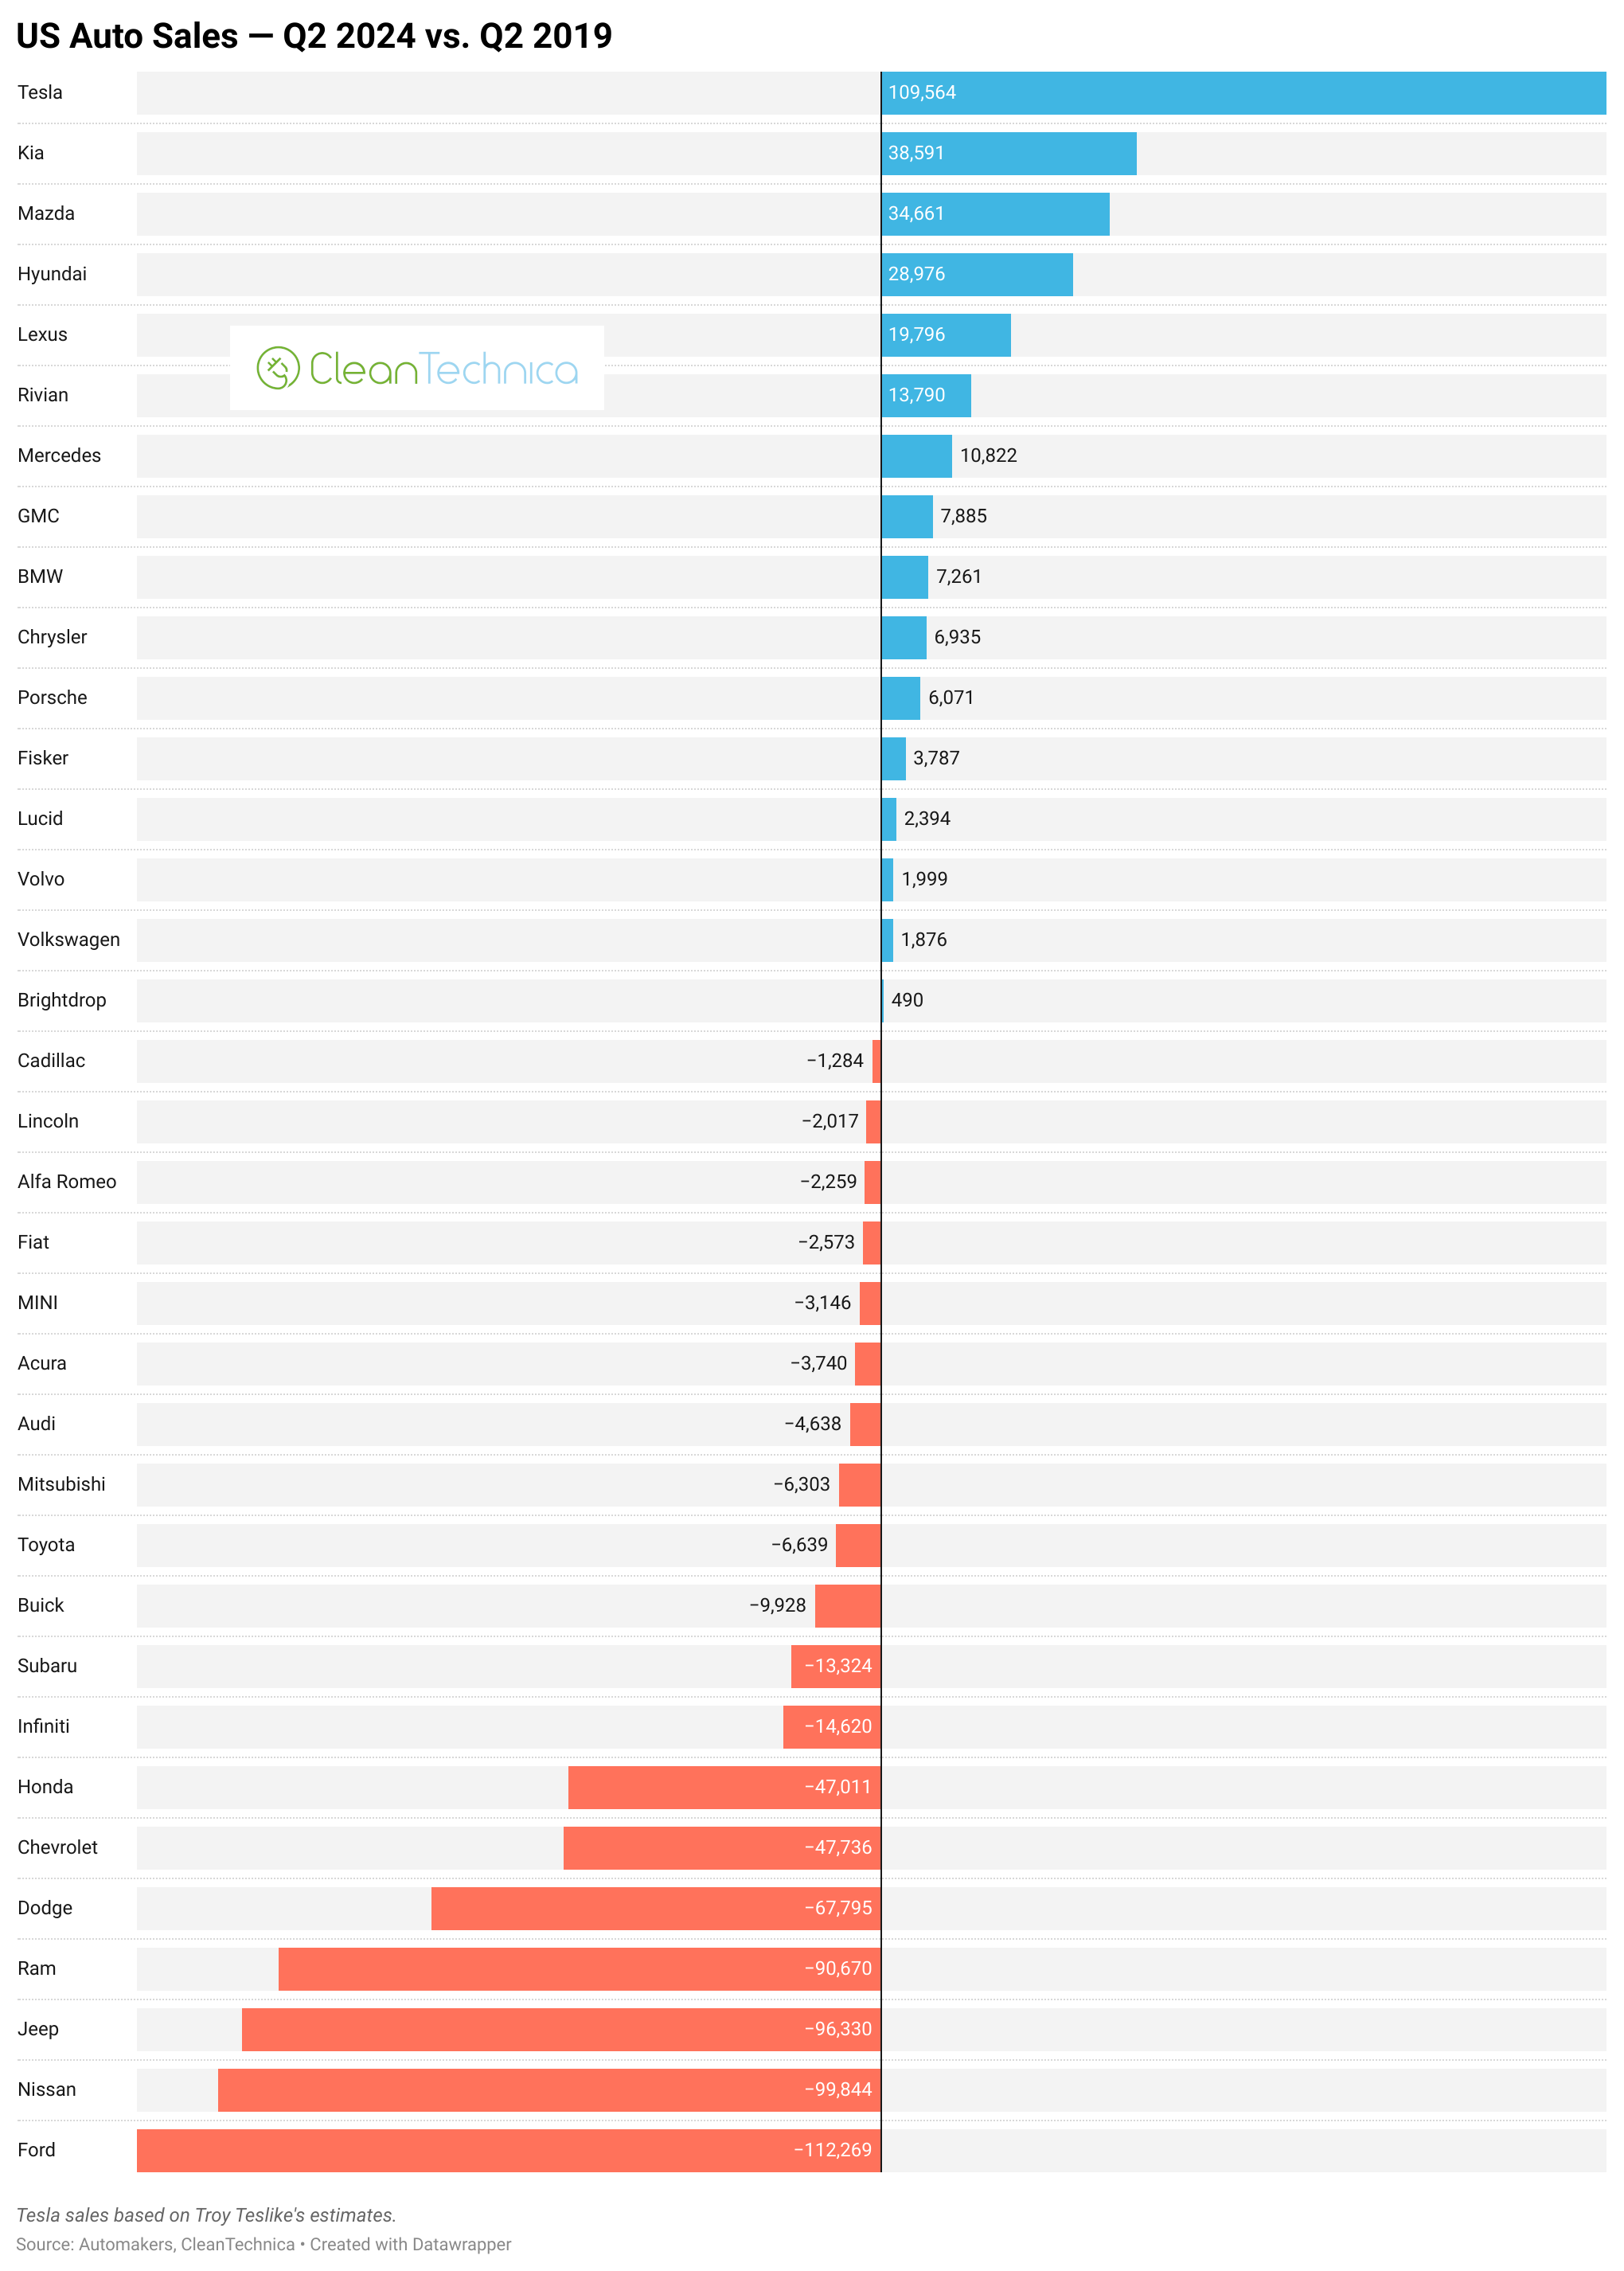
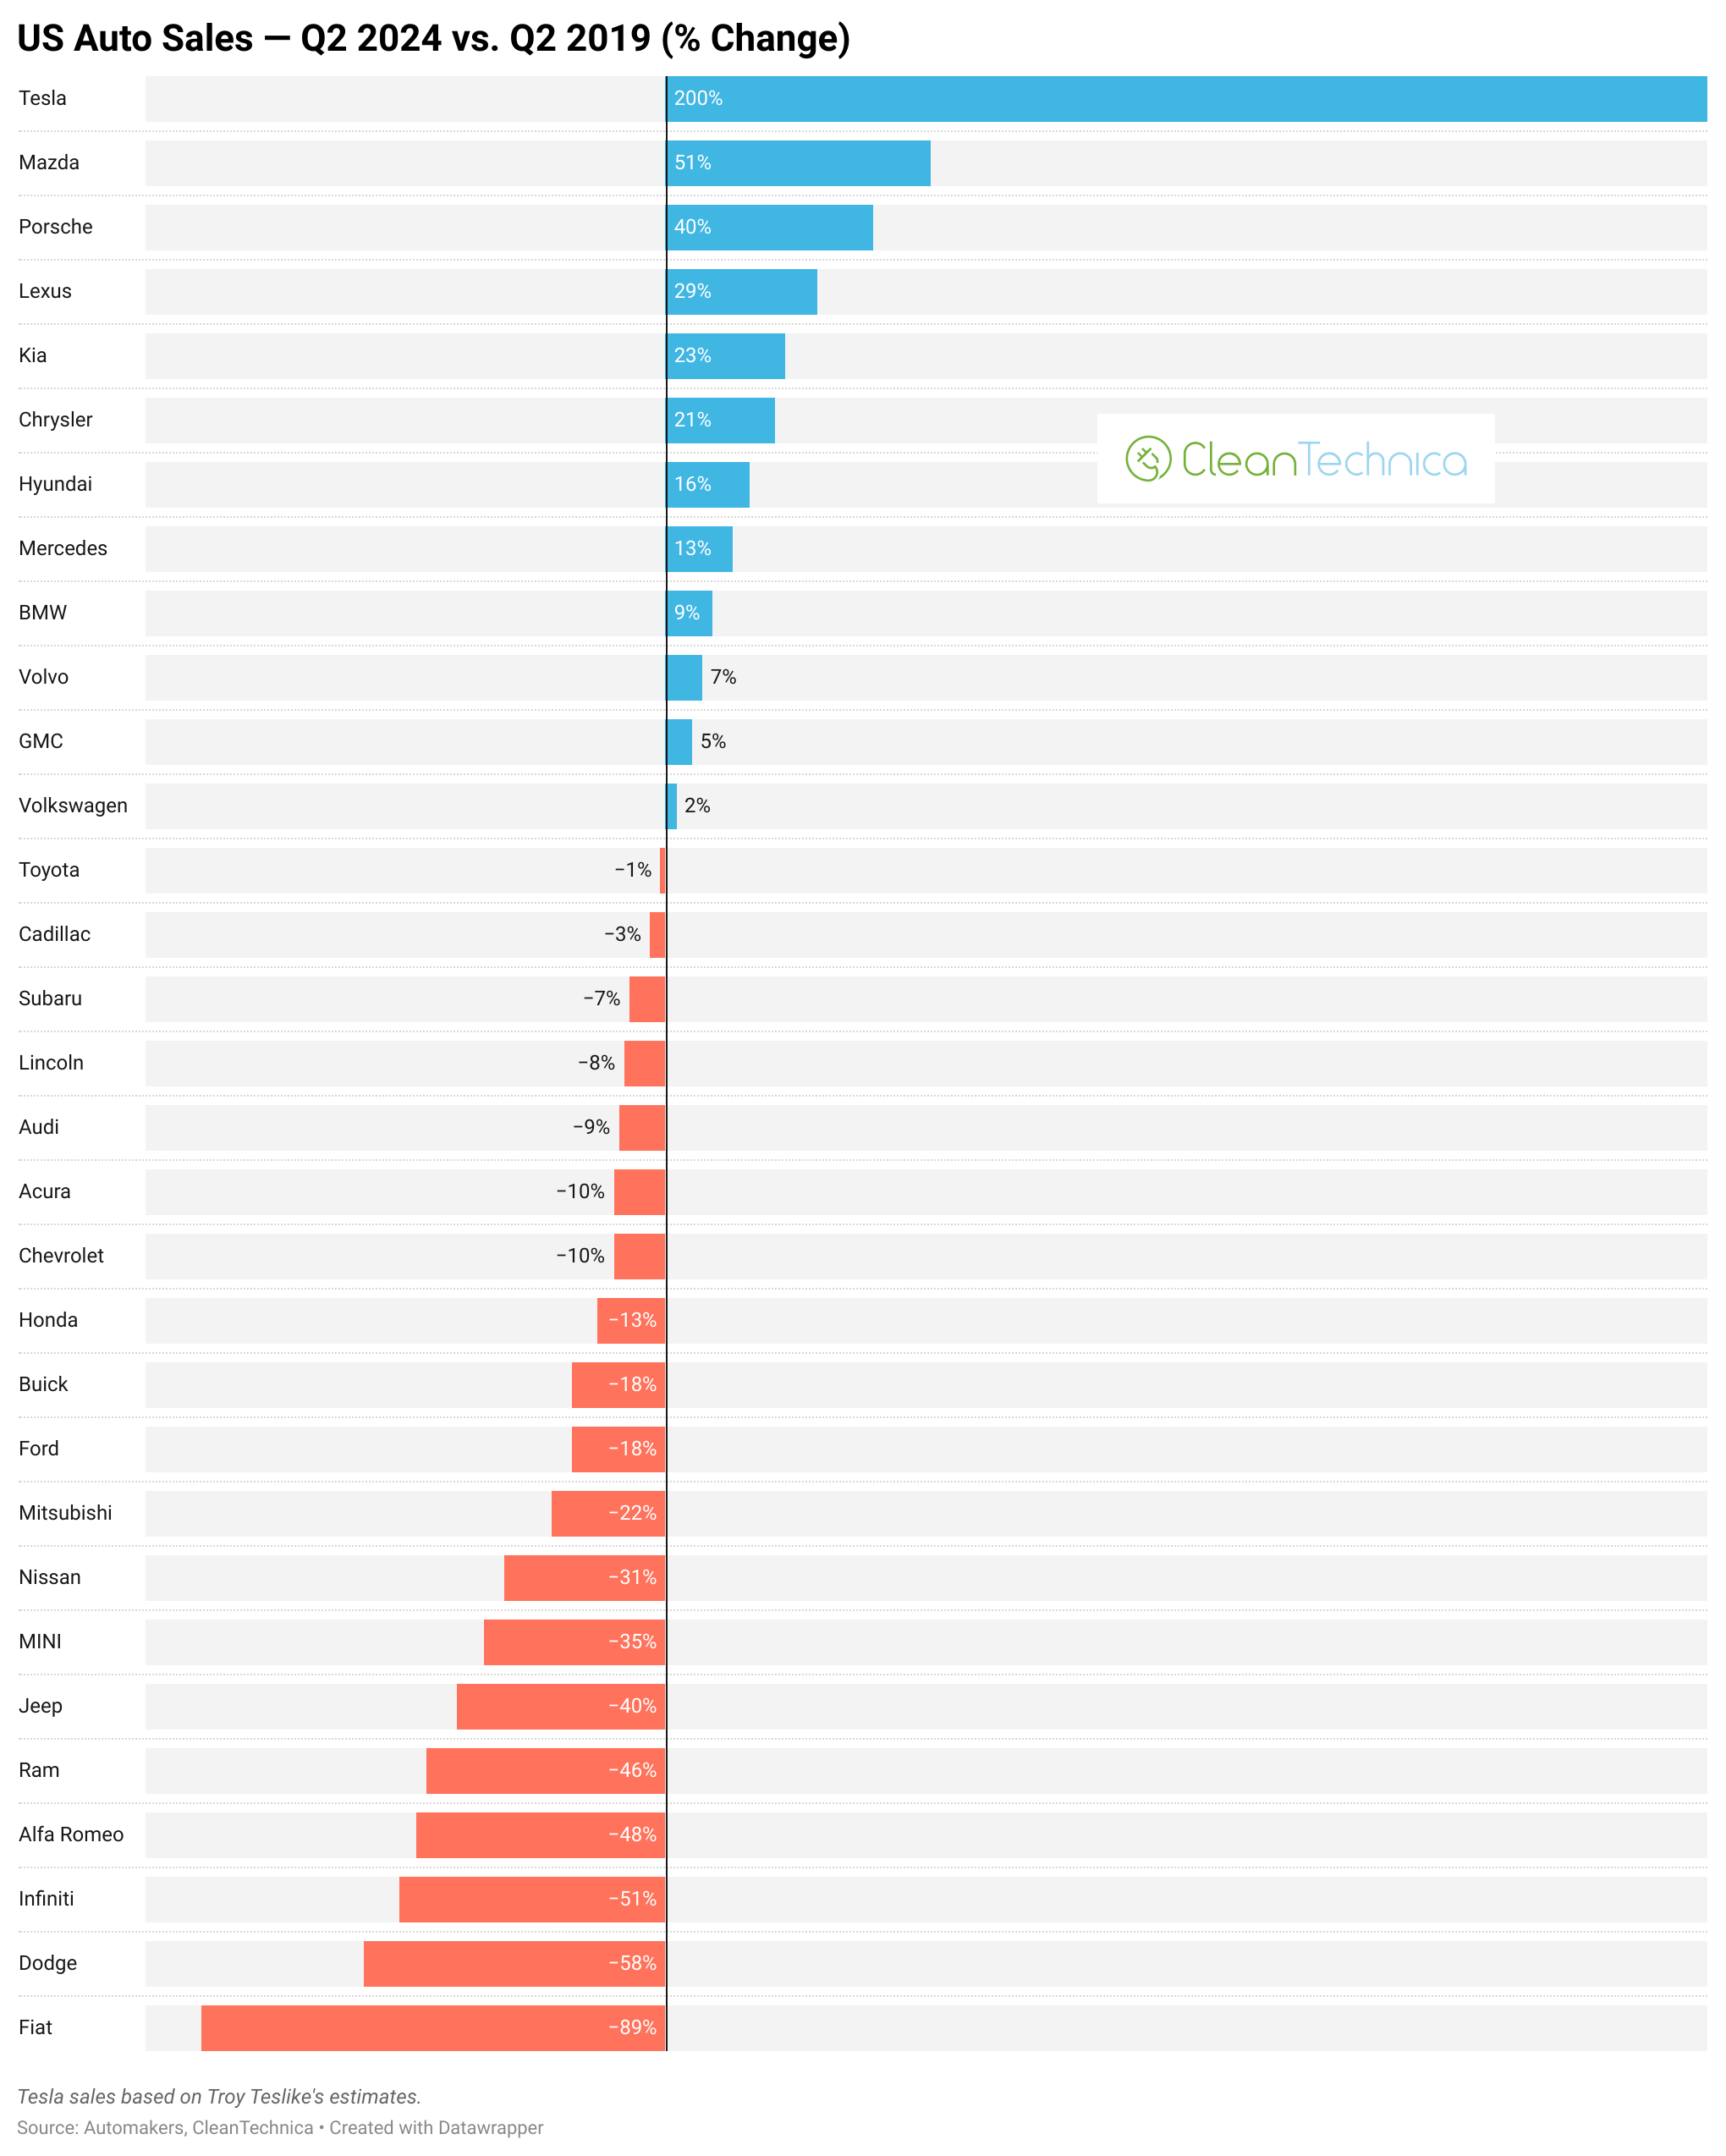
Going back even deeper, you can view how different brands grew or lost sales compared to Q2 2021, Q2 2020, and Q2 2019 in the 6 charts that follow. The big overall story is really how much Tesla sales grew over those few years.
If you want to really dive into the details, this last chart is the biggest and most thorough to explore. There’s a static version of the chart and an interactive version where you can hover over individual bars. What I love about this chart is that you can explore trends at individual brands over the course of several years, while also having the perspective of how many sales that brand gets compared to others. You can get a better view of how different brands surfed the ups and downs of the COVID-19 pandemic and can also see how much the brand grew or shrunk from pre-pandemic 2019 to 2022 (just looking at Q2 numbers). Almost every brand is down from Q2 2019 to Q2 2024. The notable brands that saw their sales rise were Hyundai, Kia, and Tesla.
I hope you enjoyed the stats and charts. Anything special stand out to you from any of these trends?

Have a tip for CleanTechnica? Want to advertise? Want to suggest a guest for our CleanTech Talk podcast? Contact us here.
Latest CleanTechnica.TV Videos
CleanTechnica uses affiliate links. See our policy here.
CleanTechnica’s Comment Policy


