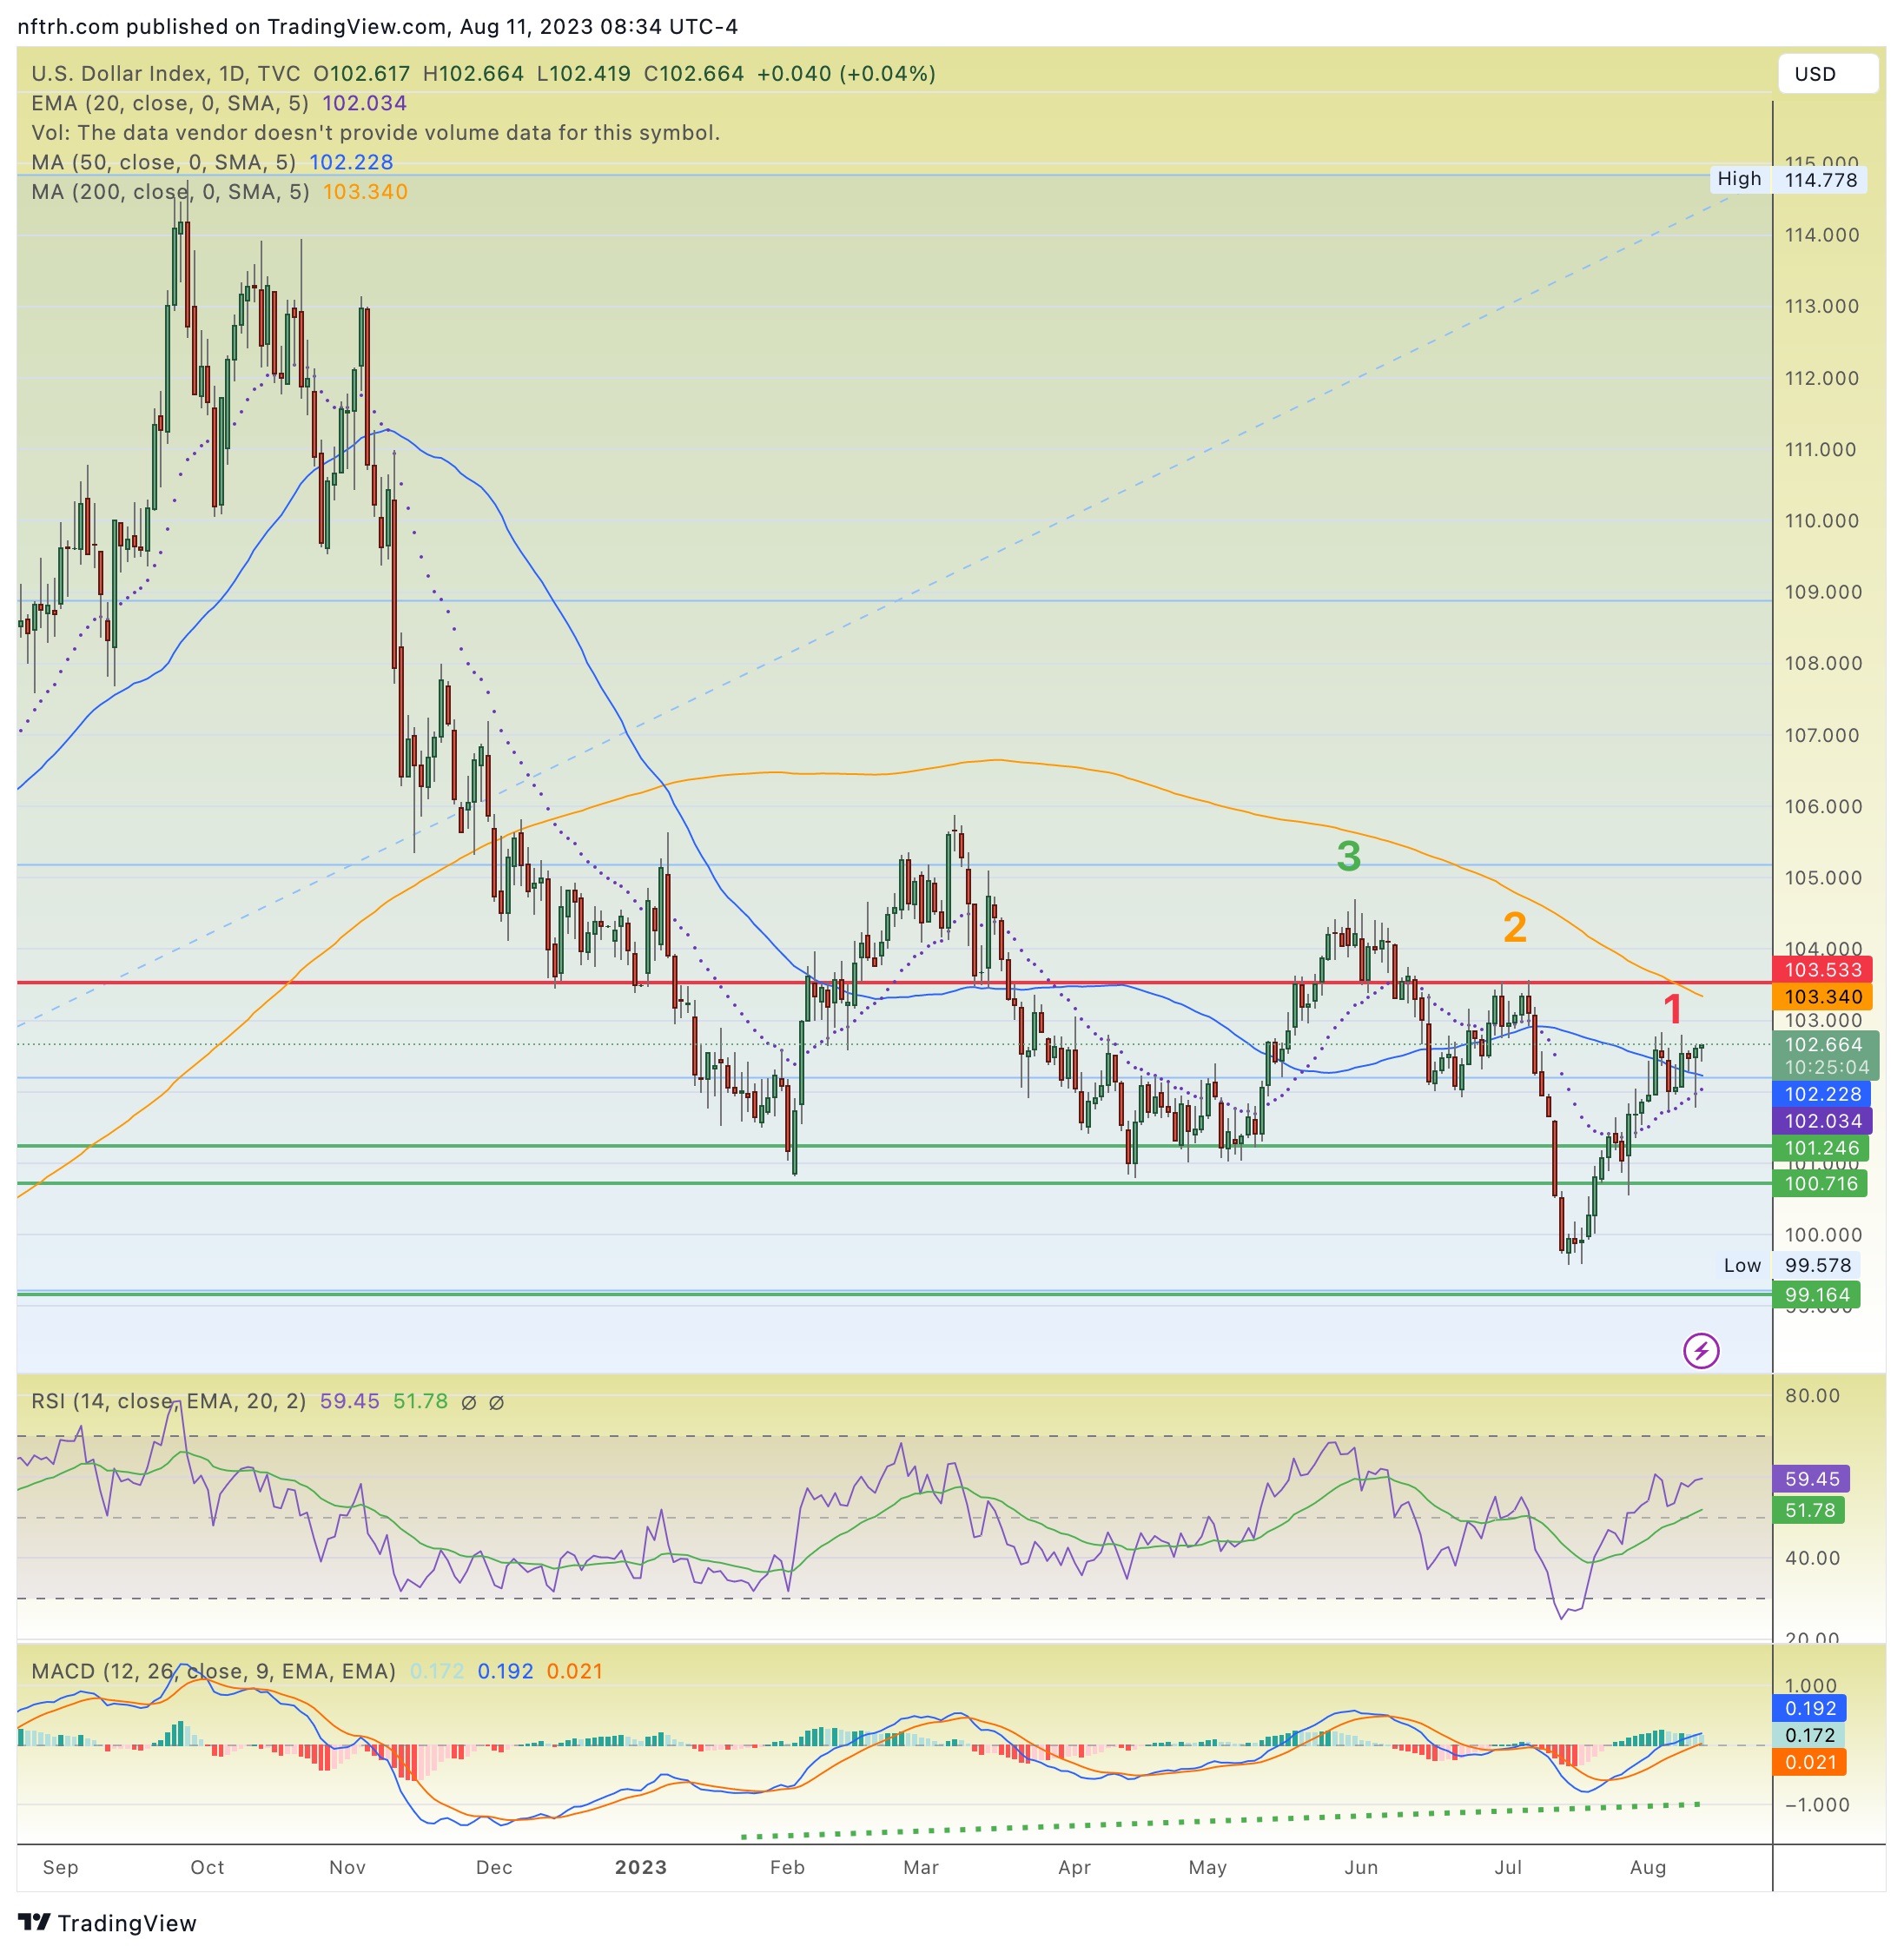
The US dollar index has exceeded objective #1, will now test #2
It’s pretty simple, the US dollar has been bearish on the daily chart time frame since dropping below the 200 day average (orange line), holding below it and then turning its slope down. Bearish. Period.
But as shown in Friday’s post, the longer-term charts are completely intact to a long-term bull market. If the daily were to remain bearish, it could one day inform the longer-term charts. But the changes would obviously have to start here on the daily time frame.
However, since USD is in a bull market some benefit of doubt can be given to the bull case even on the daily chart. Said benefit of doubt would be that the breakdown and plunge in July was a bear trap to ensnare, for example, “dedollarization” advocates. That noise got pretty loud earlier in the summer.
Anyway, USD has taken out objective #1, which was the (blue) SMA 50 and now tests #2, which is the union of the downtrending SMA 200 and clear lateral resistance. It’s a pretty important test, wouldn’t you say? I would say. If it holds here and turns down it would do the logical thing per the daily chart. But if it breaks through and eventually takes out #3, it would do the illogical, spring the bear trap and reassert the longer-term bullish charts.
For “best of breed” top down analysis of all major markets, subscribe to NFTRH Premium, which includes an in-depth weekly market report, detailed market updates and NFTRH+ dynamic updates and chart/trade setup ideas. Subscribe by Credit Card or PayPal using a link on the right sidebar (if using a mobile device you may need to scroll down) or see all options and more info. Keep up to date with actionable public content at NFTRH.com by using the email form on the right sidebar. Follow via Twitter@NFTRHgt.
*********


