Sign up for daily news updates from CleanTechnica on email. Or follow us on Google News!
We are pleased to announce the release of the latest edition of Berkeley Lab’s Tracking the Sun annual report, describing trends for distributed solar photovoltaic (PV) systems in the United States, including the growing contingent of distributed solar-plus-storage systems. The report is based on data from roughly 3.7 million systems installed nationally through year-end 2023, capturing close to 80% of all systems installed up to that point and more than 70% of additions in 2023. This year’s report updates key trends related to project characteristics, system design, and pricing, and presents new material relying on building and property data integrated into the Tracking the Sun dataset.
The report, published in slide-deck format, is accompanied by a narrative executive summary, interactive data visualizations, and a public data file, all available through the link above. The authors will host a webinar summarizing key findings from the report on September 4th at 10 am Pacific. Please register for the webinar here: https://lbnl.zoom.us/webinar/
The following are a few key findings from the latest edition of the report.
Residential systems continue getting larger, driven by increasing module efficiency. Residential system sizes have risen steadily over the past two decades, reaching a median of 7.4 kW in 2023. System sizes have grown nearly in lock-step with PV module efficiencies, as shown in the left-hand panel of Figure 1. Higher module efficiencies allow for more PV capacity, as residential systems are often space-constrained due to shading, obstructions, and mixed roof orientations. As shown in the right-hand panel of Figure 1, roof-coverage ratios (the percentage of roof-space used by the PV modules) typically range from 20-40% in residential applications and have risen only slightly since 2010.

Non-residential PV adopters span a diverse set of sectors, as small agricultural systems expand their share. As shown in Figure 2, half of all non-residential installations in 2023 were installed on commercial properties (including retail, industrial, office, warehouse facilities), roughly one-third on agricultural properties, and 15% by tax-exempt (e.g., government, schools, religious, and other non-profit) customers. The share of systems installed on agricultural properties has been growing over time; most of these are relatively small systems (<20 kW), typical of a small family farm. Among non-residential systems, third-party ownership (TPO) rates are highest for tax-exempt site hosts, especially government and school facilities (TPO rates of 55% and 47% in 2023), which also tend to be relatively large compared to other non-residential systems.

Battery storage attachment rates continue inching upwards. In 2023, 12% of all new residential PV installations and 8% of all non-residential installations included battery storage. As usual, Hawaii was in a category of its own, with residential and non-residential storage attachment rates of 95% and 88%, respectively. Residential attachment rates in California rose to 14% for the year. Most of those systems were installed under the state’s legacy net metering structure, but attachment rates for systems installed under the new net billing tariffs, which strongly incentivize pairing PV with storage, reached roughly 60% by year-end. (Berkeley Lab previously published a more in-depth analysis of changes in the California solar market under the new net billing structure.) Residential attachment rates in most other states ranged from 4–10% in 2023. Non-residential attachment rates also vary widely across states, but are typically quite low (<2%) in states without targeted incentives.
PV system prices fell year-over-year for residential systems, but rose for non-residential systems. From 2022 to 2023, median installed prices for residential systems fell by roughly $0.1/W in real (inflation-adjusted) terms, the same rate of decline as over the past decade. In contrast, median prices for non-residential systems rose for the first time in 15 years, by $0.1-0.2/W. These small year-over-year changes are sensitive to fluctuations in inflation, and the lagged effect on installed prices, which can vary across projects depending on the length of their development timeline. Across all three customer segments, but especially for residential systems, installed prices consist predominantly of business process and other “soft costs”.

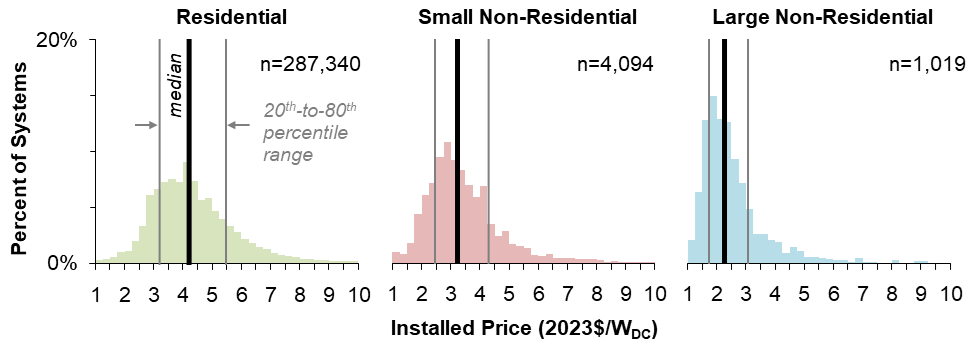
PV system prices vary widely across individual projects. Among stand-alone PV systems, installed prices vary by roughly $2/W between the 20th and 80th percentile values for both residential and small non-residential customers, and by roughly $1.4/W for large non-residential customers (see Figure 4). That pricing variability reflects differences in project characteristics as well as features of the local market, policy, and regulatory environment. The report includes a multi-variate regression analysis that estimates the effects of key pricing drivers on residential installed prices in 2023. The regression analysis shows the most significant impacts associated with the inclusion of battery storage (a $1.4/W increase), variations in system size (a $0.7/W decrease from the 20th to the 80th percentile system size), and installations on residential new construction ($0.7/W lower than systems installed on existing homes).

We thank the U.S. Department of Energy Solar Energy Technologies Office for their support of this work, as well as the numerous individuals and organizations who generously provided data for this ongoing effort.

Courtesy of Galen Barbose, Naïm Darghouth, Eric O’Shaughnessy, and Sydney Forrester, Berkeley Lab.
Have a tip for CleanTechnica? Want to advertise? Want to suggest a guest for our CleanTech Talk podcast? Contact us here.
Latest CleanTechnica.TV Videos
CleanTechnica uses affiliate links. See our policy here.
CleanTechnica’s Comment Policy


