Sign up for daily news updates from CleanTechnica on email. Or follow us on Google News!
The Copernicus Climate Change Service (C3S), implemented by the European Centre for Medium-Range Weather Forecasts on behalf of the European Commission with funding from the EU, routinely publishes monthly climate bulletins reporting on the changes observed in global surface air temperature, sea ice cover and hydrological variables. All the reported findings are based on computer-generated analyses using billions of measurements from satellites, ships, aircraft and weather stations around the world.
September 2023 — Surface air temperature and sea surface temperature highlights:
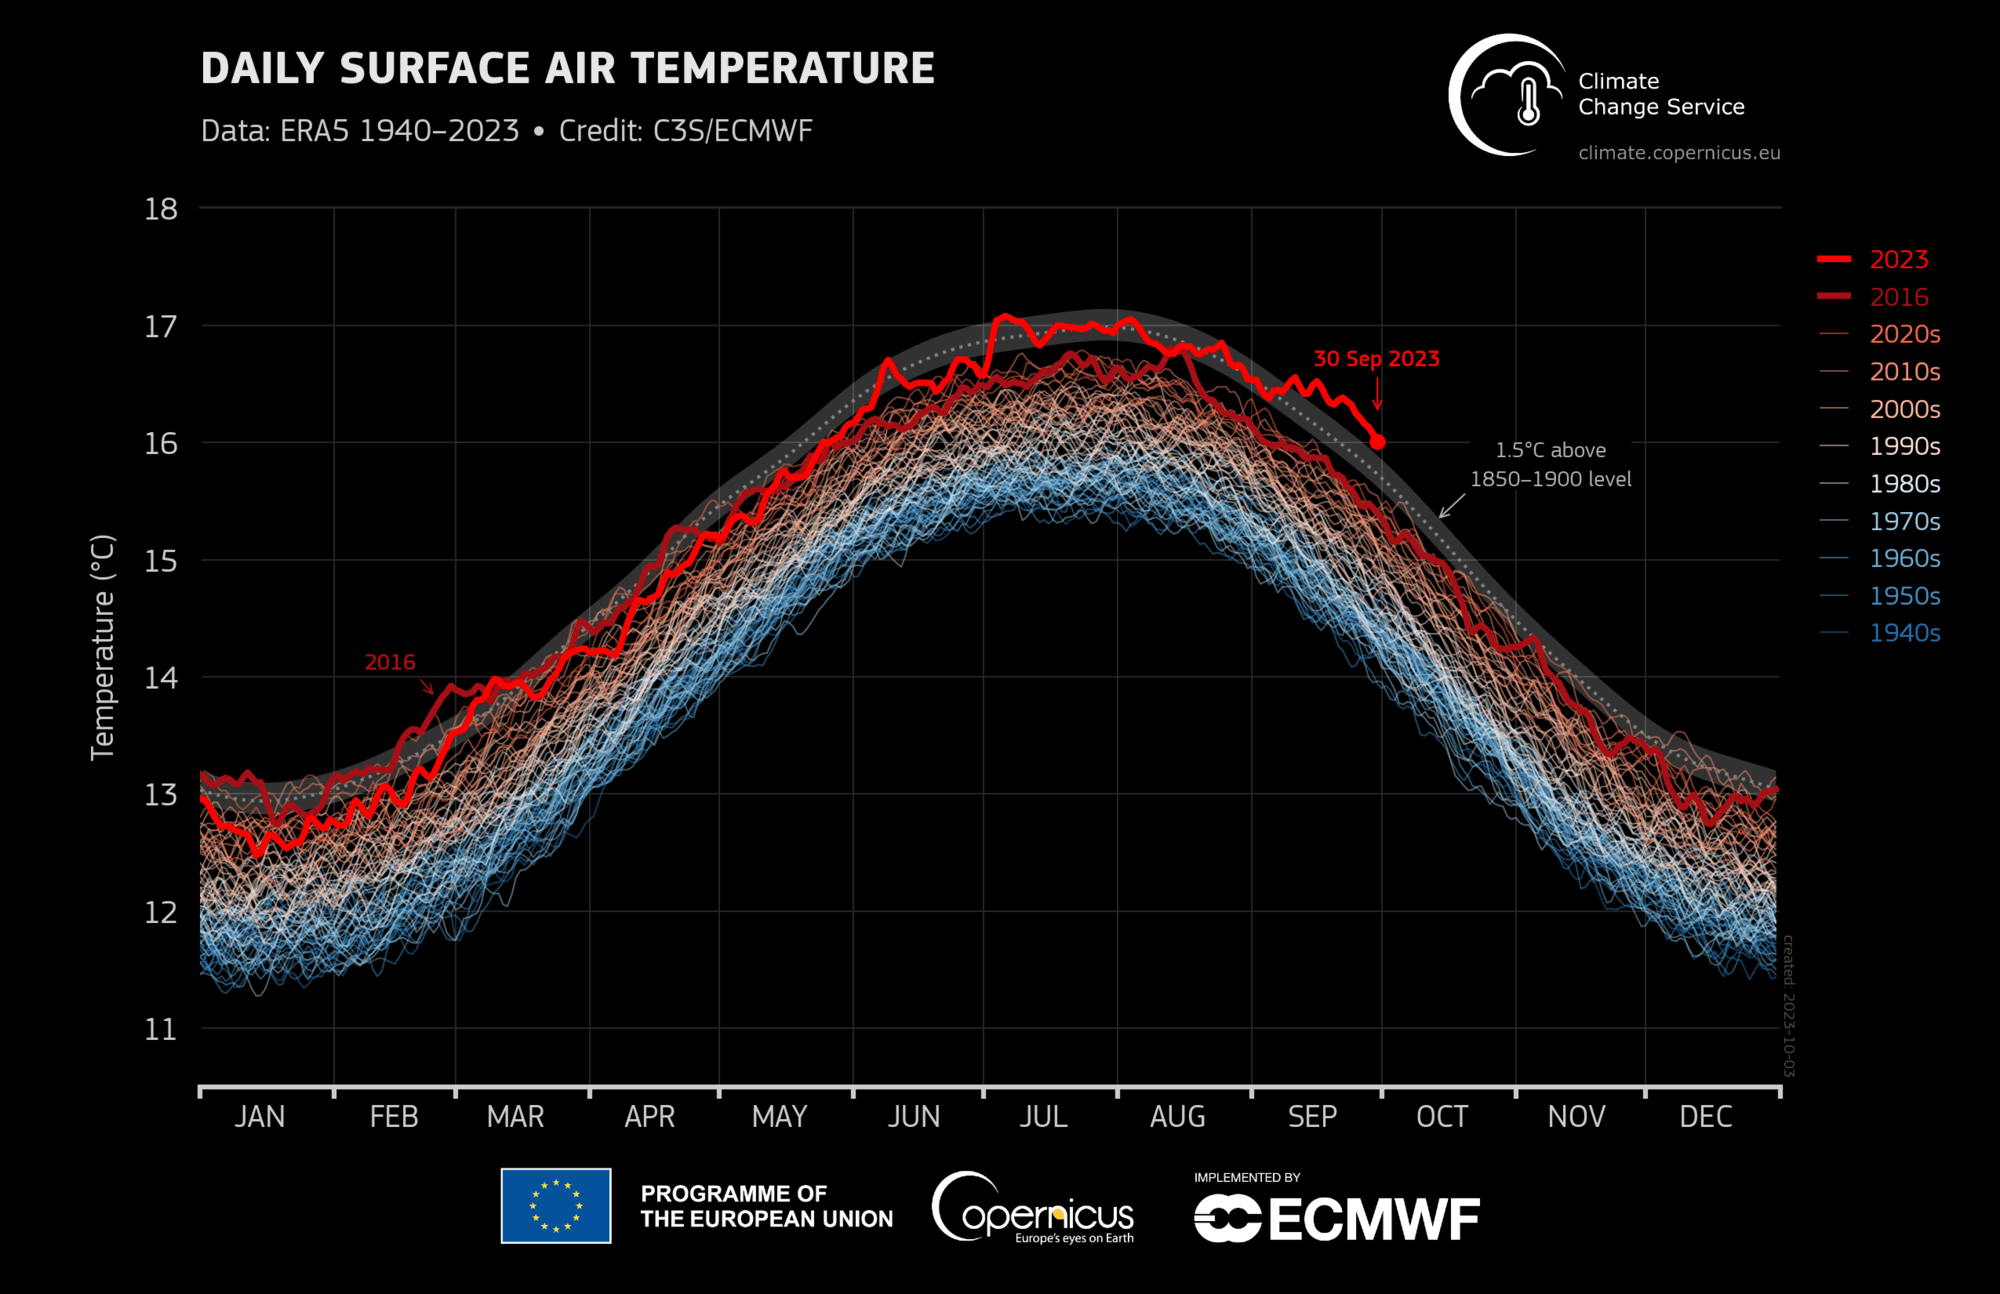
- September 2023 was the warmest September on record globally, with an average surface air temperature of 16.38°C, 0.93°C above the 1991–2020 average for September and 0.5°C above the temperature of the previous warmest September, in 2020.
- September 2023 global temperature was the most anomalous warm month of any year in the ERA5 dataset (back to 1940).
- The month as a whole was around 1.75°C warmer than the September average for 1850–1900, the preindustrial reference period.
- The global temperature for January–September 2023 was 0.52°C higher than average, and 0.05°C higher than the equivalent period in the warmest calendar year (2016).
- For January to September 2023, the global mean temperature for 2023 to date is 1.40°C higher than the preindustrial average (1850–1900).
- For Europe, September 2023 was the warmest September on record, at 2.51°C higher than the 1991–2020 average, and 1.1°C higher than 2020, the previous warmest September.
- The average sea surface temperature for September over 60°S–60°N reached 20.92°C, the highest on record for September and the second highest across all months, behind August 2023.
- El Niño conditions continued to develop over the equatorial eastern Pacific.

Global daily surface air temperature (°C) from 1 January 1940 to 30 September 2023, plotted as time series for each year. 2023 and 2016 are shown with thick lines shaded in bright red and dark red, respectively. Other years are shown with thin lines and shaded according to the decade, from blue (1940s) to brick red (2020s). The dotted line and grey envelope represent the 1.5°C threshold above preindustrial level (1850–1900) and its uncertainty. Data source: ERA5. Credit: Copernicus Climate Change Service/ECMWF.
According to Samantha Burgess, Deputy Director of the Copernicus Climate Change Service (C3S): “The unprecedented temperatures for the time of year observed in September — following a record summer — have broken records by an extraordinary amount. This extreme month has pushed 2023 into the dubious honour of first place – on track to be the warmest year and around 1.4°C above preindustrial average temperatures. Two months out from COP28 — the sense of urgency for ambitious climate action has never been more critical.”
September 2023 — Sea Ice Highlights
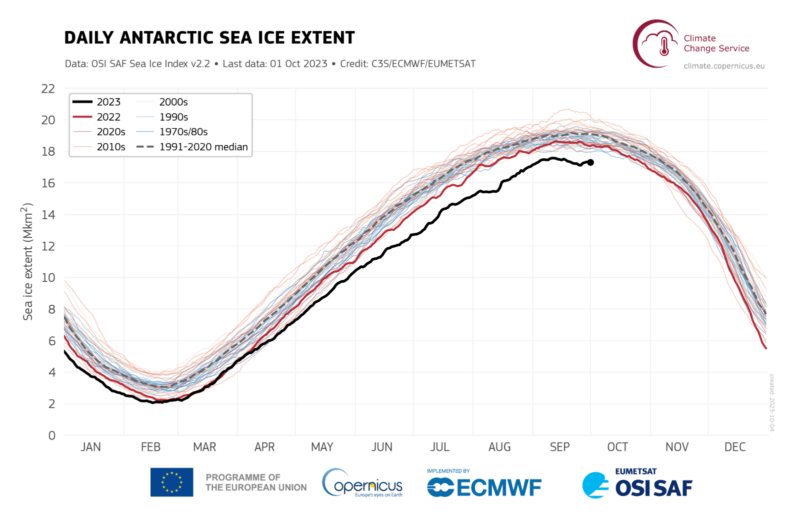
- Antarctic sea ice extent remained at a record low level for the time of year.
- Both the daily and monthly extents reached their lowest annual maxima in the satellite record in September, with the monthly extent 9% below average.
- The daily Arctic Sea ice extent reached its 6th lowest annual minimum while the monthly sea ice extent ranked 5th lowest, at 18% below average.

Daily Antarctic sea ice extent from 1979 to September 2023. Shades of blue are used for years up to 1999, and shades of red
from 2000 onward. The year 2023 is shown with a thick black line, the year 2022 with a thick red line, and the median for 1991–2020 with a dashed grey line. Data source: EUMETSAT OSI SAF Sea Ice Index v2.2. Credit: Copernicus Climate Change Service/ECMWF/EUMETSAT.
September 2023 — Hydrological variables highlights:
- September 2023 saw wetter-than-average conditions along many parts of the western seaboard of Europe, including the western Iberian Peninsula, Ireland, northern Britain, and Scandinavia.
- It was also wetter than average in Greece following extreme rainfall associated with storm Daniel; this event was also responsible for the devastating flooding in Libya.
- Southern Brazil and southern Chile also experienced extreme precipitation events.
- Drier-than-average regions included parts of Europe, the southeastern USA, Mexico, central Asia, and Australia, where the driest September on record was recorded.
Answers to frequently asked questions regarding temperature monitoring can be found here.
The findings about global sea surface temperatures (SSTs) presented here are based on SST data from ERA5 averaged over the 60°S–60°N domain.
Note that ERA5 SSTs are estimates of the ocean temperature at about 10m depth (known as foundation temperature). The results may differ from other SST products providing temperature estimates at different depths, such as 20cm depth for NOAA’s OISST.
Information about the C3S data set and how it is compiled:
Temperature and hydrological maps and data are from ECMWF Copernicus Climate Change Service’s ERA5 dataset.
Sea ice maps and data are from a combination of information from ERA5, as well as from the EUMETSAT OSI SAF Sea Ice Index v2.1, Sea Ice Concentration CDR/ICDR v2 and fast-track data provided upon request by OSI SAF.
Regional area averages quoted here are the following longitude/latitude bounds:
- Globe, 180W–180E, 90S–90N, over land and ocean surfaces.
- Europe, 25W–40E, 34N–72N, over land surfaces only.
More information about the data can be found here.
Article courtesy of the Copernicus Climate Change Service.
Have a tip for CleanTechnica? Want to advertise? Want to suggest a guest for our CleanTech Talk podcast? Contact us here.
EV Obsession Daily!
I don’t like paywalls. You don’t like paywalls. Who likes paywalls? Here at CleanTechnica, we implemented a limited paywall for a while, but it always felt wrong — and it was always tough to decide what we should put behind there. In theory, your most exclusive and best content goes behind a paywall. But then fewer people read it!! So, we’ve decided to completely nix paywalls here at CleanTechnica. But…
Thank you!
Tesla Sales in 2023, 2024, and 2030
CleanTechnica uses affiliate links. See our policy here.


