Sign up for daily news updates from CleanTechnica on email. Or follow us on Google News!
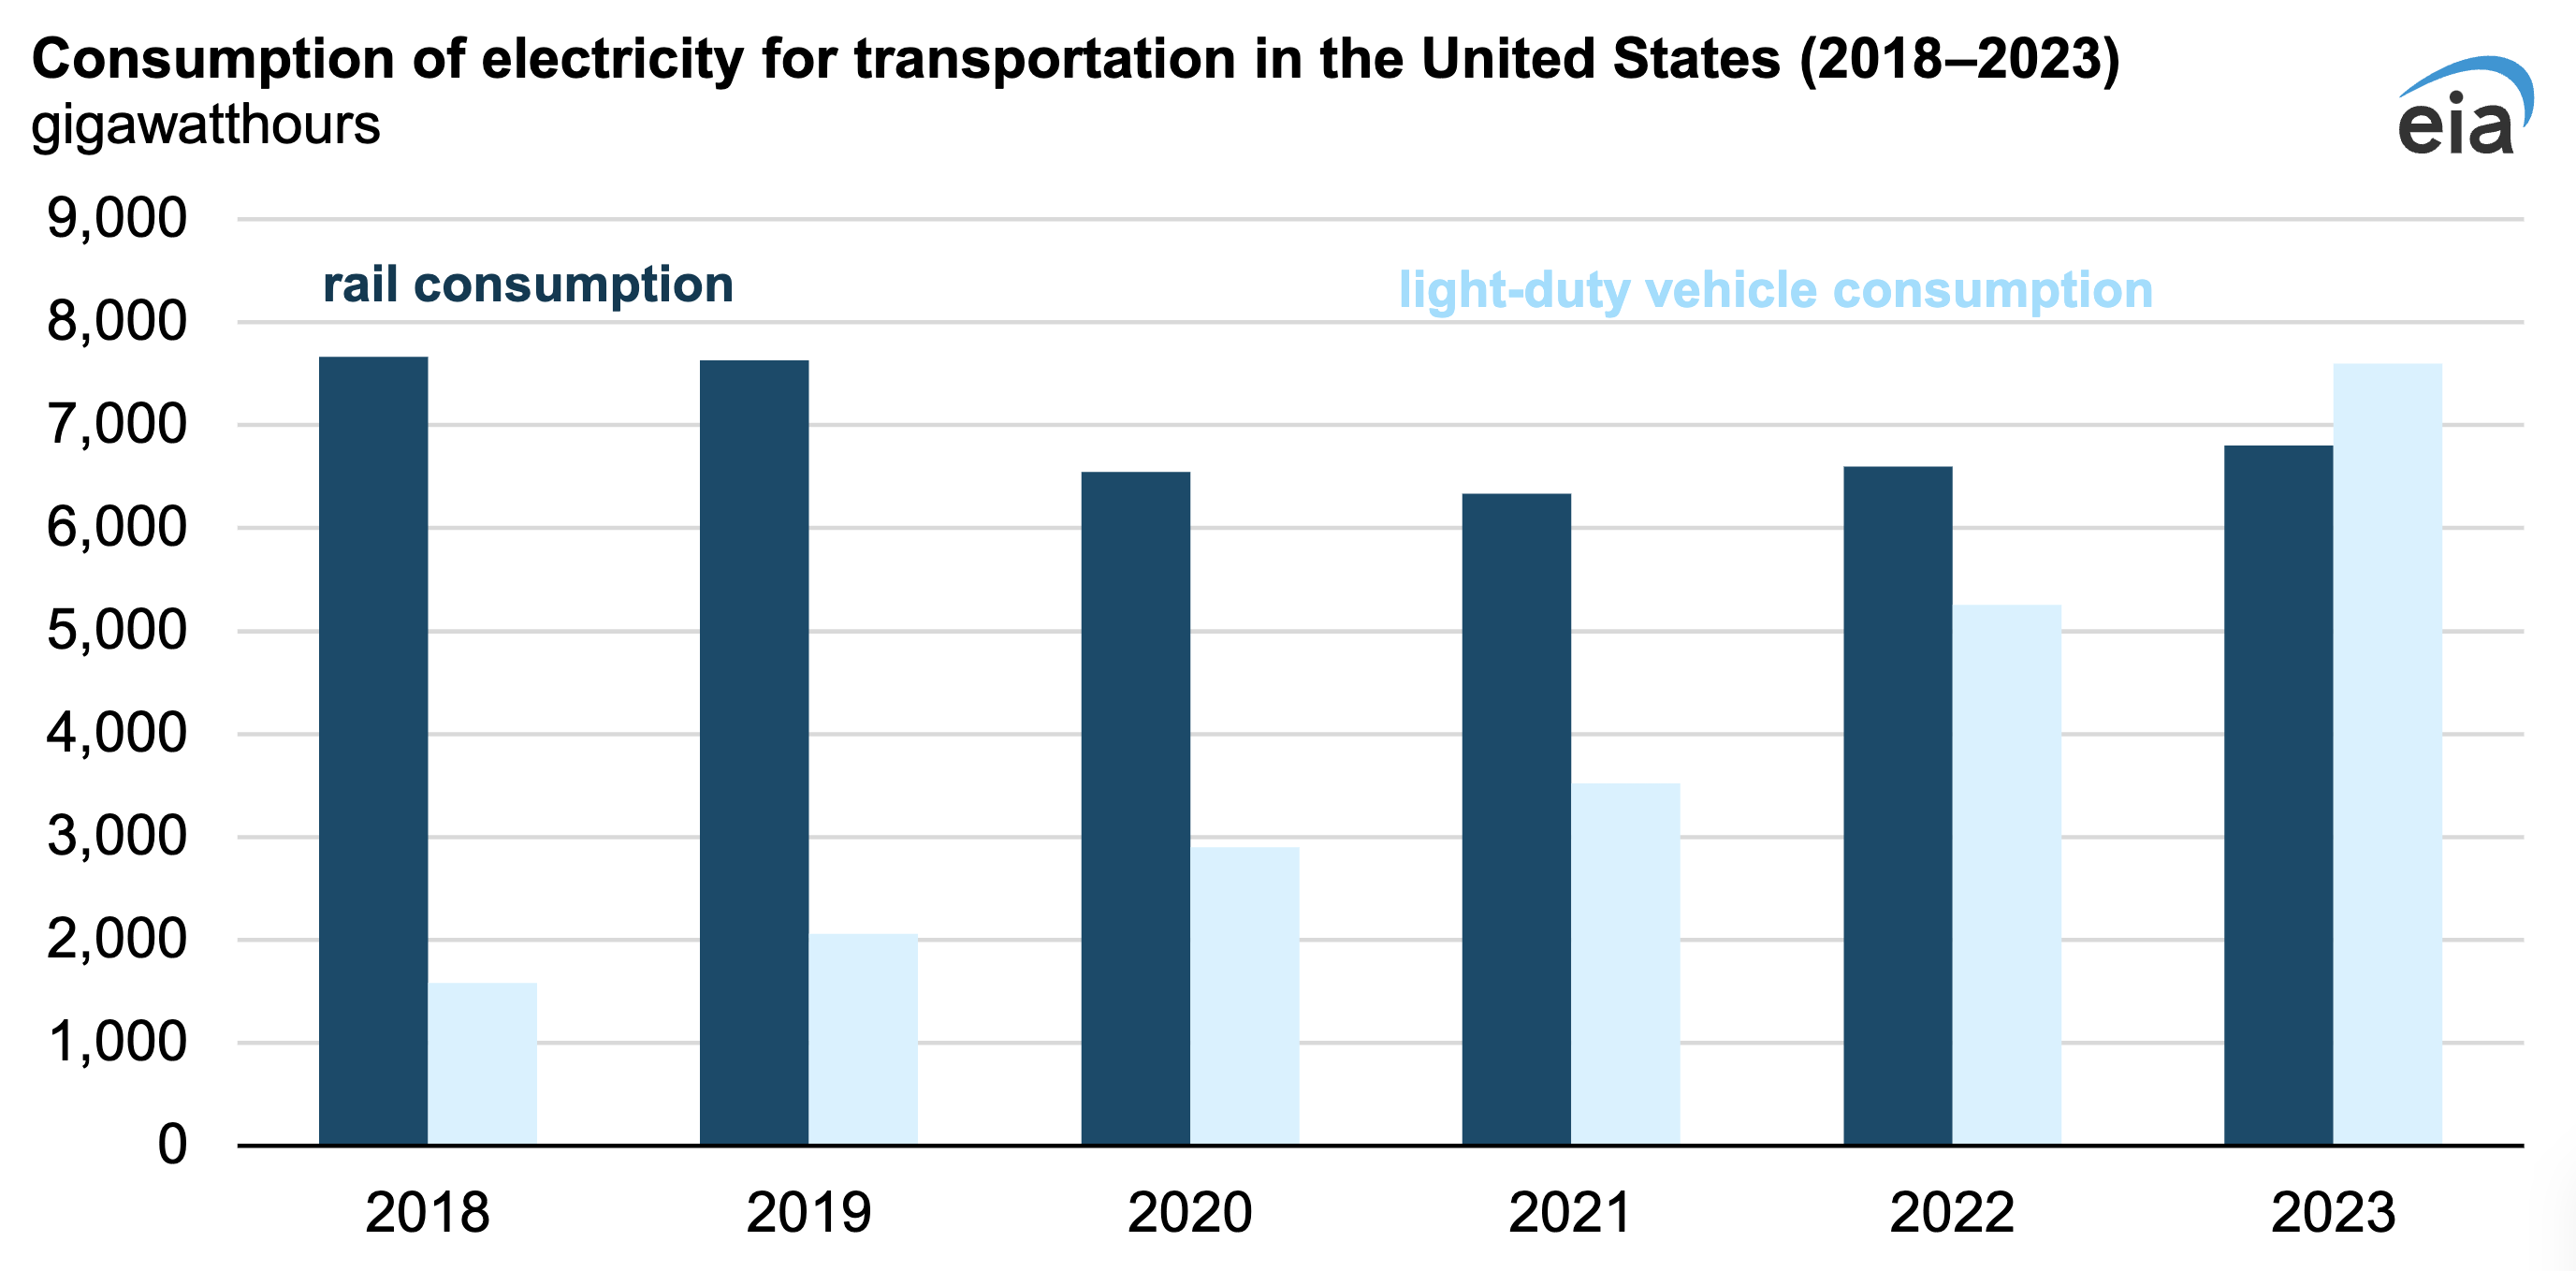
Light-duty vehicles (LDV) in the United States used more electricity than rail systems for the first time in 2023, according to new estimates in our Electric Power Monthly. We recently started publishing experimental estimates for LDV electricity consumption, which are not collected on our traditional surveys but are derived using a model. We compared these estimates with consumption data from electric utilities that report transportation sector end use, which is almost only municipal and regional rail systems.

U.S. sales of electric vehicles (EVs) have increased in recent years, making up 16% of all LDV sales in 2023. Annual electricity consumption by railways has been the largest electricity end-use category in the transportation sector published in the Electric Power Monthly since 2003, stable for the past two decades and averaging about 7,000 gigawatthours (GWh). The United States has had only limited expansion of municipal railway systems or electrified passenger rail during that period.
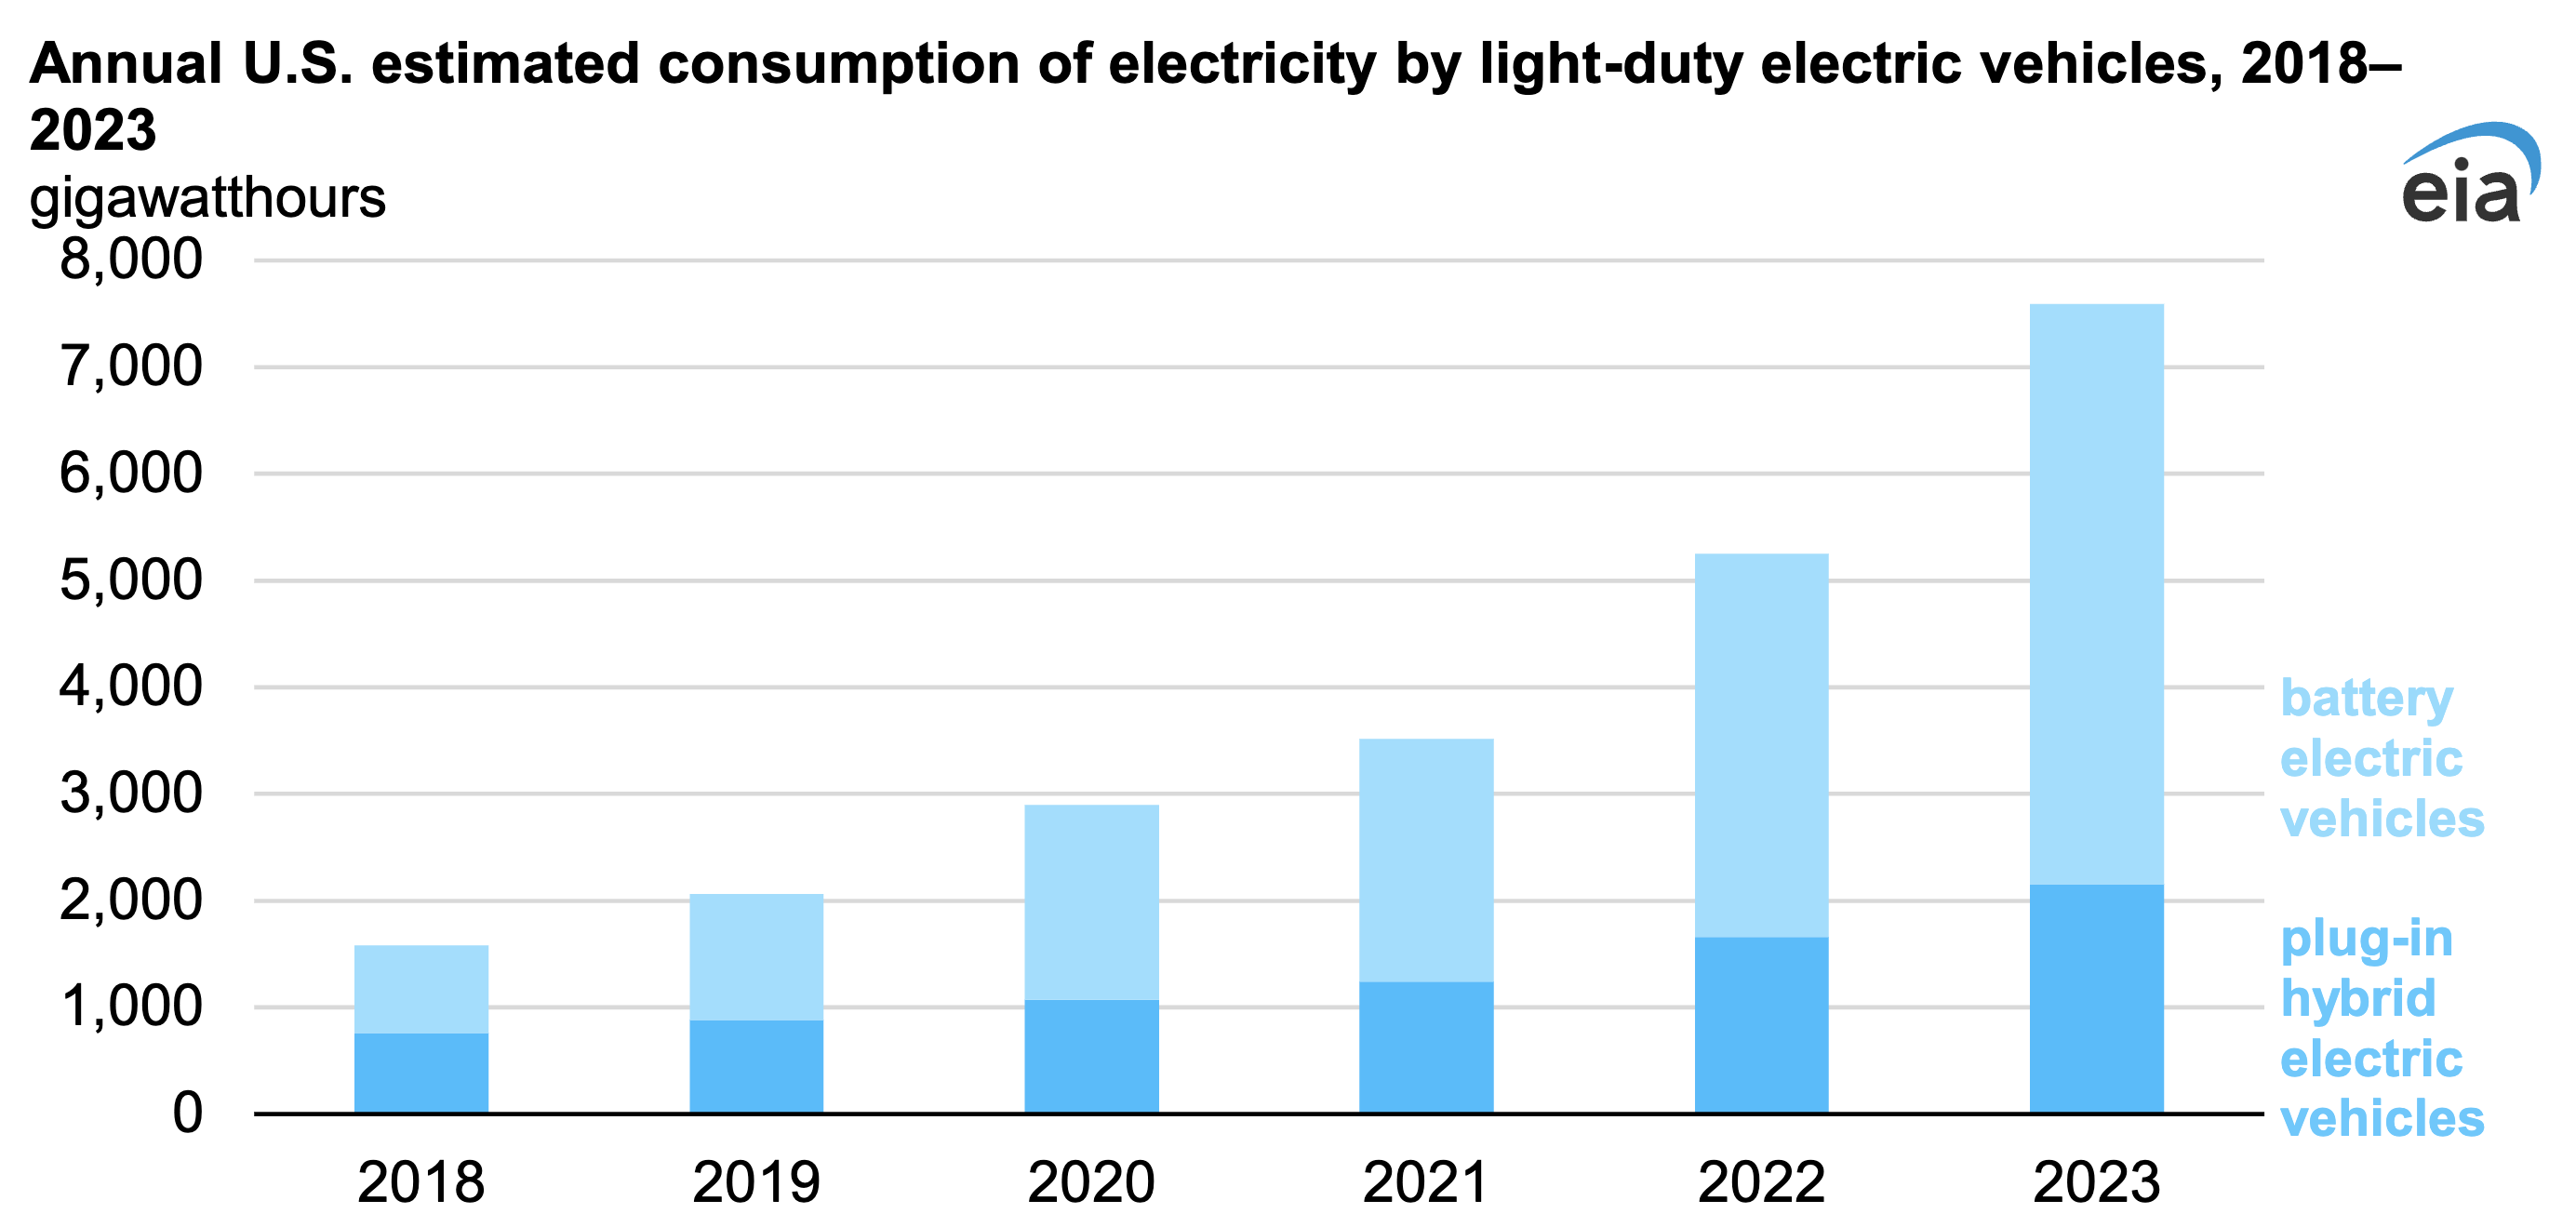
Estimated annual electricity consumption by EVs grew to 7,596 GWh in 2023, almost five times the consumption in 2018. The shares of electricity consumed by battery electric vehicles (BEVs) and by plug-in hybrid electric vehicles were about the same in 2018. More recently, the number of BEV model options have increased as their prices have declined. In 2023, BEVs accounted for 72% of overall electricity consumption by electric vehicles.
Our new estimates of LDV electricity consumption are based on models and are, therefore, subject to model error, which we are trying to understand better. We are releasing these new estimates to solicit comments by email on the potential uses of the data, the methodology, and possible enhancements. You can find more information on the model and experimental data series in Appendix D of the Electric Power Monthly.
We currently publish estimated electricity consumption by LDVs at the national, regional, and state levels beginning in 2018.

In 2023, the most electricity consumed by EVs in any region of the United States was in the contiguous part of the Pacific Census Division, which accounted for 40% of the U.S. total. The South Atlantic Census Division had the second-most consumption at 15.5% and Middle Atlantic Census Division had the third, 8.8%.
California accounts for about 85% of electricity consumption by LDVs in the contiguous part of the Pacific Census Division. California has the highest concentration of EVs of any state in the United States, which means more electricity consumed by EVs is in California than in any other state. In 2023, 33.9% of U.S. EV electricity consumption was in California, followed by Florida at 6.0%.
Principal contributors: Suparna Ray, M. Tyson Brown
Have a tip for CleanTechnica? Want to advertise? Want to suggest a guest for our CleanTech Talk podcast? Contact us here.
Latest CleanTechnica.TV Video
CleanTechnica uses affiliate links. See our policy here.


