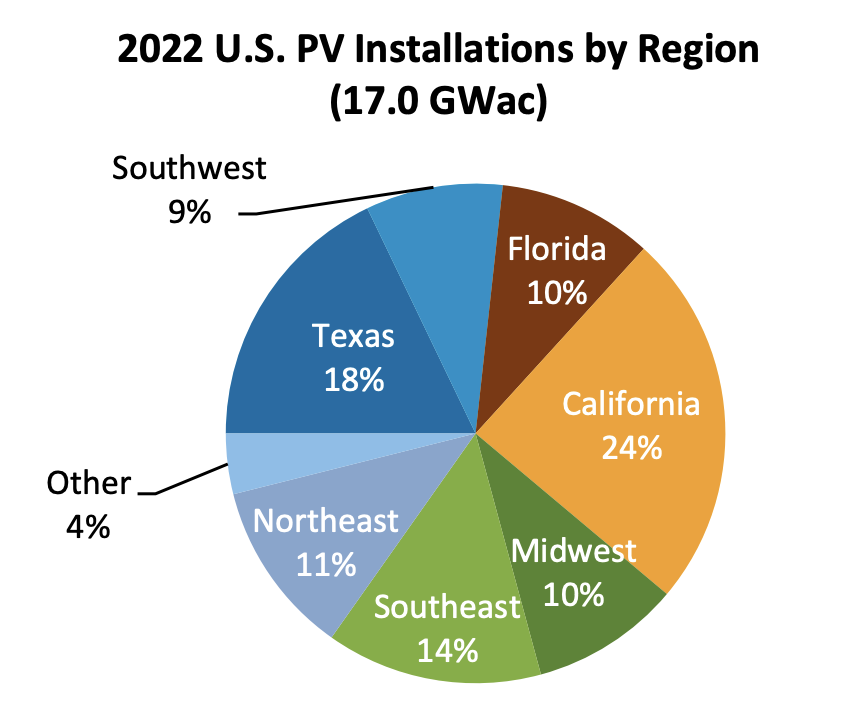
The Sunshine State, unfortunately, has not lived up to its name. It has settled in as a laggard in the adoption of solar power, despite its extensive and world famous solar resources. (And let’s not even get into its offshore wind potential.) With the facts presented a certain way, one might be deceived into thinking Florida is a solar power leader, alongside the Golden State and the Lone Star State. For example, here’s a chart of 2022 US solar PV installations broken down by the top 3 states and then regions of the country:

Courtesy of National Renewable Energy Laboratory (NREL).
As that chart shows, Florida was third in the nation in terms of solar PV installations in 2022. It represented 10% of all US solar PV installation capacity last year, only trailing solar giant (and overall economic giant) California (24%) and Texas (18%). Those three states accounted for 52% of new solar power capacity in 2022.
However, naturally, Florida is also the third most populous state in the USA, behind — you guessed it — #1 California and #2 Texas. So, is Florida really a solar power leader, or is it just a big state with a lot of people? Well, we have an answer to that.
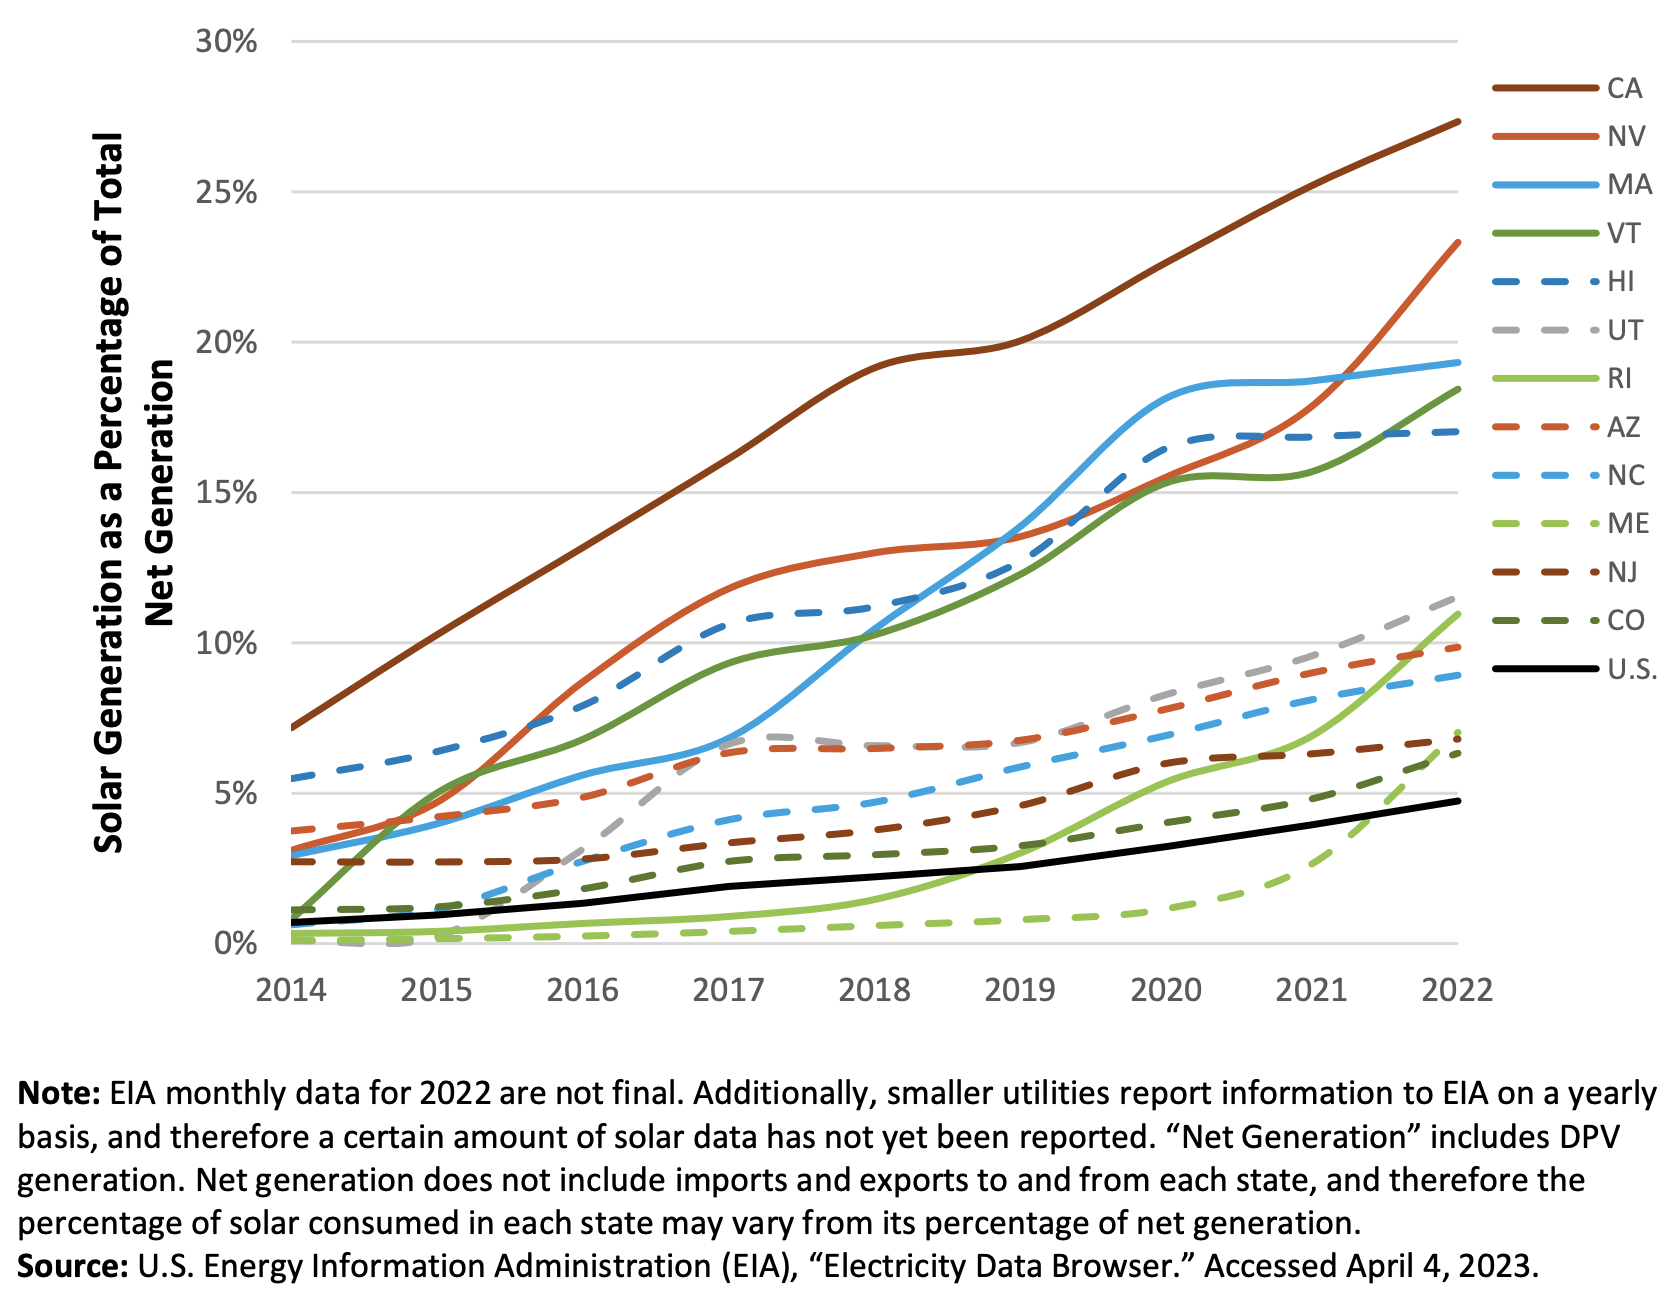
The answer is that Florida is at least above average, but it’s nowhere close to the top. Five states in the country got more than 15% of their electricity from solar power in 2022 — California was #1 again (27.3%), Nevada followed (23.3%), then Massachusetts (19.3%), Vermont (18.5%), and Hawaii (17%). No sign of Florida, or Texas. Also, it’s noteworthy that aside from sunny California, Nevada, and Hawaii there, very not sunny Massachusetts and Vermont are #2 and #3, showing how much policy matters to solar power leadership. Indeed, due to strong solar policies, “These five states have consistently led in solar generation for several years, although Nevada overtook Massachusetts and Vermont overtook Hawaii relative to 2021,” NREL writes.
After those top five solar states, the next five are well behind — a big step in solar market share behind — at 11.5% (Utah), 11% (Rhode Island), 9.9% (Arizona), 8.9% (North Carolina), and 7% (Maine). As you can see, we’re well behind California’s 27.3% and there’s no sign of Florida, or Texas for that matter. So, while California, Texas, and Florida look like solar leaders in a volume sense, California is the only true solar power leader from that “Big 3.”
But let’s look at the next five. Maybe we’ll find Florida or Texas here. Next in line are New Jersey (6.8%), Colorado (6.3%), New Mexico (6.1%), Georgia (5.7%), and Virginia (5.6%). Oy — no Florida, or Texas.

“In the past 5 years, five states (solid lines) shifted over 9% of their electricity generation to solar sources.” Courtesy of National Renewable Energy Laboratory (NREL).
Oh yes, I gave it away in the title. Florida was next in line after those top 15 solar states, landing in 16th in the overall rankings for solar adoption (measured by percent of the state’s electricity coming from solar power). NREL notes that Florida at least climbs above 5% solar market share, a feat Texas hasn’t quite accomplished. Florida got up to 5.4% solar market share in 2022, while Texas was at 4.8%. What both of these states did achieve is they were slightly above the US average, which was 4.7% (up from 0.3% a decade before in 2012). Congratulations?

“The roles of utility and distributed solar varies by state. Southern and Western states rely more on utility-scale solar, while northern states and Hawaii rely more on distributed solar.” Courtesy of National Renewable Energy Laboratory (NREL).

Note that the average solar share rate of 4.7% was up a big notch from the 3.9% average in 2021. What will 2023 bring? Will the Sunshine State finally break into the top 15? Will Texas pass the 5% barrier? Will the US pass the 5% barrier? What about the states on top? Will California pass 30% solar market share? (One would think so.) Will Nevada reach California’s 2022 level? Will Massachusetts, Vermont, and Hawaii pass 20% solar market share of electricity generation? We’ll have to wait and see. We’re taking bets now — just not financial ones, since that’s not legal as a fundraising tool for CleanTechnica.

“Total peak monthly U.S. solar generation increased by a factor of 7.2 from 2014 to 2022.” Courtesy of National Renewable Energy Laboratory (NREL).
Also see: What About Florida? Solar Energy & Regulatory Backwardness In The Sunshine State
I don’t like paywalls. You don’t like paywalls. Who likes paywalls? Here at CleanTechnica, we implemented a limited paywall for a while, but it always felt wrong — and it was always tough to decide what we should put behind there. In theory, your most exclusive and best content goes behind a paywall. But then fewer people read it! We just don’t like paywalls, and so we’ve decided to ditch ours. Unfortunately, the media business is still a tough, cut-throat business with tiny margins. It’s a never-ending Olympic challenge to stay above water or even perhaps — gasp — grow. So …


