An important change has unfolded in the global gold market. The East has been driving up the gold price, predominantly in late 2022 and the first months of 2023, breaking the West’s long standing pricing power.

Gold bazaar in Turkey. Pricing power in the gold market has recently shifted to the East.
Until recently, Western institutional money was driving the price of gold in wholesale markets such as London, mainly based on real interest rates. Gold was bought when real rates fell and vice versa. However, from late 2022 until June 2023 gold was up 17% while real rates were more or less flat, and Western institutions were net sellers. Most likely, Eastern central banks, and Turkish and Chinese private demand, lifted the price of gold.
Introduction
For about ninety years, up until 2022, there was a pattern of above-ground gold moving from West to East and back, in sync with the gold price falling and rising. Western institutions set the price of gold and bought from the East in bull markets. In bear markets the West sold to the East. For more information read my article: The West–East Ebb and Flood of Gold Revisited.
If we zoom in on the period from 2006 through 2021 the main reason for Western institutions to buy or sell gold was the 10-year TIPS rate, which reflects the 10-year expected real interest rate (“real rate,” in short) of US government bonds.
The physical gold price was predominantly set in the London Bullion Market and to a lesser extent Switzerland. Gold trade in London can be divided in three categories:
- Institutions buying and selling “large bars” (weighing 400 ounces) outright.
- Trading in large bars via Exchange-Traded Funds (ETFs).
- Arbitragers buying and selling in London to profit from price discrepancies between the COMEX futures price and London spot. In this sense London serves as a warehouse for the COMEX futures exchange.
As we will see below, the TIPS rate, UK net gold import (positive or negative), Western ETF holdings, and the COMEX open interest were all correlated to the price of gold. Until the war in Ukraine broke out late February 2022, that is, and things started to change.
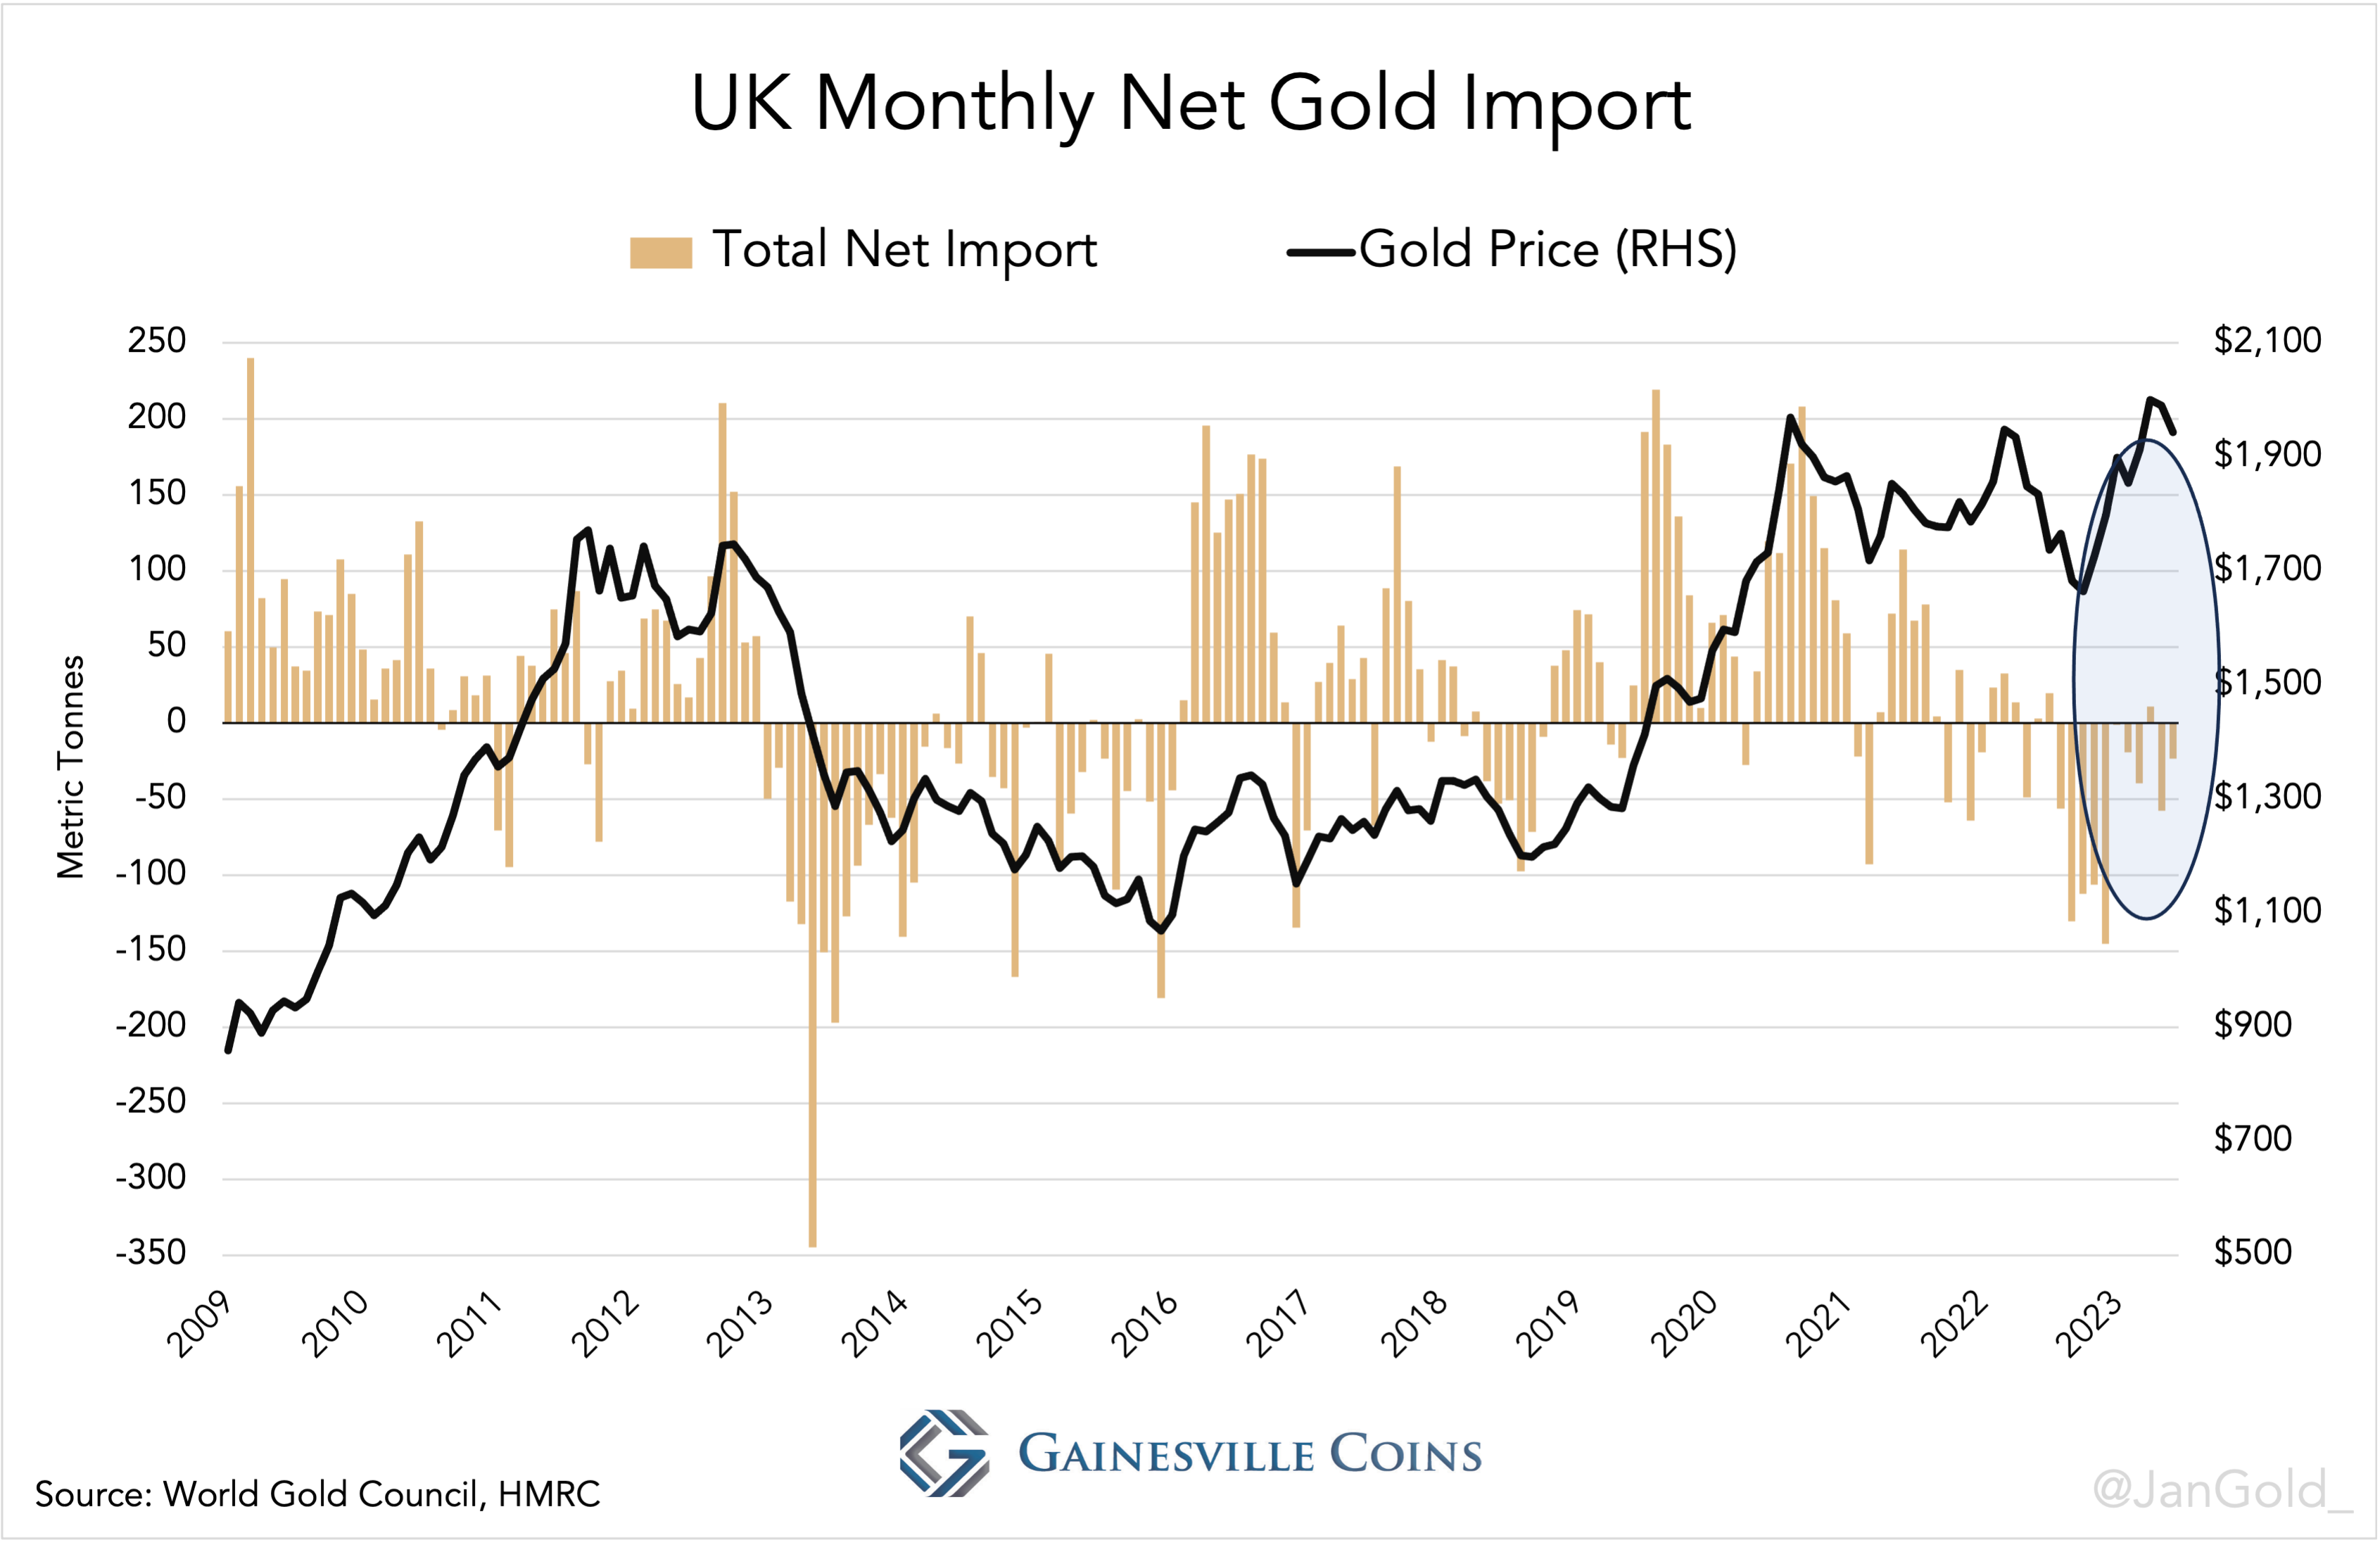
Chart 1. Monthly net flows through the UK have normally coincided with gold price direction. These flows tipped the gold supply and demand balance and thus set the price of gold.
Because customs data lags a few months, and the World Gold Council’s supply and demand data is published quarterly, we will cover the global market until June 2023 in this article. We will examine how gold is becoming less sensitive to real rates, and how London is losing its gold pricing power.
The West is Losing its Gold Pricing Power
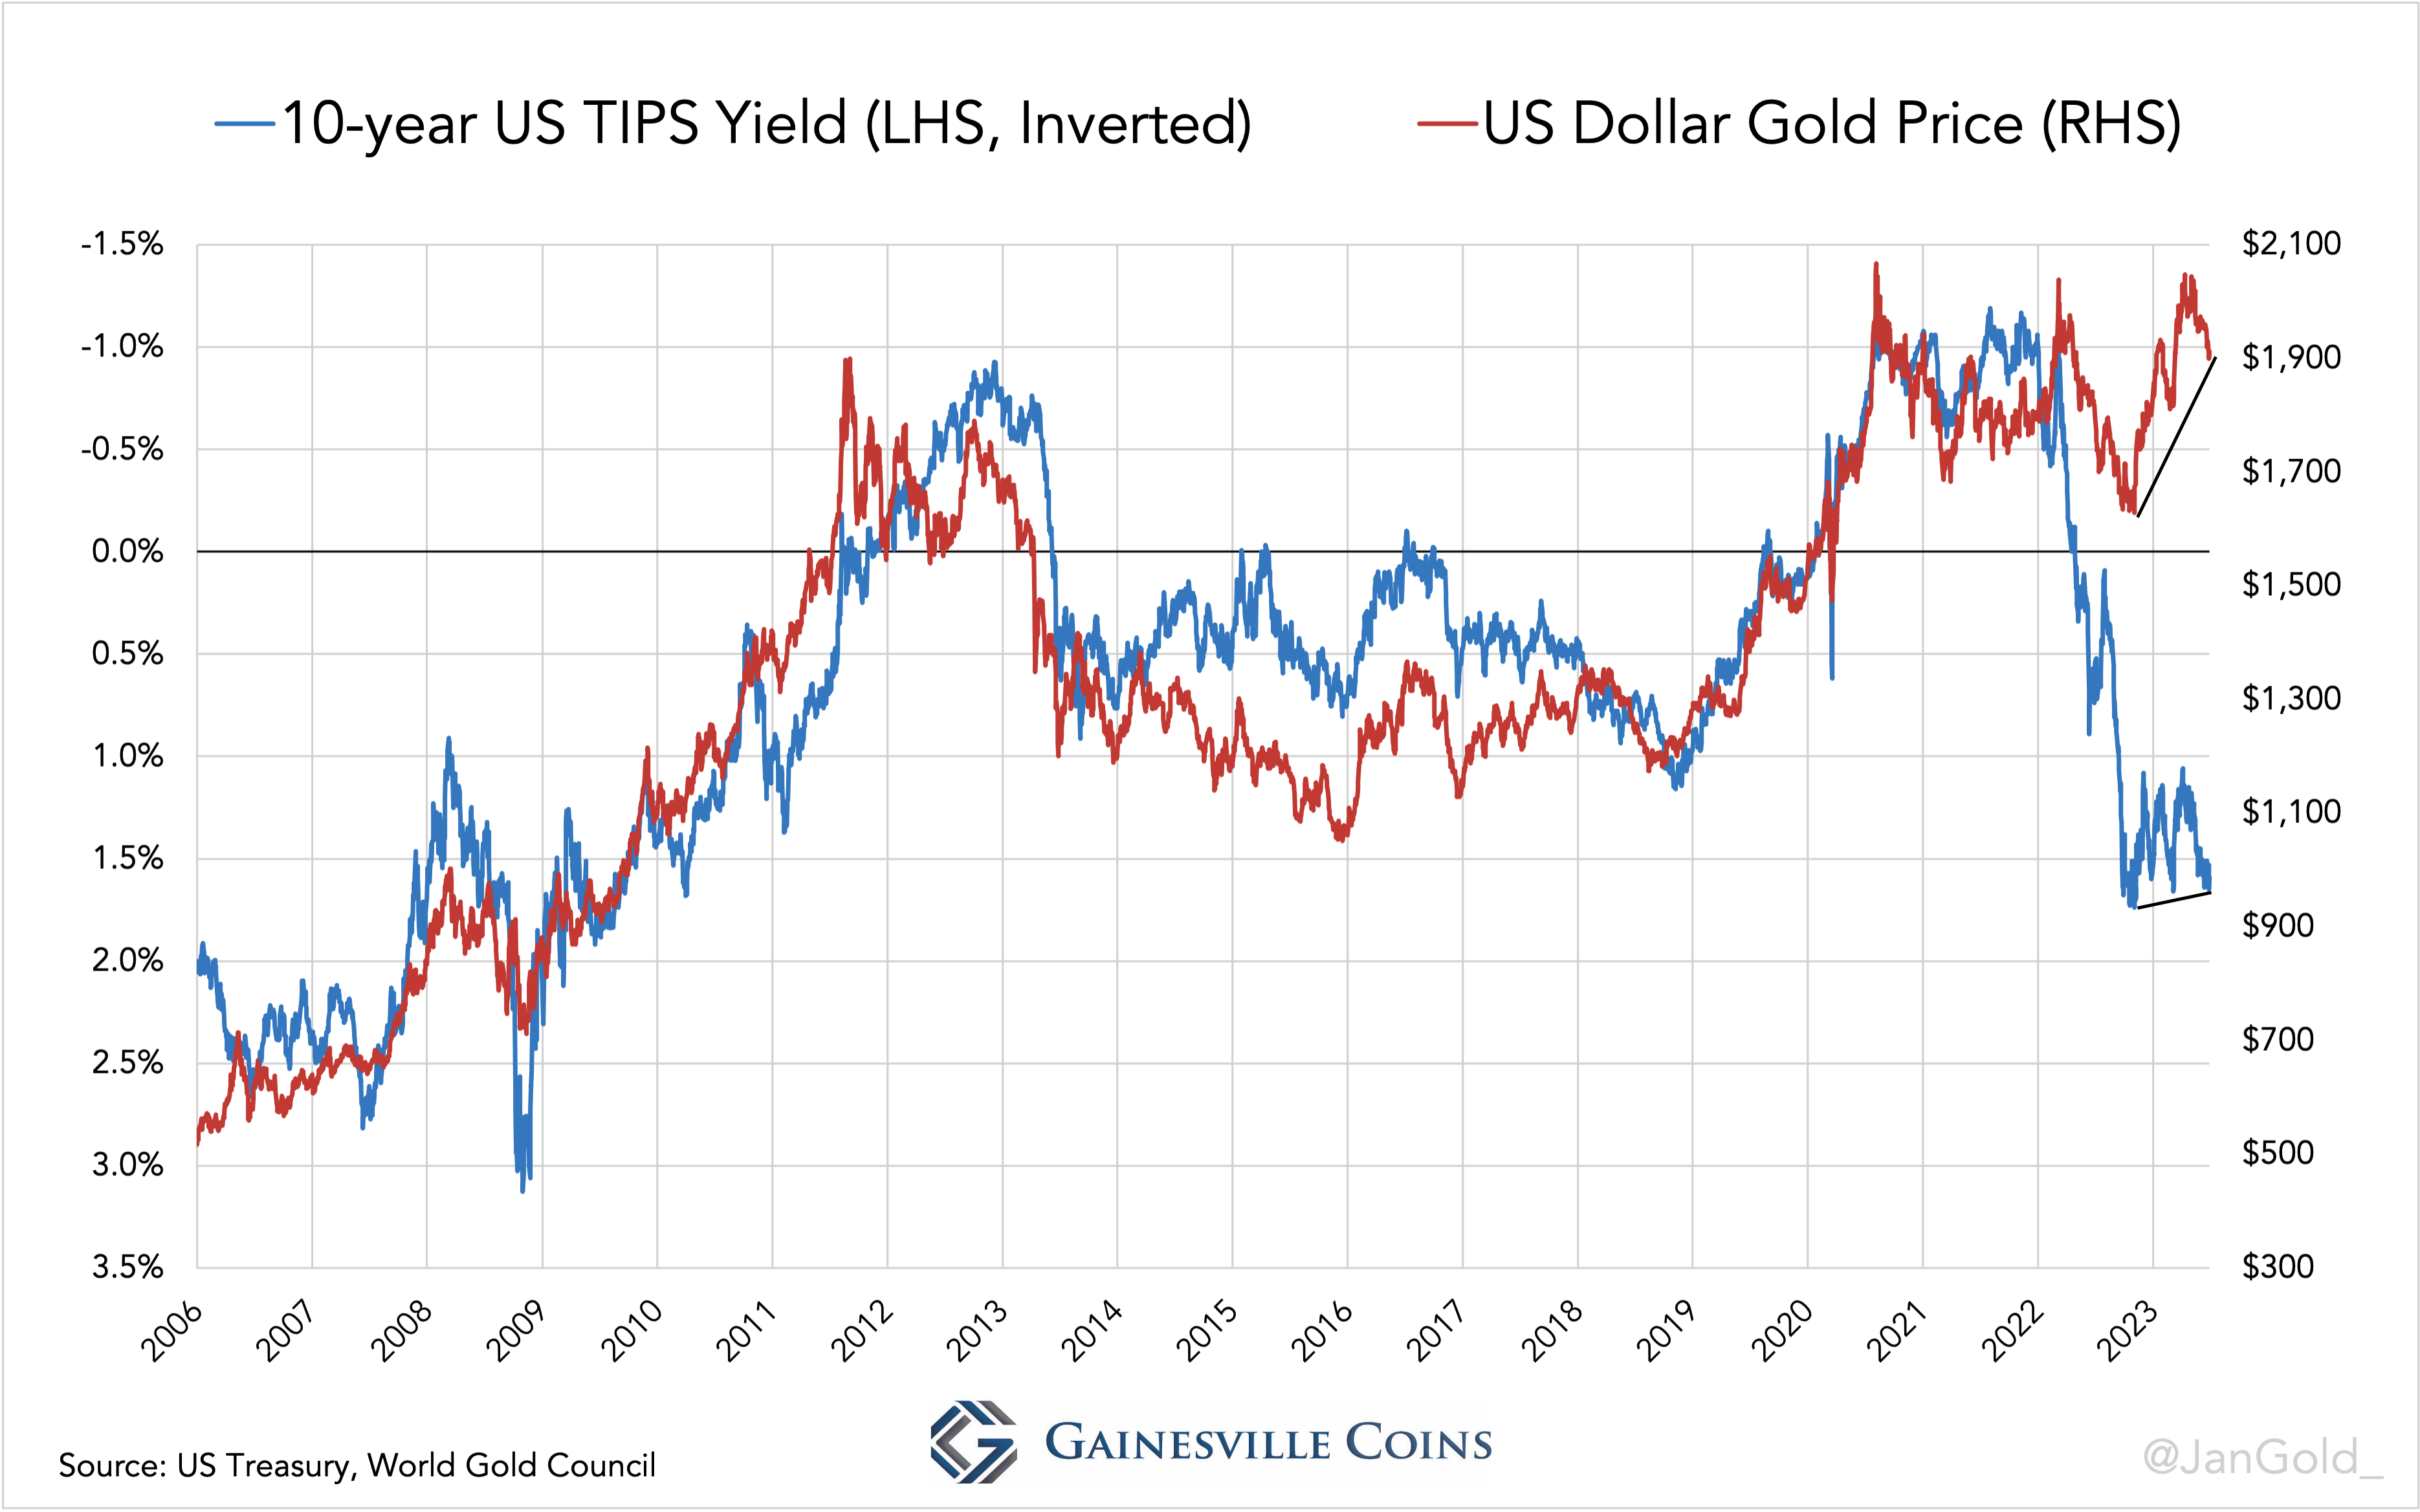
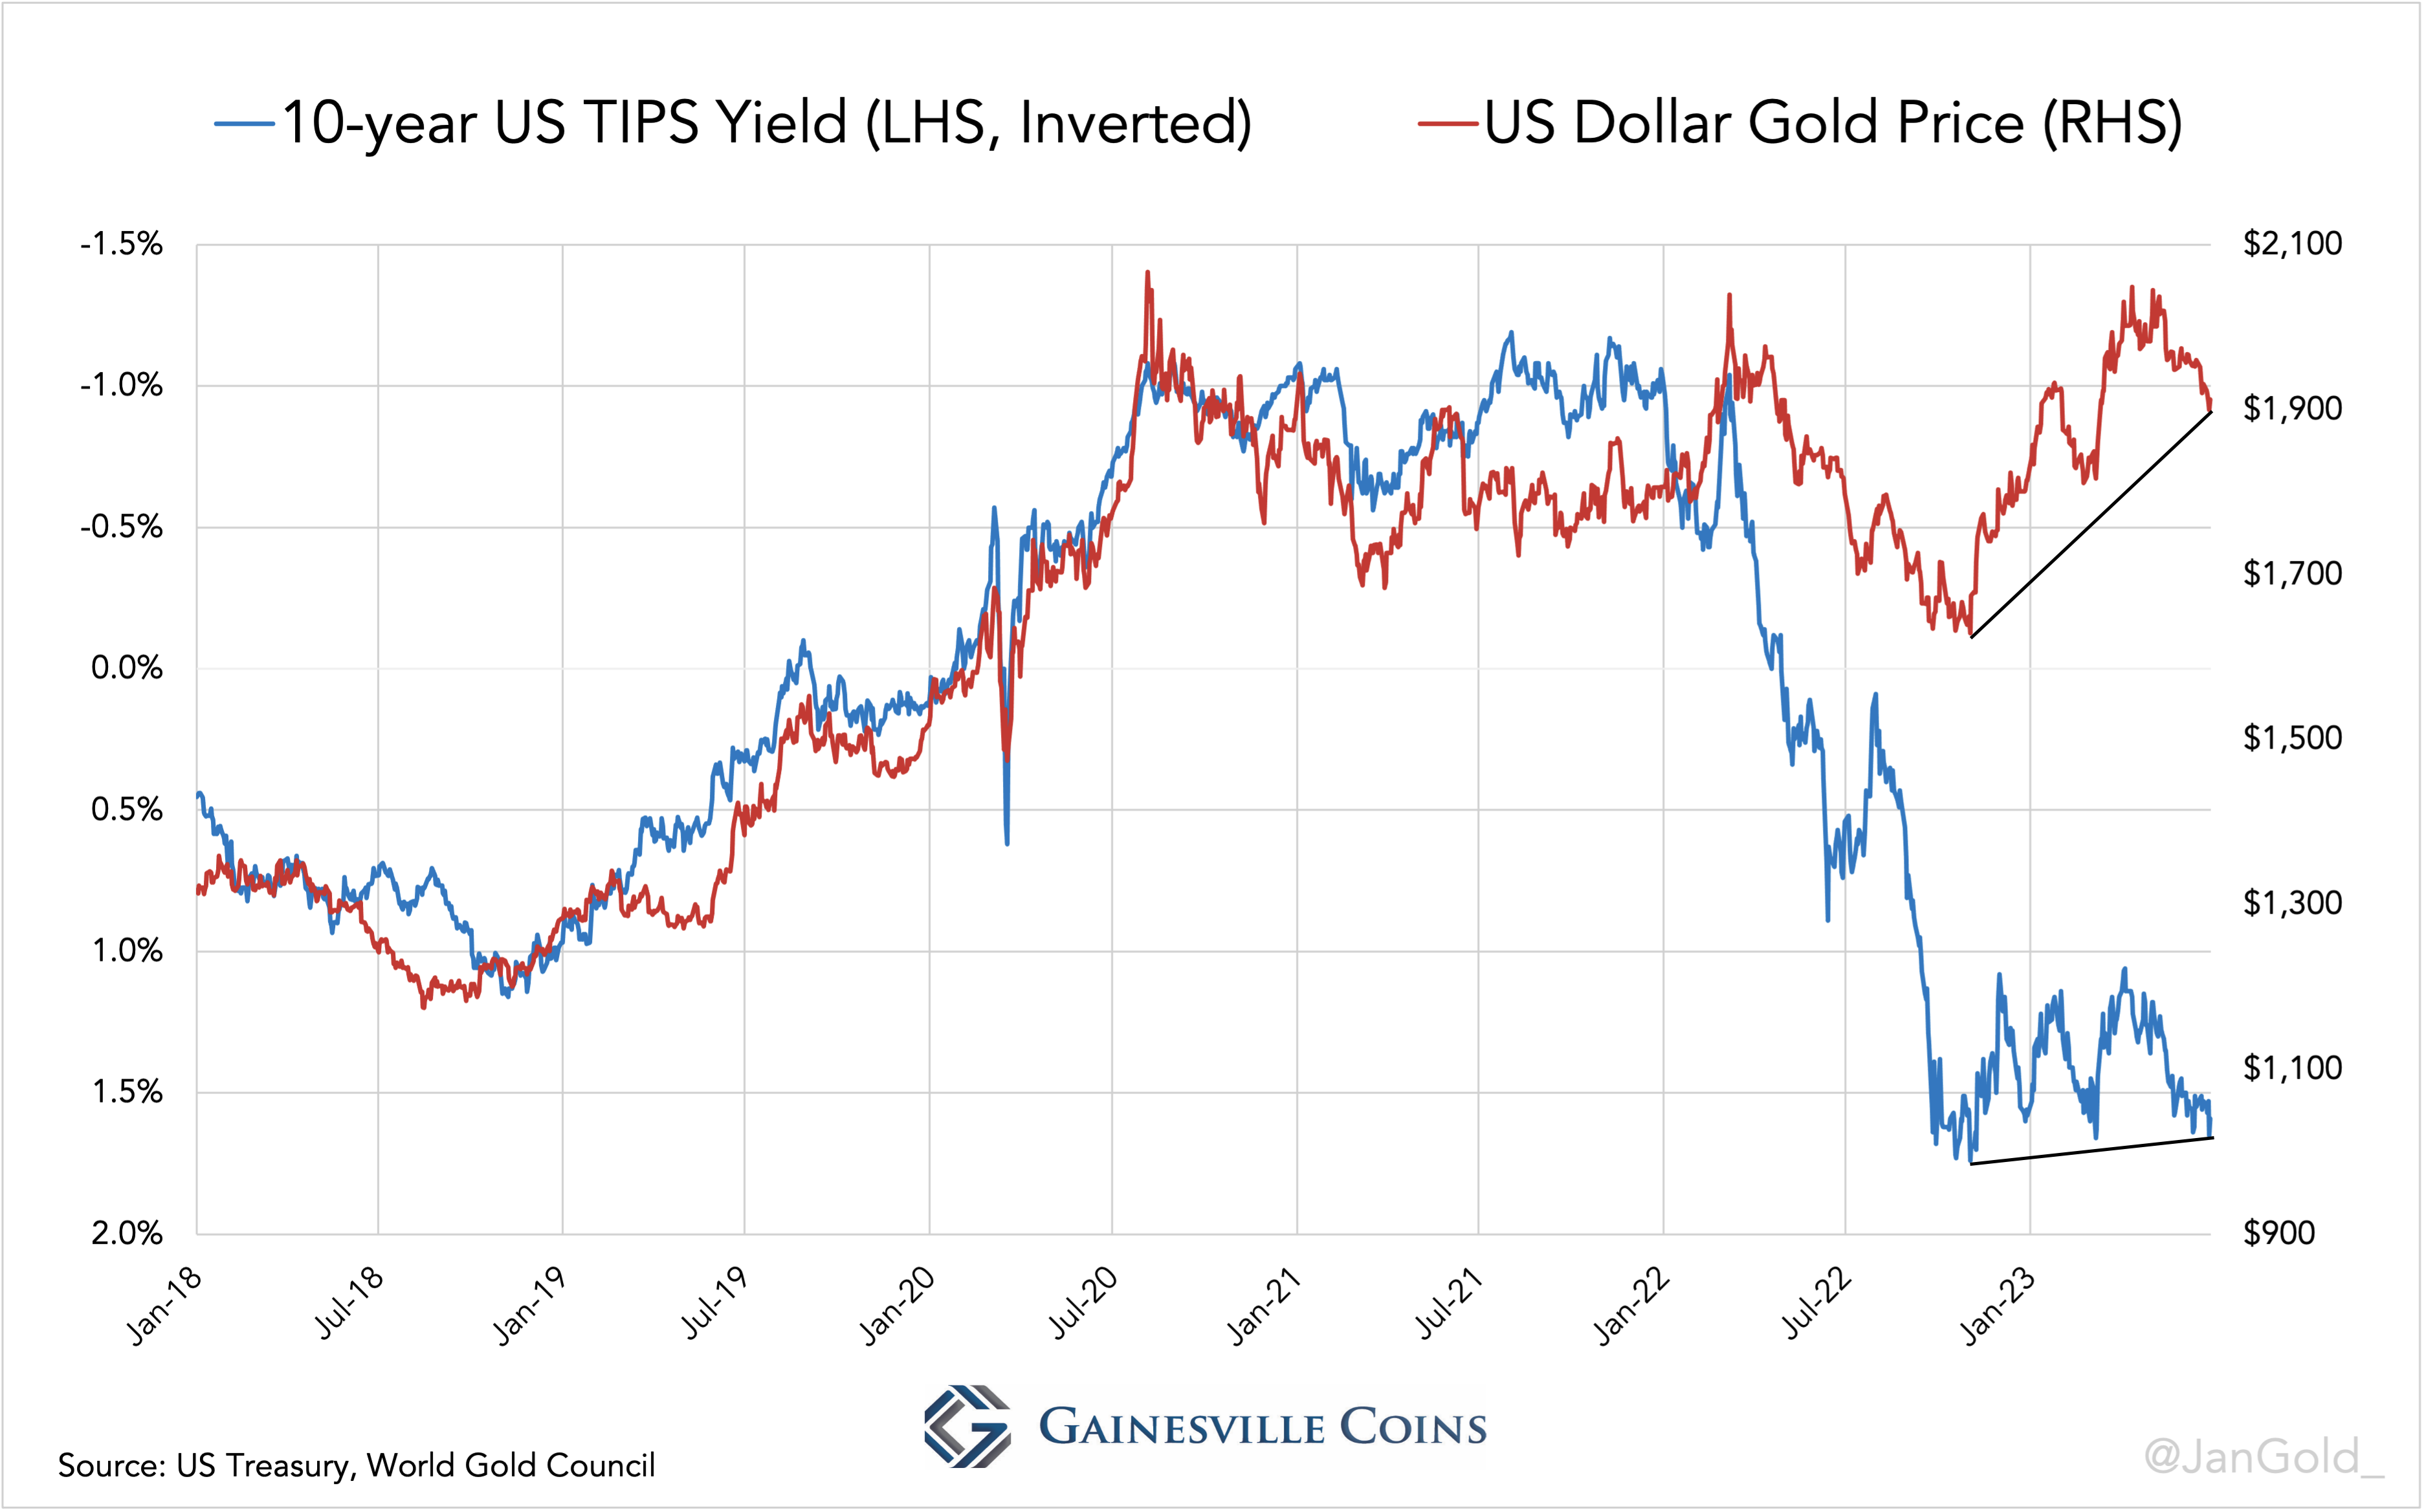
Let’s start by reviewing the correlation between real rates and gold. Note, the TIPS yield axes in the charts below are inverted because higher rates caused lower gold prices and vice versa.
From March until September 2022 the TIPS yield rose dramatically (down in the chart), but the price of gold reacted less bearish than the “rates model” previously prescribed. As London was still a net exporter over this time horizon, I conclude the West was still in charge of the price. But then came the third quarter of 2022.
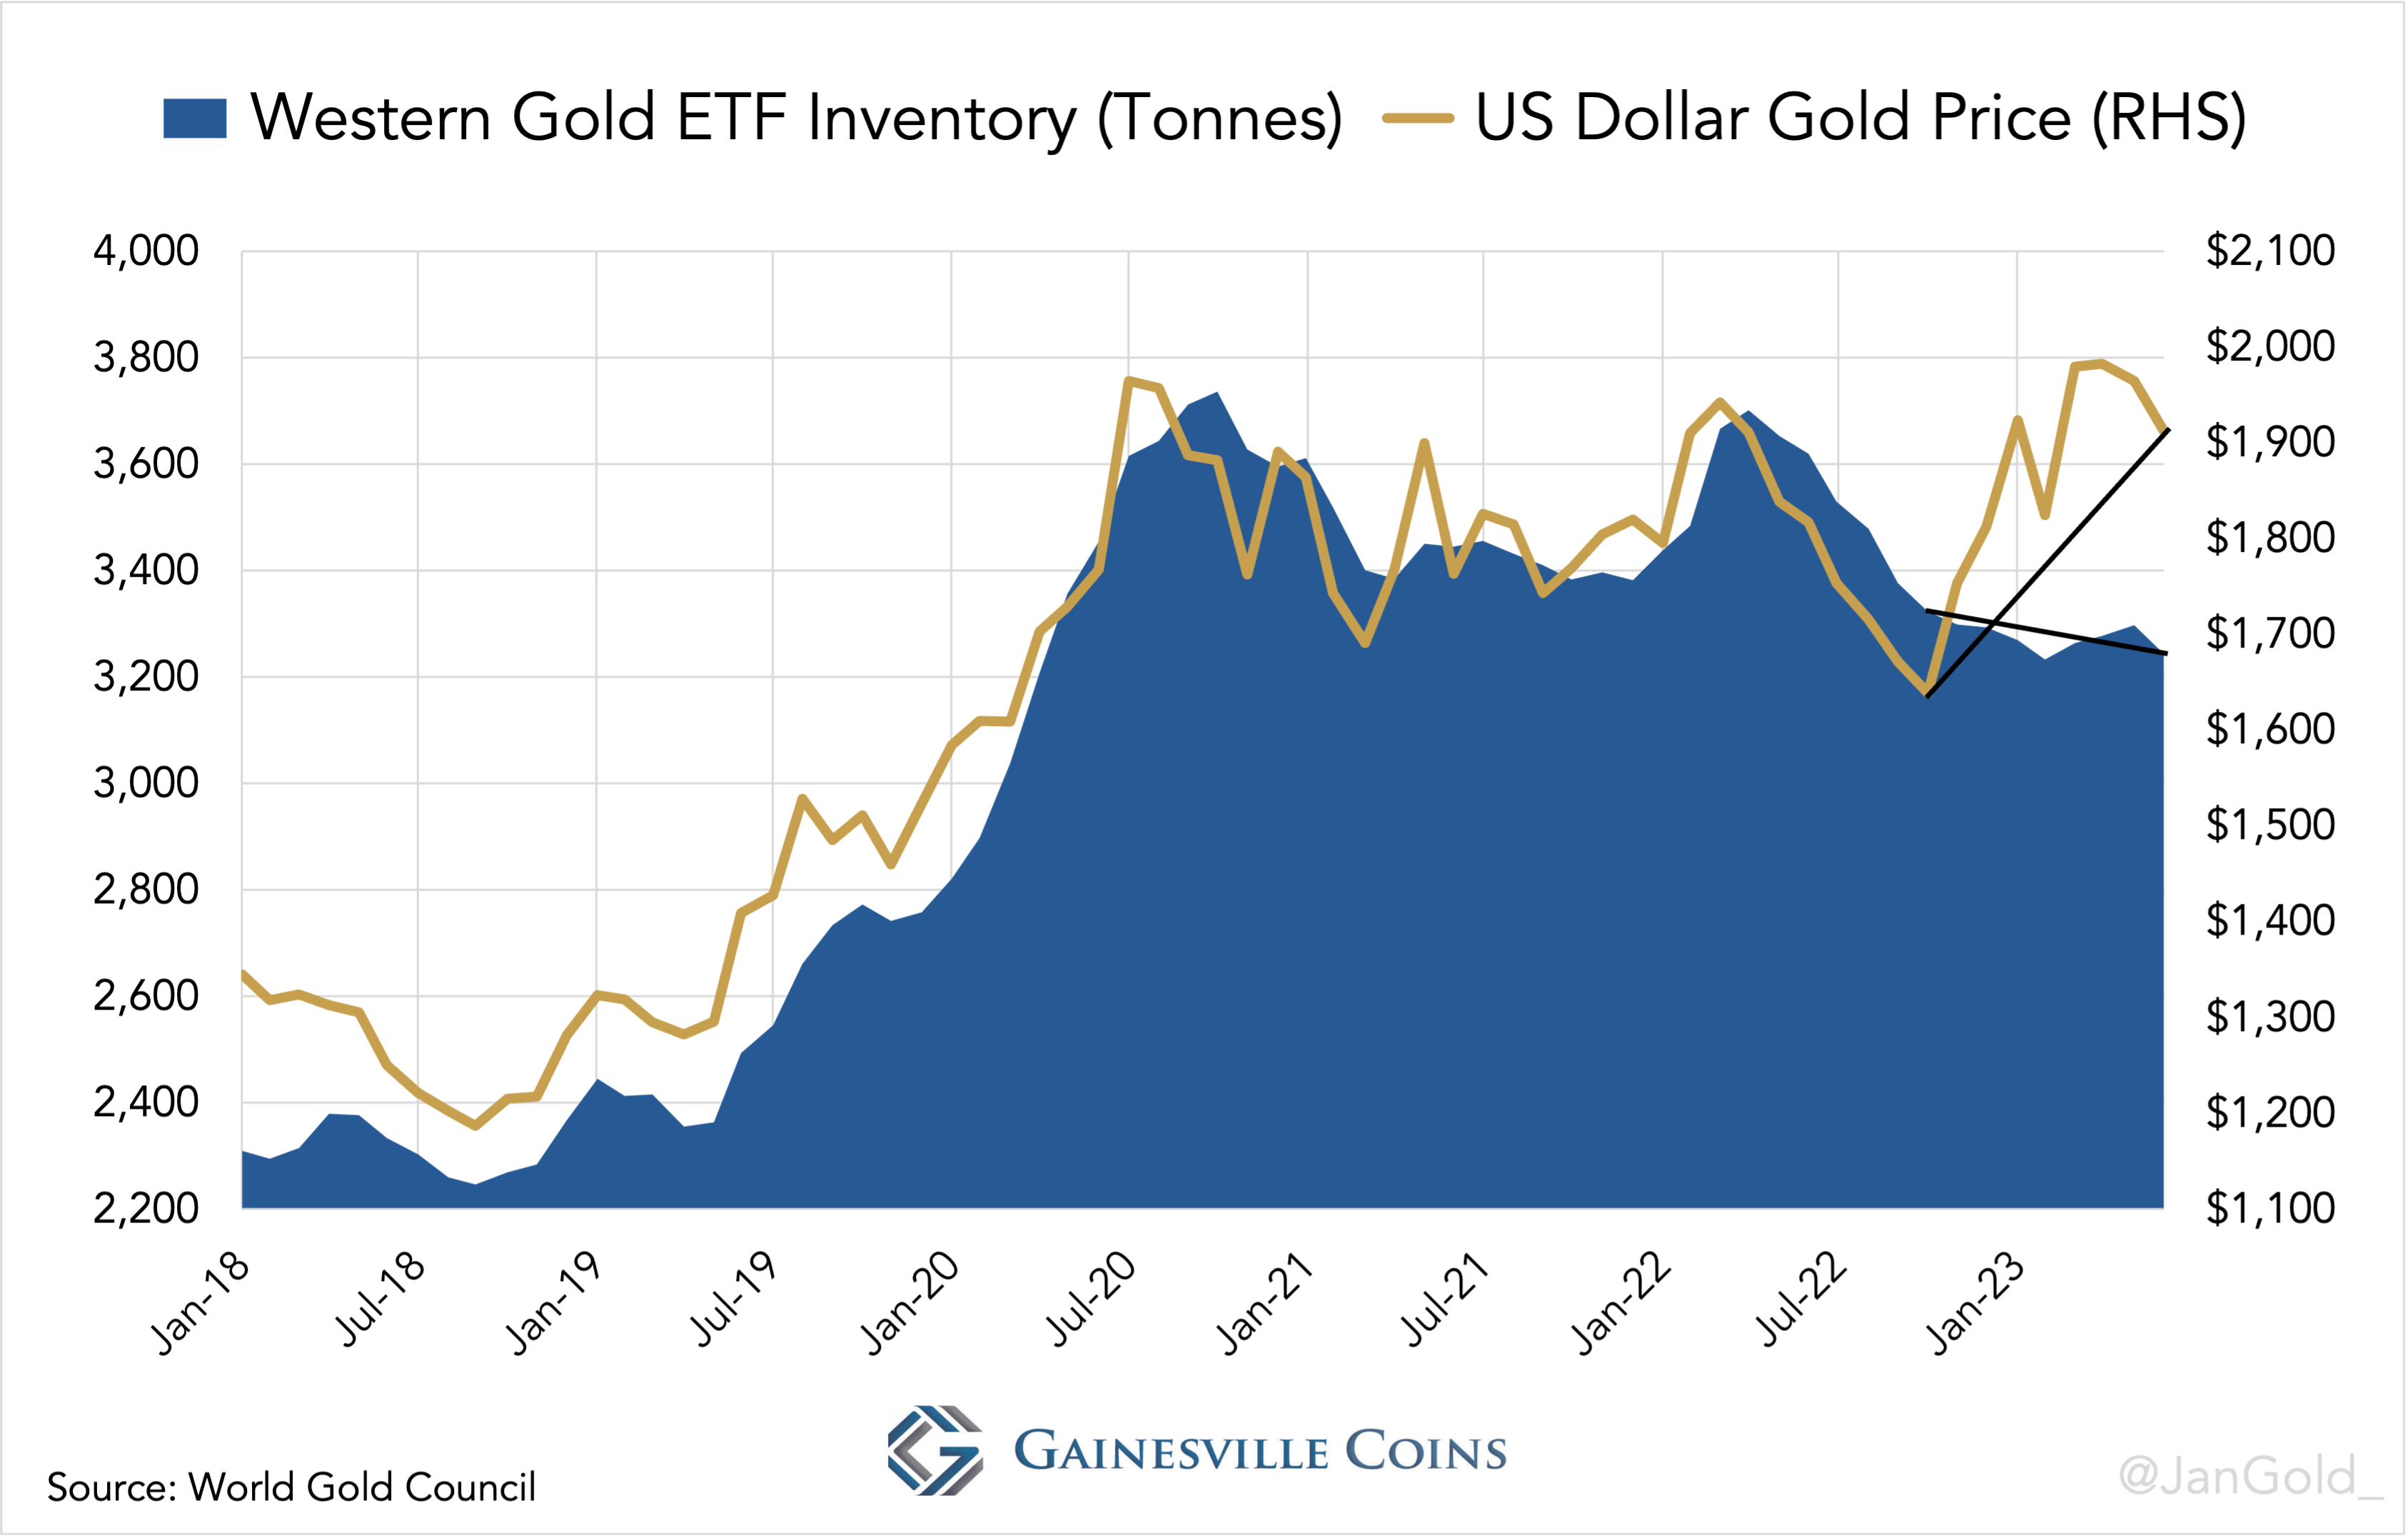
From late October 2022 until June 2023 the TIPS rate was barely down while gold was up 17%. Remarkably, the West wasn’t driving up the gold price, as demonstrated by UK net exports, declining Western ETF inventory, and falling COMEX open interest.
First, the UK’s monthly net flows. Obviously, the price wasn’t set in London, as the UK was a net seller while the price was up. In Chart 1 and 4 you can see this is unprecedented.
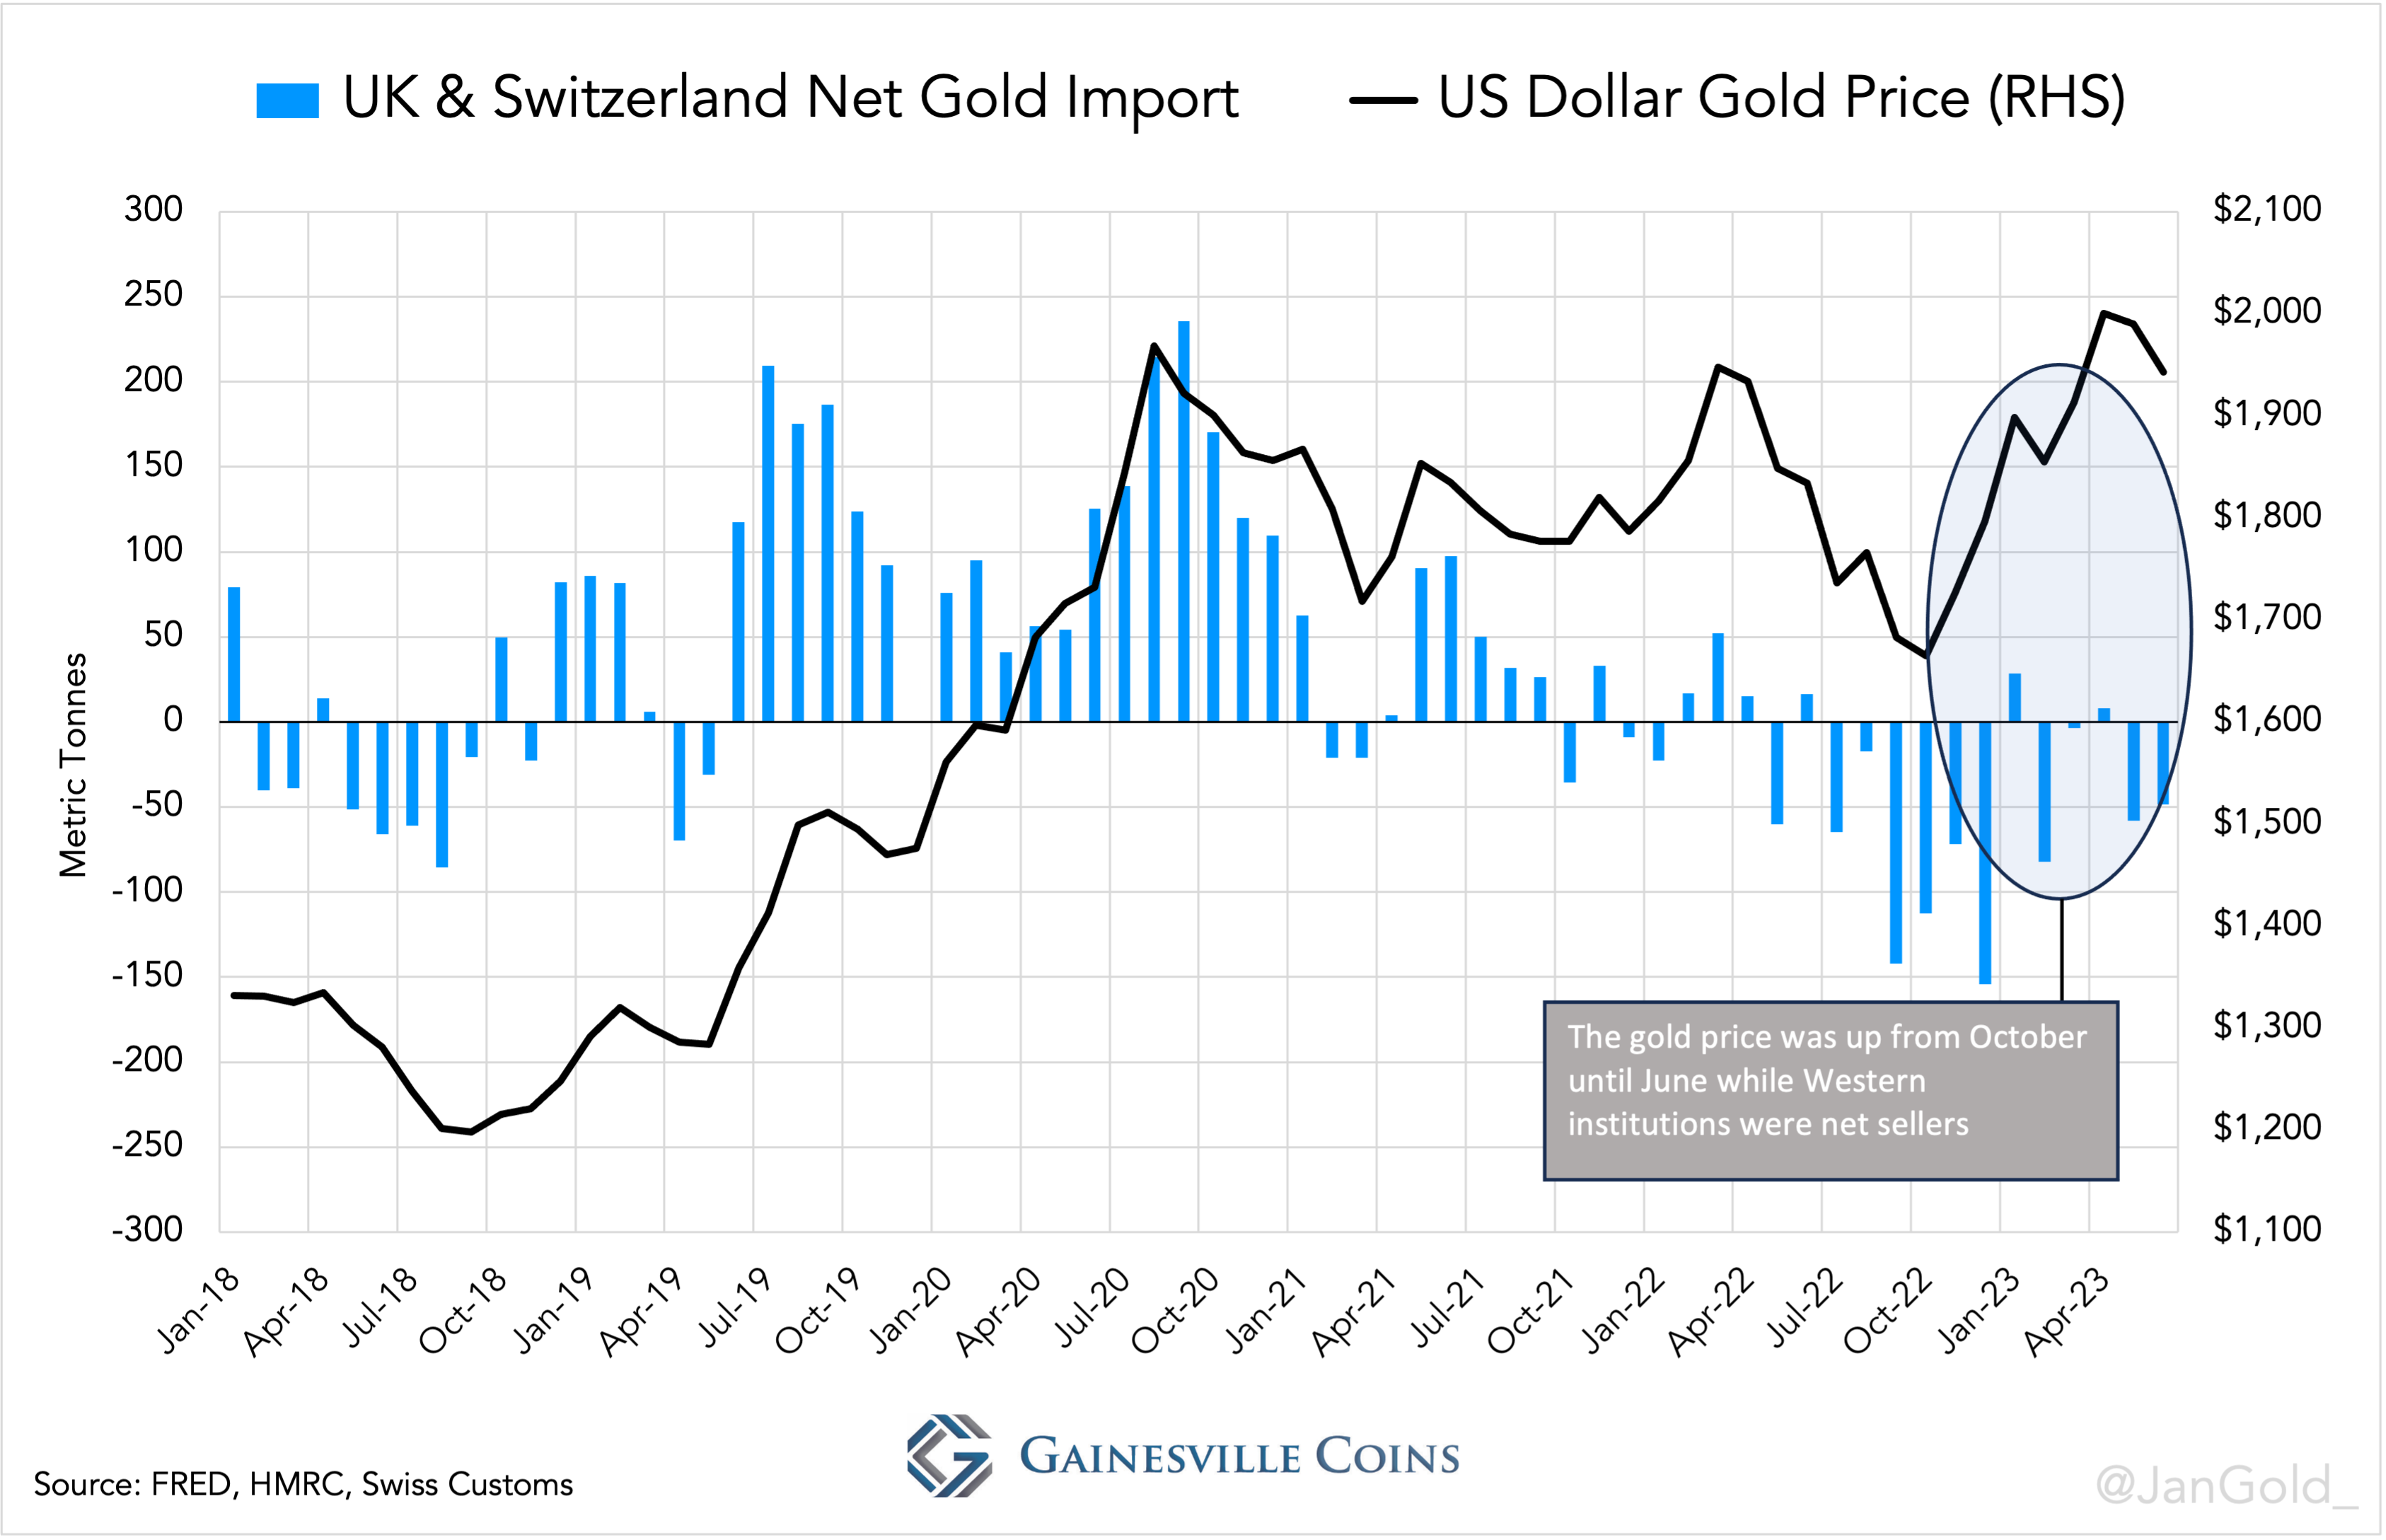
Chart 4. The UK’s net gold flows are virtually all related to the London Bullion Market because domestic retail demand is relatively small. UK net import includes ETF flows.
Also taking into account gold flows through Switzerland, the second largest Western physical gold market and largest refining hub globally, shows a similar picture. For the first time since monthly data is available, the gold price has been rising over several months while the UK and Switzerland combined are net exporters.
Not surprisingly, Western ETF inventory, of which the majority is stored in London and Switzerland, has declined over the past three quarters.
Western institutions that trade gold outright or use ETFs are dominant on the COMEX futures exchange as well. At the COMEX we see the same development: gold’s open interest has fallen over the period in question.
The East on a Gold Buying Spree
If the UK and Switzerland were net exporters, who did they sell to? The UK mainly exported gold to Switzerland, so to answer this question all we have to do is find out which countries Switzerland exported to and check if these countries didn’t sell the metal on.
The Swiss customs department lets users track the flow of goods per continent. Apparently, Switzerland was a huge net exporter to Asia when the gold price went up.
Chart 8. Normally, when the price escalated the West was Switzerland’s largest buyer, and the East a supplier. But not from late 2022 through the first months of 2023.
Let’s see which of Switzerland’s main buyers in Asia could have pushed up the gold price.
It wasn’t India, as the Indians, like most people in the East, are price sensitive. From October through June India’s net gold imports declined, with the exception of June when the price reverted.
Chart 9. Citizens in Asia commonly buy in steady markets, and especially when the price declines. On escalating prices buying slows or turns into selling.
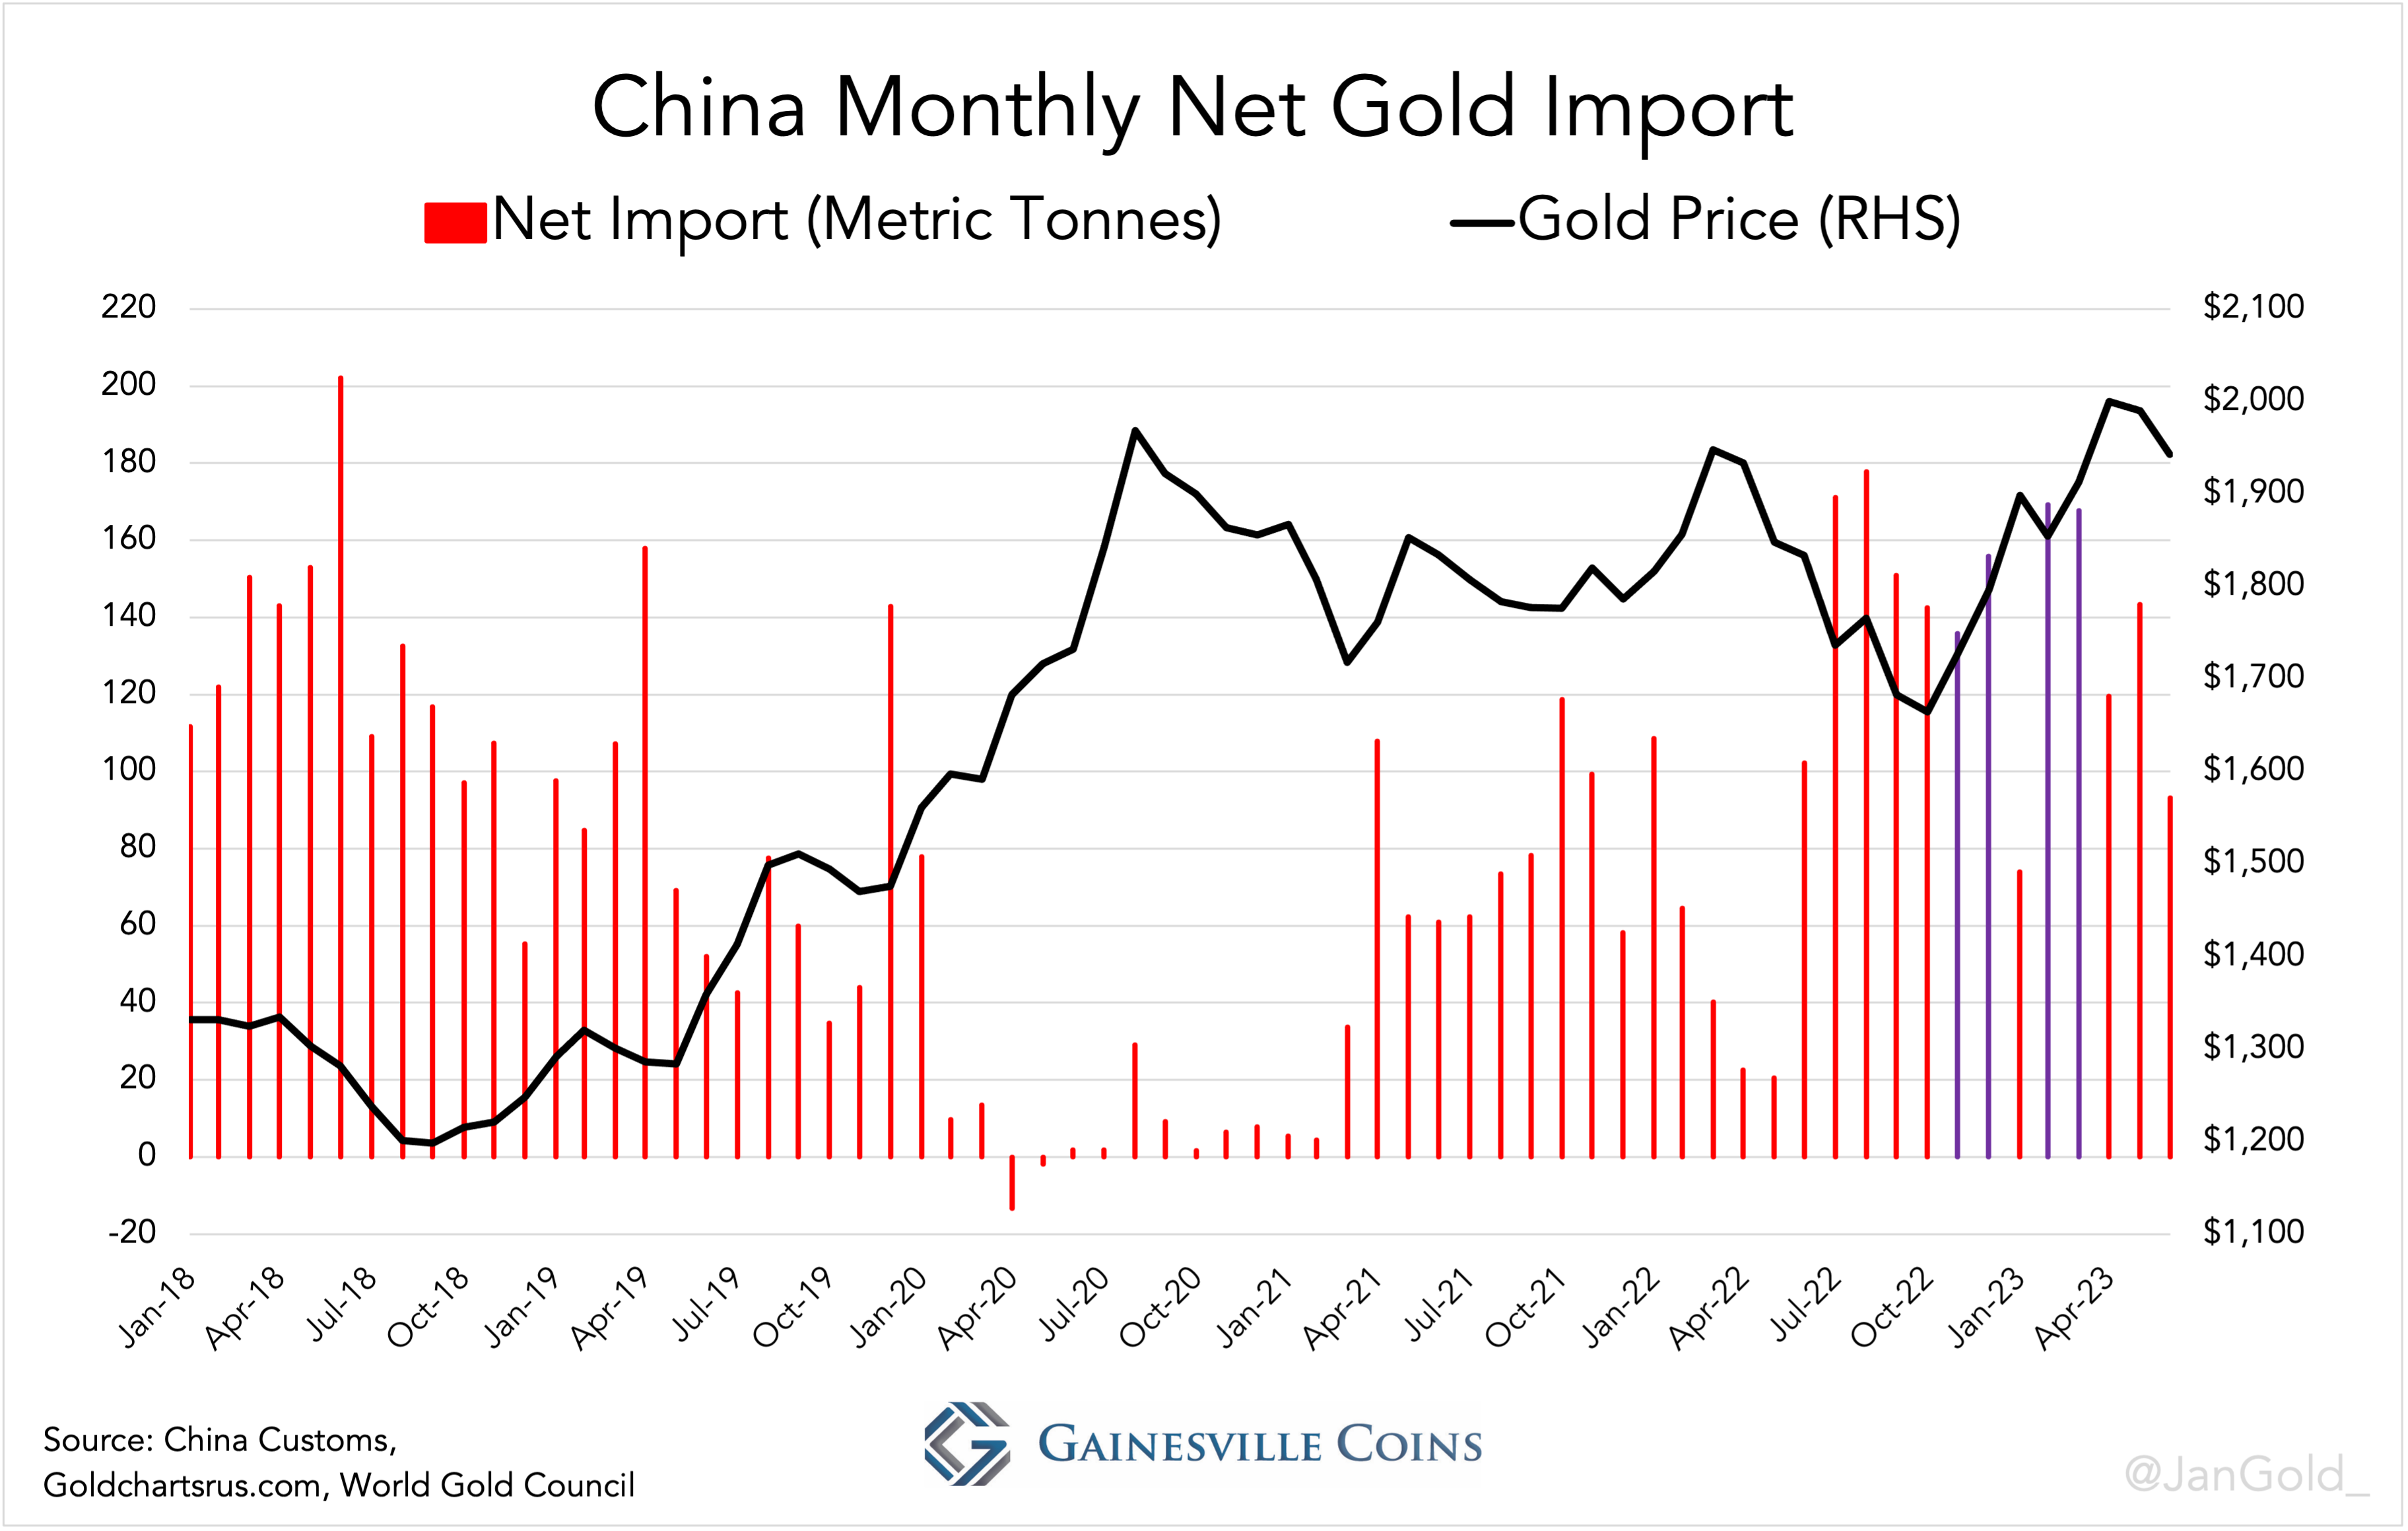
Possibly, Chinese private demand somewhat lifted the gold price. Although the Chinese are usually price sensitive, net imports into the mainland were surprisingly strong in November and December 2022, and in February and March 2023.
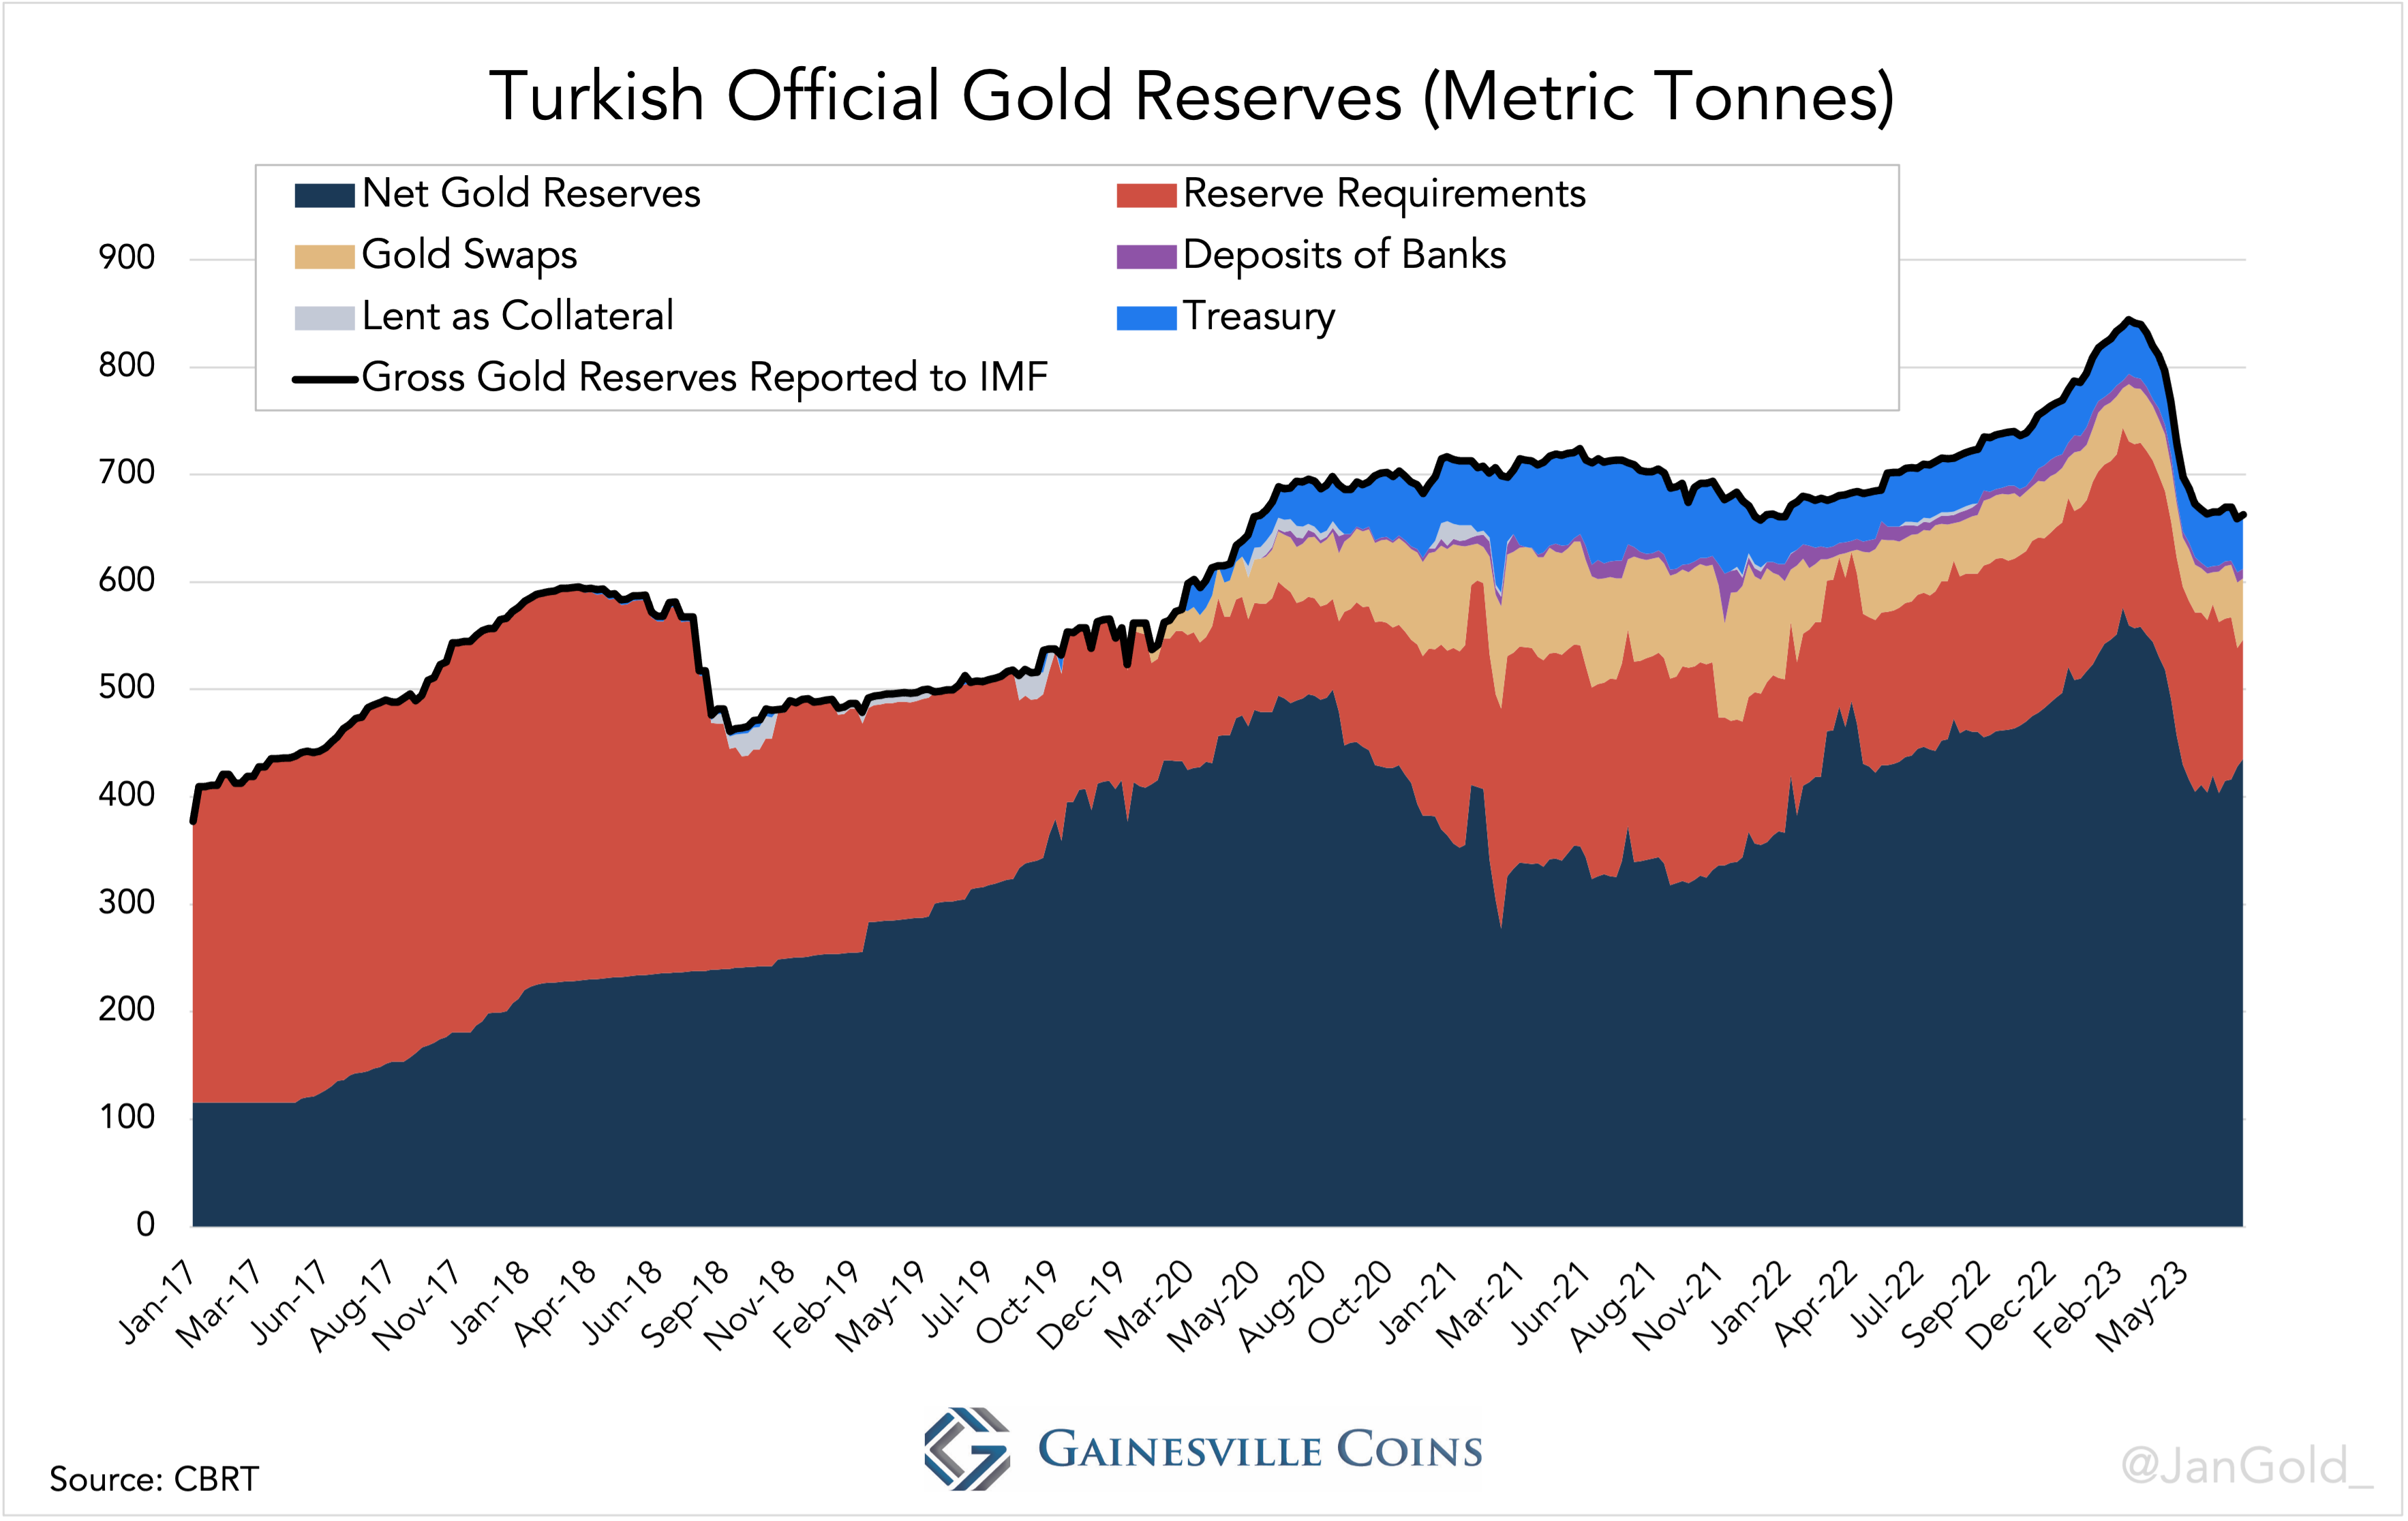
Turkey’s net import reached an all-time high in January 2023 when the Turkish lira continued to devalue and the Turks fled to real estate, durable goods and, needless to say, gold. After January the Turkish central bank began blocking imports and sold 156 tonnes of its official gold reserves domestically to defend the lira. No doubt that Turkish private demand, mainly up until January, has had an impact on the gold price.
Chart 12. Turkish official gold reserves reported by the IMF are overstated, as the Turkish central bank (CBRT) carries gold liabilities on its balance sheet related to the Treasury, commercial banks, gold swaps, and more. “Net gold reserves” is what the CBRT owns of itself. I have consulted with two Turkish economists to improve my methodology for measuring CBRT’s gold reserves.
A proper indicator of a trend reversal is the net flows to Eastern trading hub Hong Kong. Normally Hong Kong would be a net importer when the price declines (and vice versa). Recently, however, Hong Kong was a net importer while the price was up. Possibly, central banks are buying in Hong Kong, monetize the gold locally, and repatriate the metal outside the scope of public customs data. Gold owned by central banks (“monetary gold”) is exempt from being reported in customs data.
The tonnages recently net imported by Hong Kong may not be very impressive, but they could be a sign of a larger development. If central banks are buying in Hong Kong they can be buying anywhere.
Major suspects are non-Western central banks secretly buying gold, as dollar assets have become riskier to hold since the US seized Russia’s official dollar reserves in 2022. These central banks have an incentive not to make public rushing into gold or the price would spike excessively giving them less bang for their buck.
Every quarter the World Gold Council (WGC) publishes an estimate, based on field research by Metals Focus, that reflects how much they think central banks have bought. Since the Ukraine war these quarterly estimates are much higher than what central banks in aggregate report to the IMF. Most likely covert central bank purchases have boosted the price.
Conclusion
The most logical explanation for gold’s recent behavior is a combination of surreptitious buying by central banks from emerging markets, and strong private demand in Turkey and China. It’s possible the WGC’s estimates of covert central bank buying are too low, given these estimates were falling during the price spike at the end of 2022 and the beginning of 2023.
As some of you might have noticed the US dollar gold price has been declining in the last months of the period of our investigation, and London was still a net exporter. Perhaps the West will regain control over the price again. I don’t expect the gold price to fall to levels previously suggested by the rates model though.
Central bank buying is likely to stay strong. “We still believe that the official sector will remain a sizeable bullion buyer for the foreseeable future …, as factors that encouraged reserve managers to add gold reserves in recent years are expected to persist,” Metals Focus wrote this August.
We will have to wait and see if the East is able to further push up the price of gold and weaken the West’s control over the price. If so, gold will become less of a dollar derivative, and take more center stage in the international monetary system. Any developments will be reported on these pages accordingly.
Courtesy of Gainesvillecoins.com
Article originally published here.
*********

