Sign up for daily news updates from CleanTechnica on email. Or follow us on Google News!
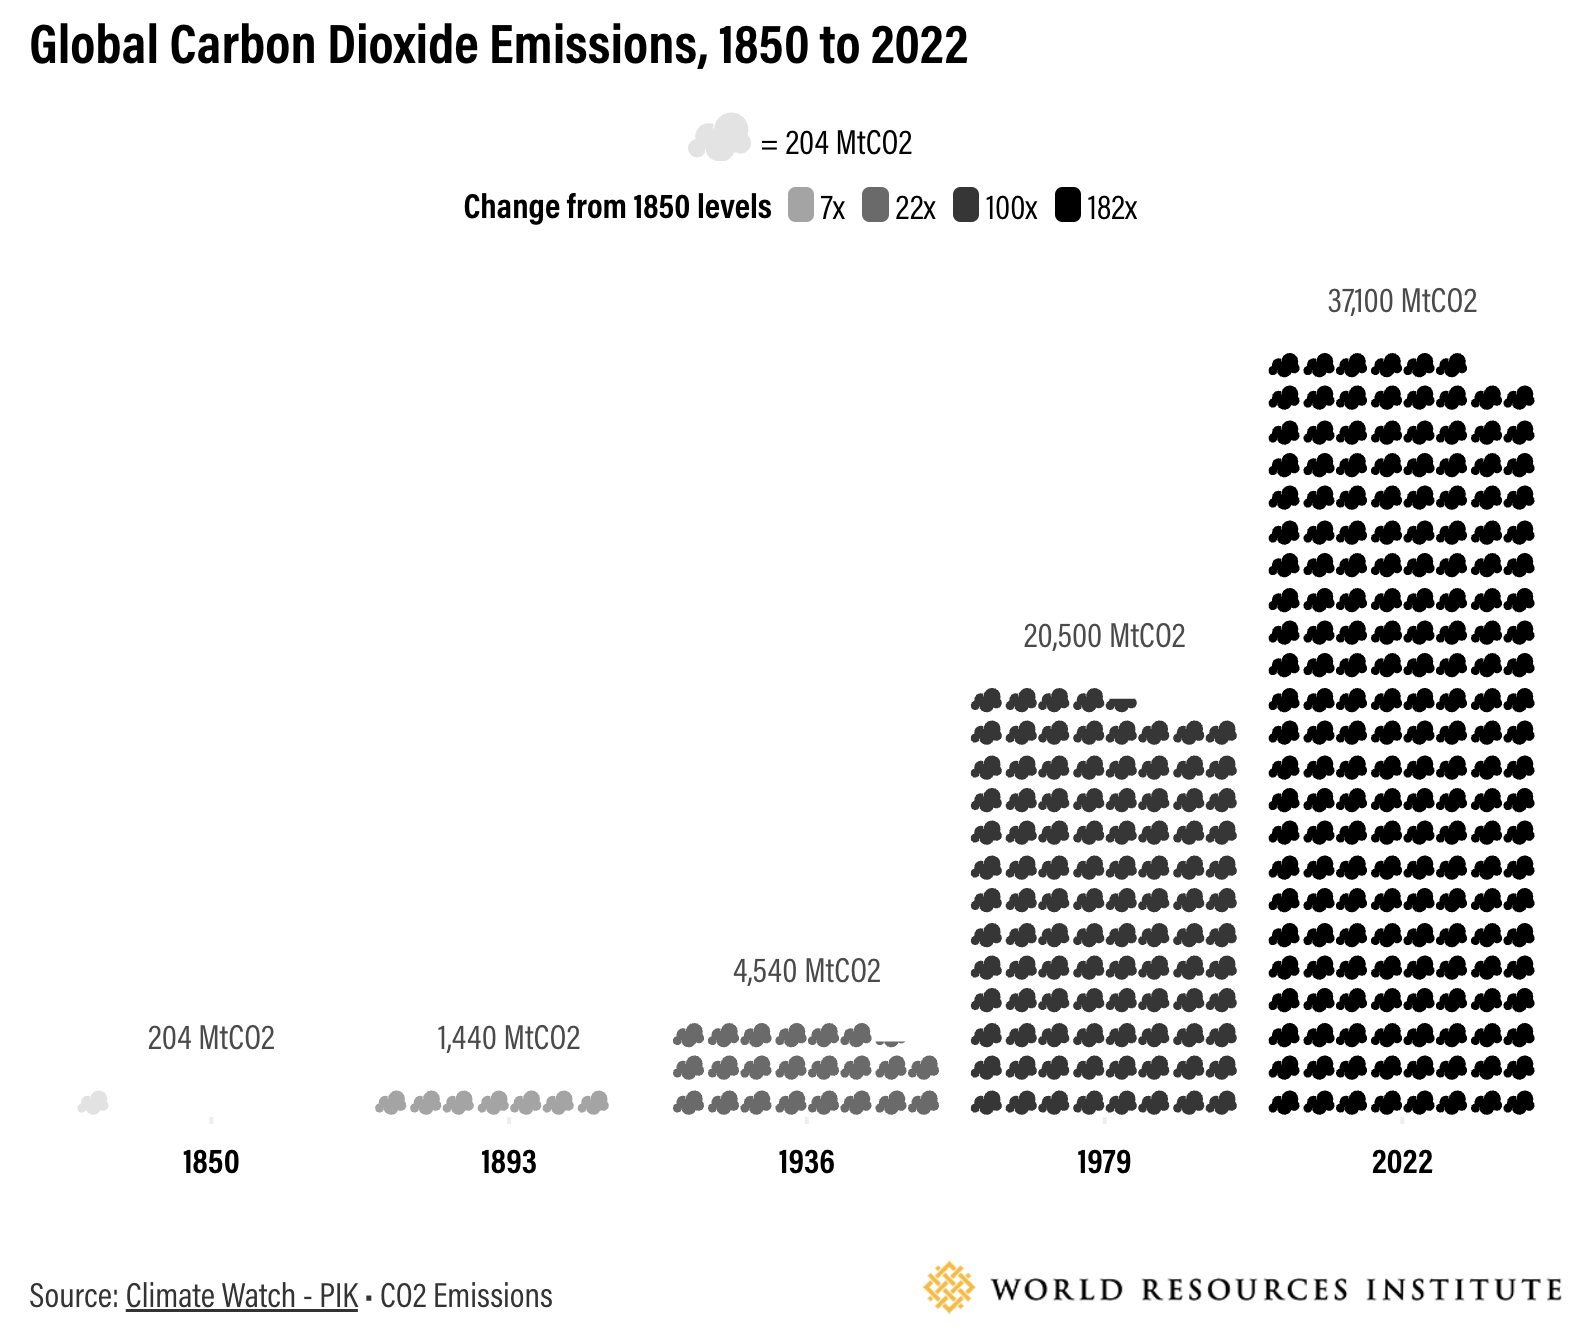
Carbon dioxide (CO2) emissions from human activities are now higher than at any point in our history. In fact, recent data reveals that global CO2 emissions were 182 times higher in 2022 than they were in 1850, around the time the industrial revolution was underway.1
How did we arrive at such an unprecedented and precarious state? To answer this and other key questions, we analyzed the latest emissions data from WRI’s Climate Watch platform. In addition to countries’ historical emissions trends, we looked at major drivers of increasing emissions, such as population growth, economic development and energy use.
For context, the United Kingdom was the world’s largest CO2 emitter in 1850, the first year of available data. Its emissions were nearly six times those of the United States, the second-ranked country at the time. France, Germany and Belgium completed the list of the top five emitters.
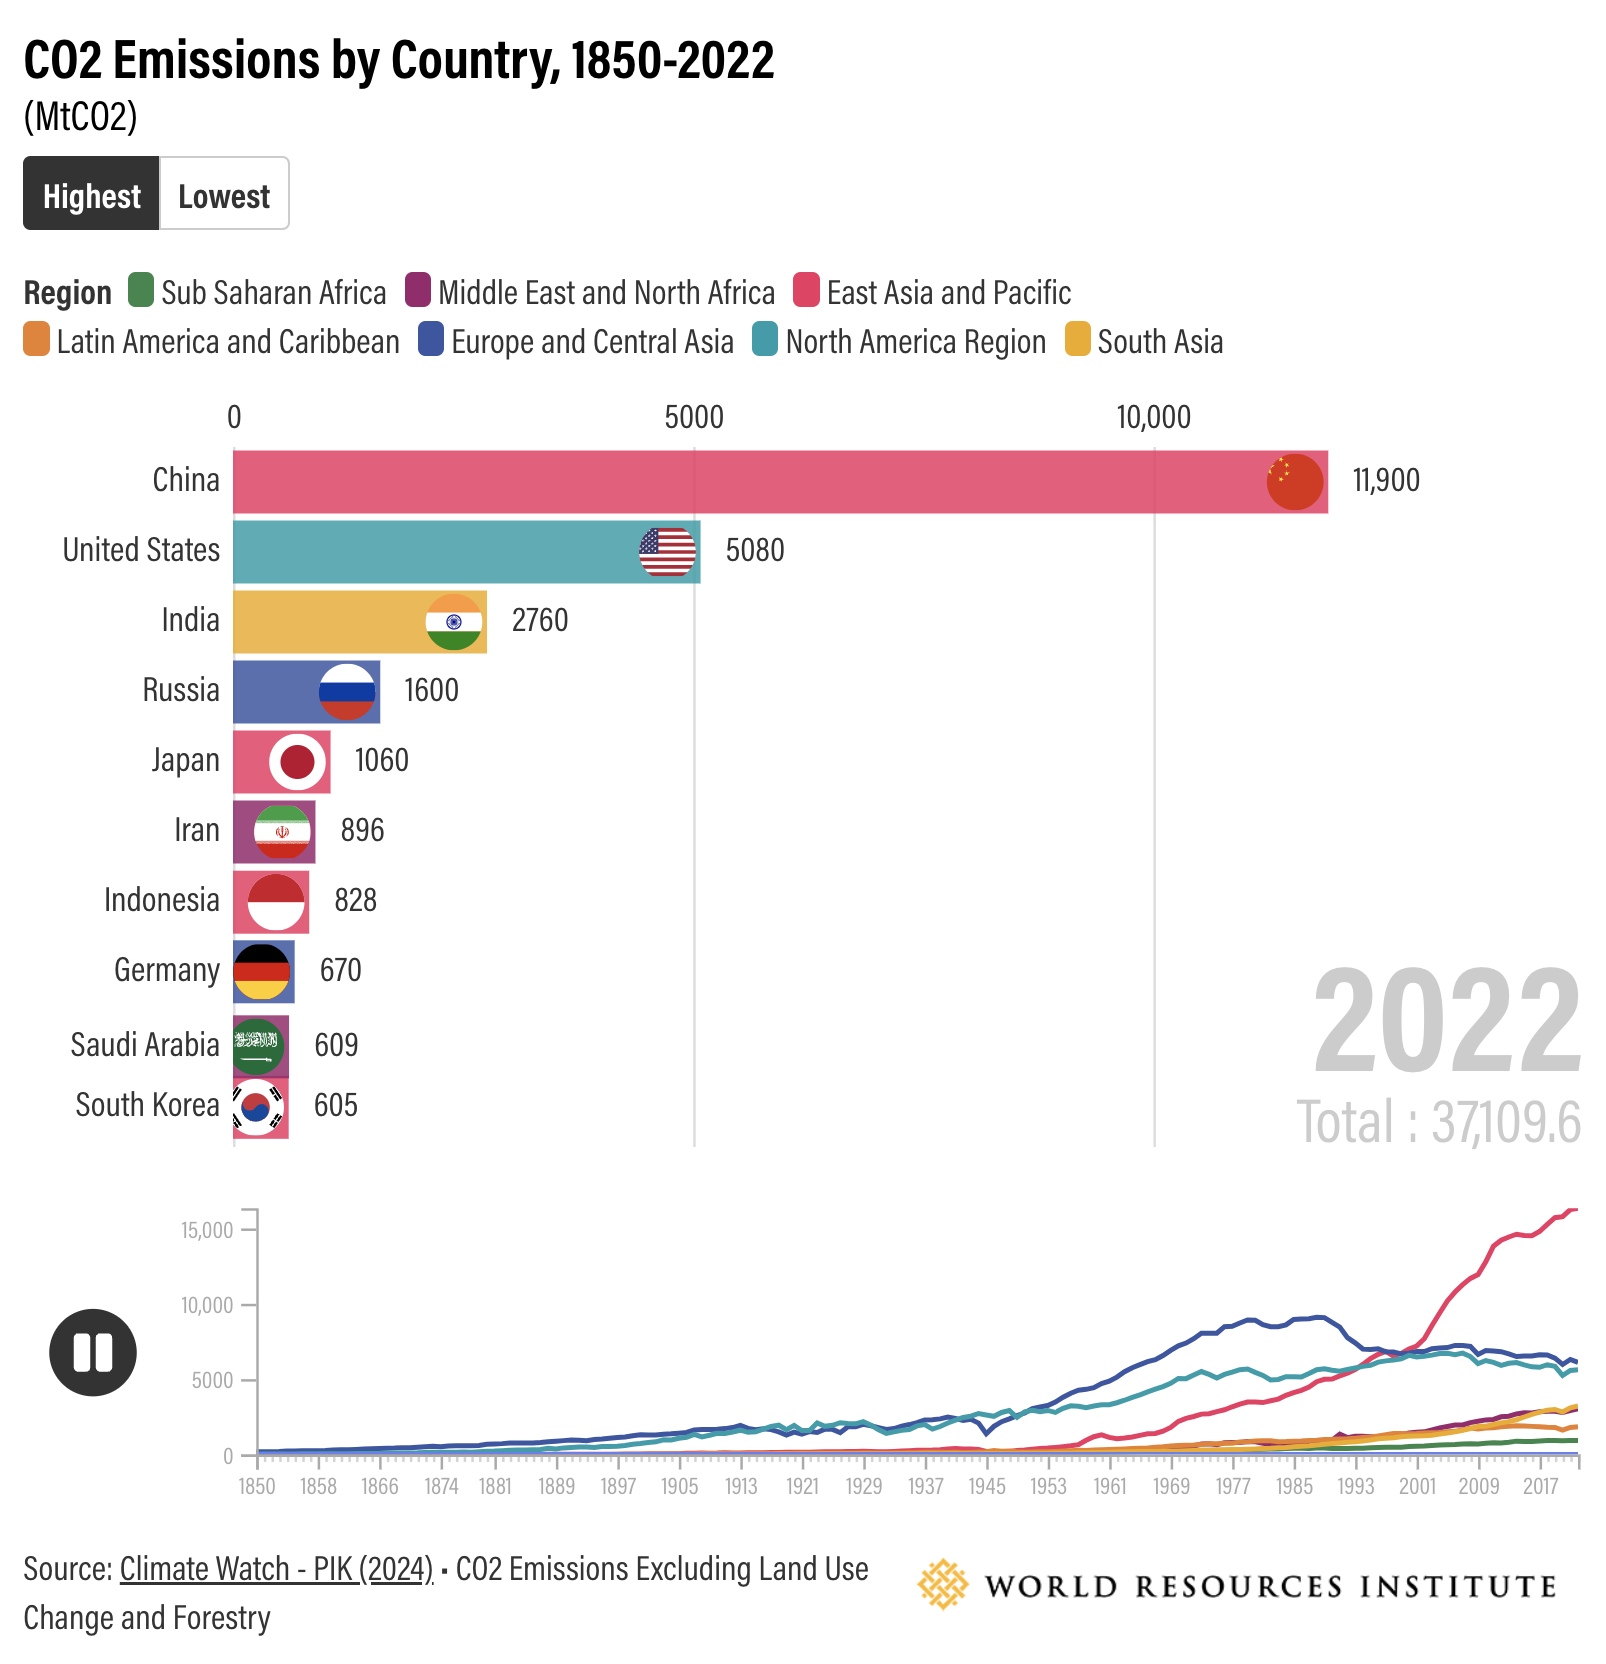
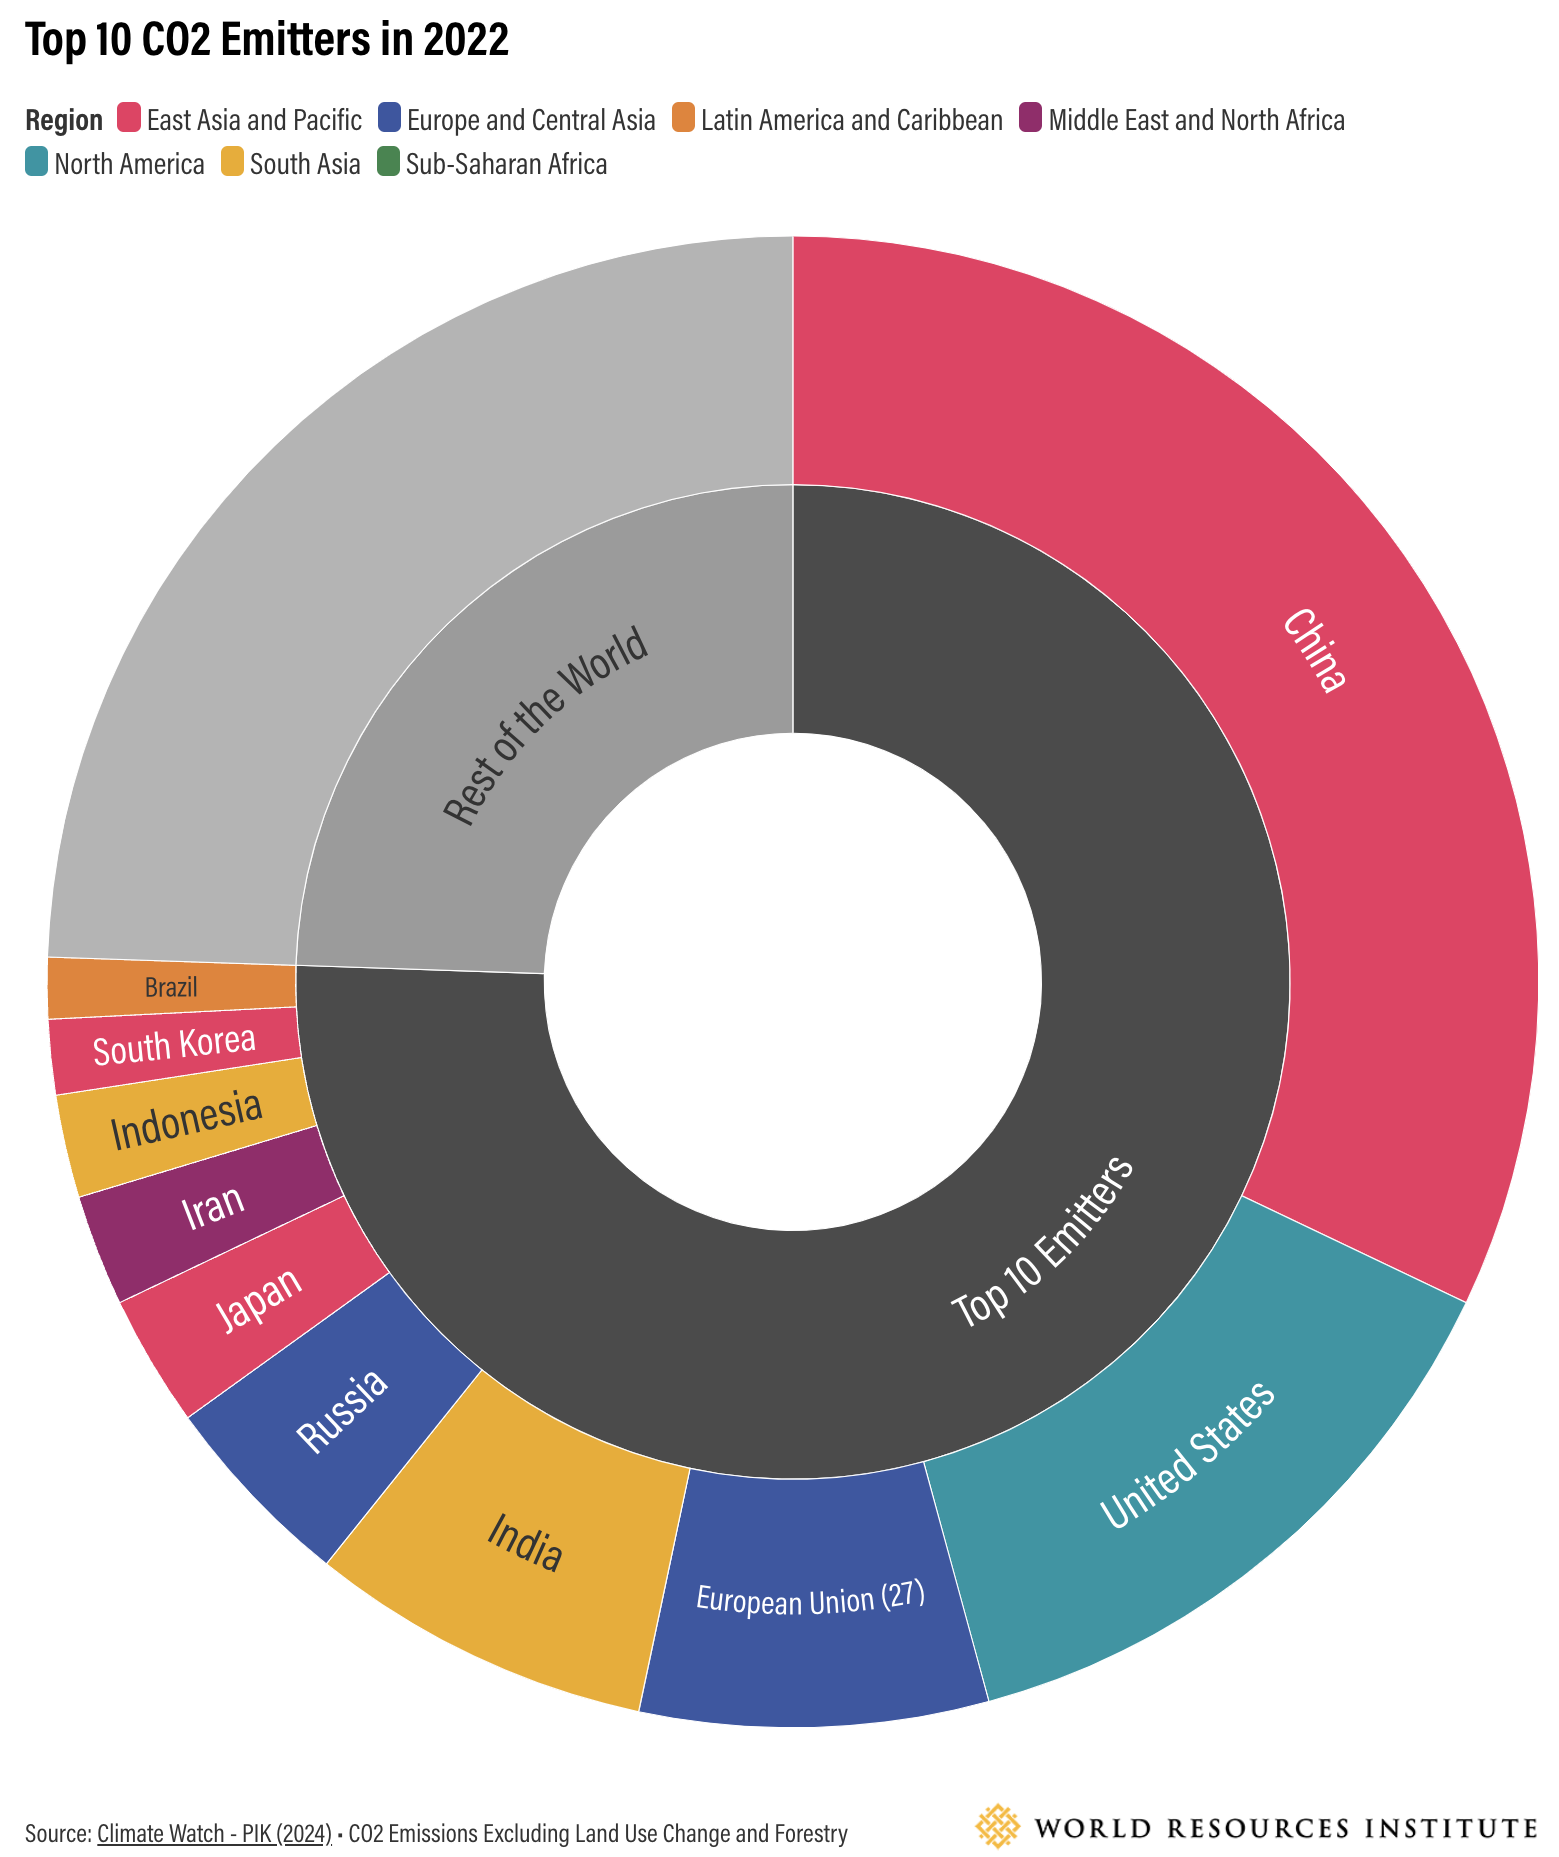
As of 2022 — the latest data available — China ranked as the world’s largest CO2 emitter, followed by the United States, India, Russia and Japan. However, among the top 10 CO2 emitters, the United States has the highest emission per person. Per capita emissions in the U.S. are double those of China and 8 times those of India.
See How the Top Emitting Countries and Regions Have Shifted Over Time
Most countries have seen their carbon emissions balloon over time as their populations and economies have grown. However, these trajectories look quite different throughout different moments in history. Read on for a visual recap of some national, regional and global CO2 emissions milestones over the past 172 years.
From 1850 to the mid-20th century, the world experienced near-constant growth in emissions. This was due largely to industrialization and population growth in the United States and Europe. The U.S. became the top CO2 emitter in 1887 and saw the greatest acceleration in emissions over the next nine decades, followed by the United Kingdom and Germany.
This trend was occasionally interrupted by historic events, like the Great Depression in the 1930s and the end of World War II in 1945. But the resulting emissions reductions were only temporary. Countries in North America and Europe continued to dominate global emissions through the first half of the century. As a result, the U.S. and EU remain the largest cumulative emitters to date, bearing responsibility for most CO2 in the atmosphere.
From the 1950s to 1980s, Russia also experienced rapid emissions growth. However, its emissions dropped off significantly with the dissolution of the Soviet Union.
For comparison, the U.K., once the world’s highest emitter, stabilized its total CO2 emissions around 1970.
While the United States kept its place as the top CO2 emitter throughout the 20th century, Asian countries began to emerge onto the scene, led by China.
Since then, China’s economy has continued to expand rapidly — along with its consumption of fossil fuels. China surpassed the U.S. as the world’s top CO2 emitter in 2005.
A similar picture emerges when looking at emissions by region. East Asia and the Pacific became the top regional emitter in 2004. By 2022, it was contributing 44% of global CO2 emissions. Europe and Central Asia and North America, the next-highest emitting regions, accounted for 17% and 15% respectively. However, this only represents total annual emissions.
When it comes to per capita emissions, North America, remains the highest by far, followed by Europe and Central Asia. However, East Asia and the Pacific is very close to becoming the second largest per-person emitter.
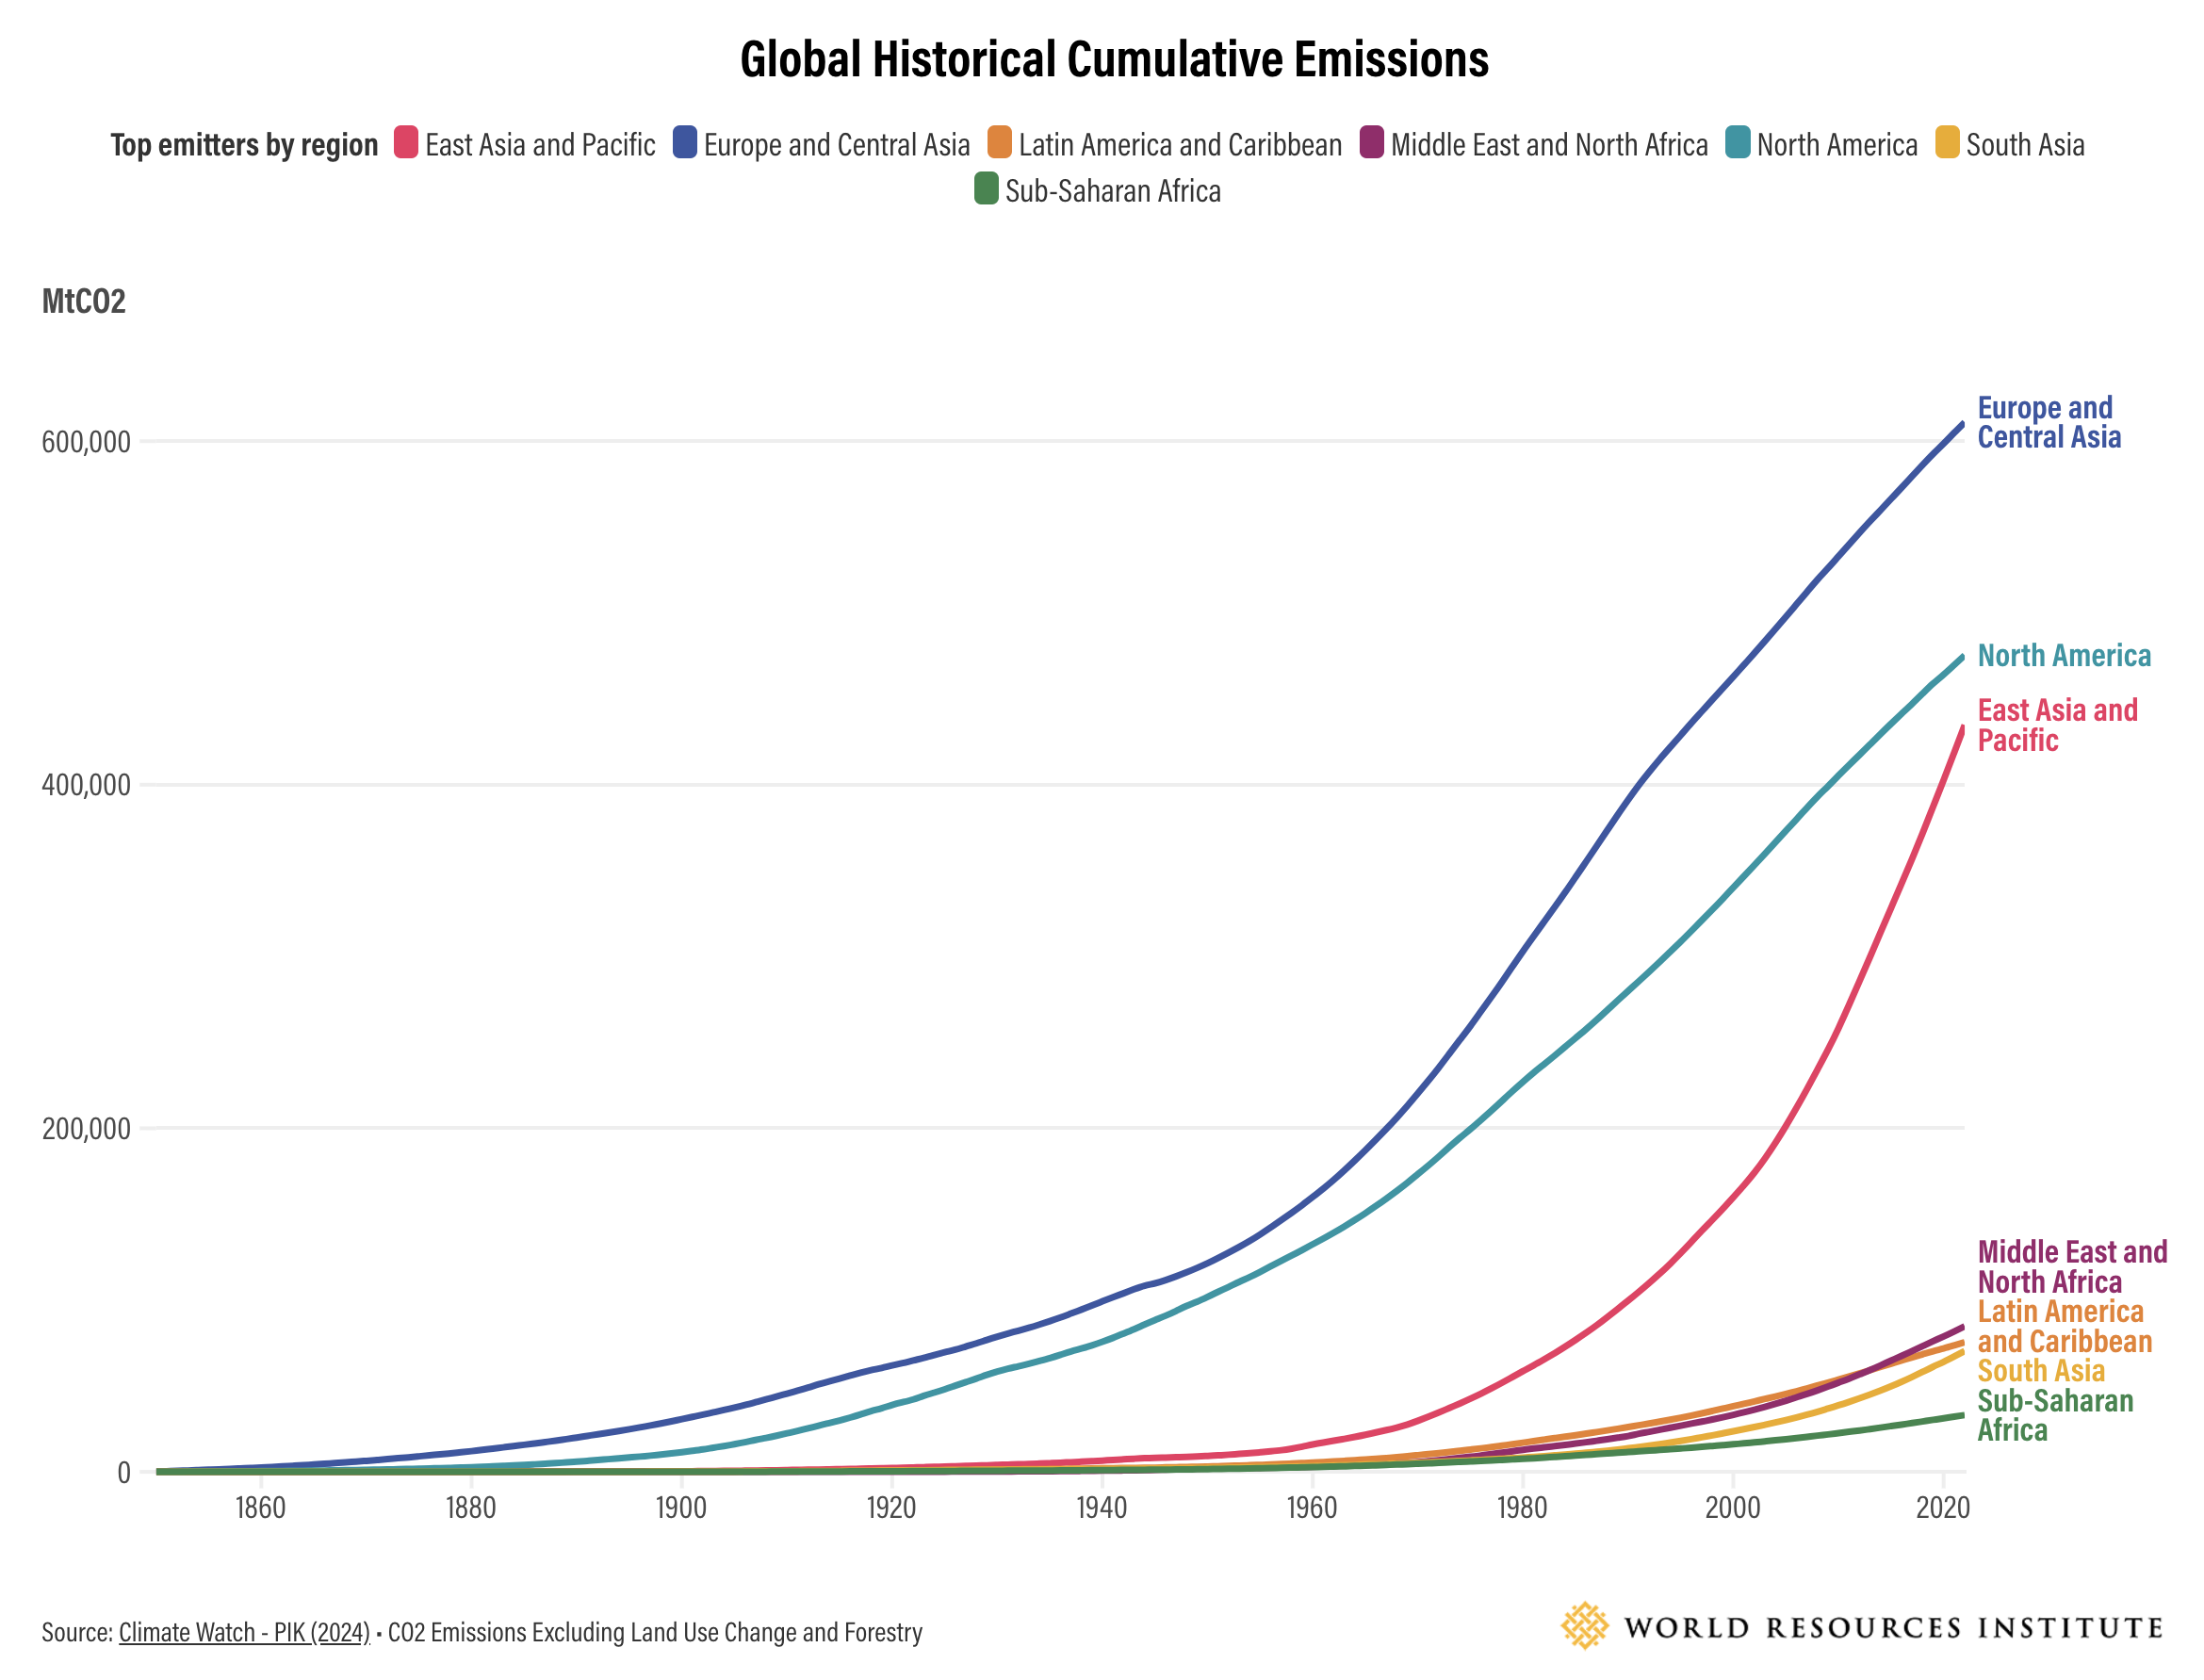
Looking at cumulative emissions since 1850, Europe and Central Asia still have the highest total, followed by North America. But East Asia and the Pacific is rapidly catching up here, too.
Related: 4 Charts Explain Greenhouse Gas Emissions by Country and Sector
COVID-19 Caused a Sharp Decrease in Emissions, but It Was Short Lived
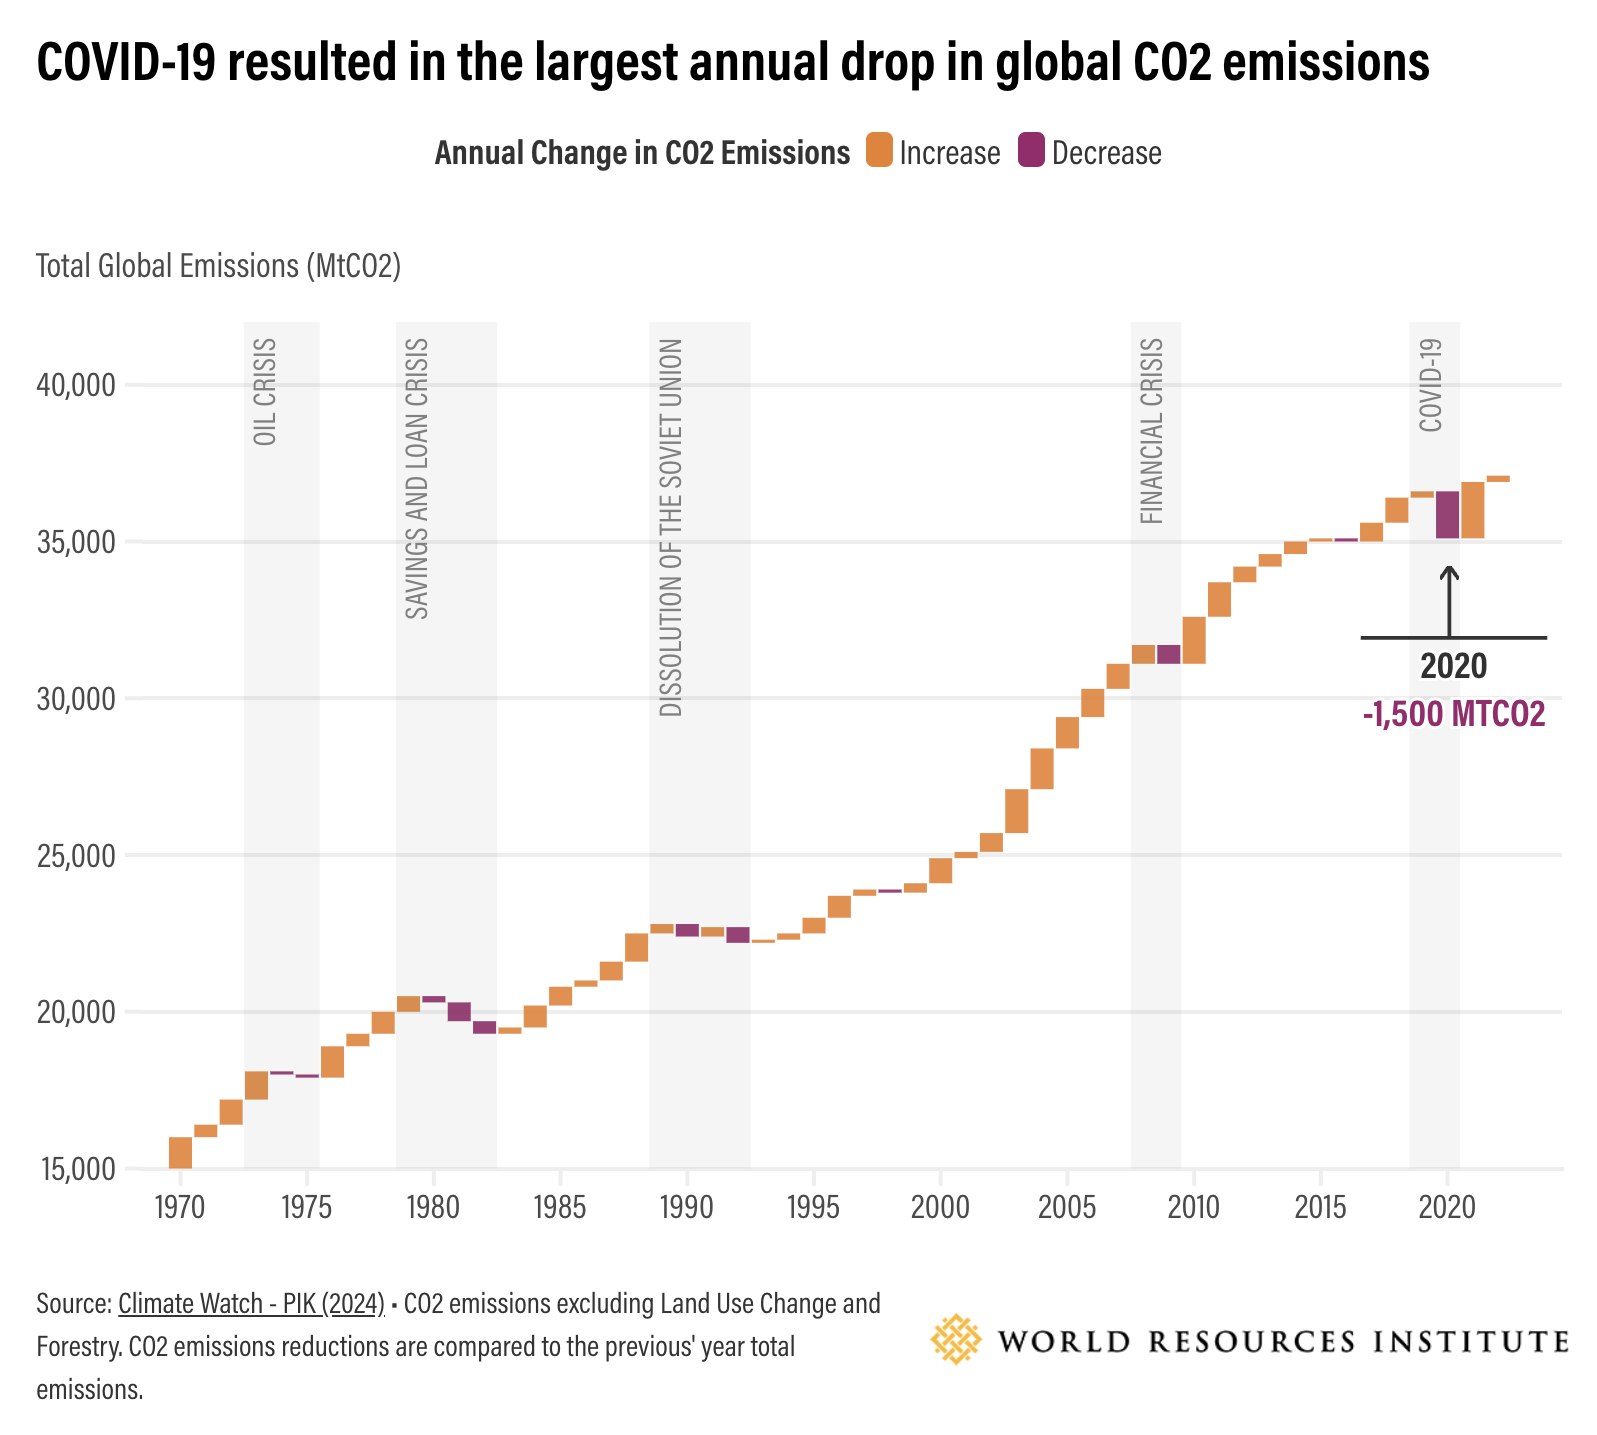
The COVID-19 pandemic had a drastic effect on global economies, resulting in the largest annual drop in CO2 emissions in recorded history. In 2020, global emissions fell by 1.5 billion metric tons of carbon dioxide (GtCO2) — an amount roughly equivalent to Japan’s CO2 emissions that year. This was twice the size of the 1992 drop following the dissolution of the Soviet Union (the second largest emissions drop in recorded history). Nonetheless, it was temporary. Emissions bounced back quickly as countries resumed their economic activities, with 2021 surpassing 2019 levels.
Global Per Capita Emissions Have Stabilized Since 2011
The good news is that, while absolute emissions continue to rise, global per capita emissions have not increased since 2011. This suggests that countries are gradually moving away from the previous carbon-intensive development trajectory as they begin transitioning towards renewable energy, electric vehicles and other clean technologies.
However, there’s a long way still to go. The imperative now is to reverse course on total emissions, which are still growing, to stay on track with global climate commitments to ensure a livable future for all.
The Top 10 Emitters Still Make Up 76% of Global Carbon Emissions
At the beginning of our timeline in 1850, just a small number of countries were responsible for the majority of global emissions. In 2022, the major players have changed, but the top 10 emitters still contribute 76% of global CO2 emissions.
While all countries will need to work together to tackle the climate crisis, this relatively small group of nations carries an outsized share of the responsibility for causing it. These countries need to step up their climate leadership by rapidly reducing emissions and supporting other nations in their transitions towards a lower-carbon economy.
Explore the Latest Carbon Emissions Data
To avoid the worst impacts of climate change, countries need to rapidly reduce emissions to net zero by 2050. Climate data is essential to understanding how we’ve come to be in this state of crisis, the latest emissions trends, and what actions countries must take in both the short and long term to bend the emissions curve downward.
Climate Watch, WRI’s climate data platform, offers hundreds of open datasets that visualize historical greenhouse gas emissions of all countries, regions, sectors and various types of greenhouse gasses. The platform allows users to analyze and compare countries’ nationally determined contributions (NDCs) and long-term Strategies (LTS) under the Paris Agreement; explore climate policies; see how nations can leverage their climate goals to achieve sustainable development objectives; and use models to map new pathways to a lower-carbon, prosperous future.
Editor’s note: This article was originally published in 2014. It was updated in June 2024 with the latest data on global carbon dioxide emissions from Climate Watch.
1 CO2 is not the only greenhouse gas and short-term action on methane and other short-lived pollutants are essential to address climate change. CO2 represents about three-quarters of annual emissions and estimates are available starting from 1850, allowing us to explore a longer history of carbon dioxide emissions.
By Leandro Vigna, Johannes Friedrich, and Thomas Damassa. Article from WRI.
Have a tip for CleanTechnica? Want to advertise? Want to suggest a guest for our CleanTech Talk podcast? Contact us here.
Latest CleanTechnica.TV Videos

CleanTechnica uses affiliate links. See our policy here.


