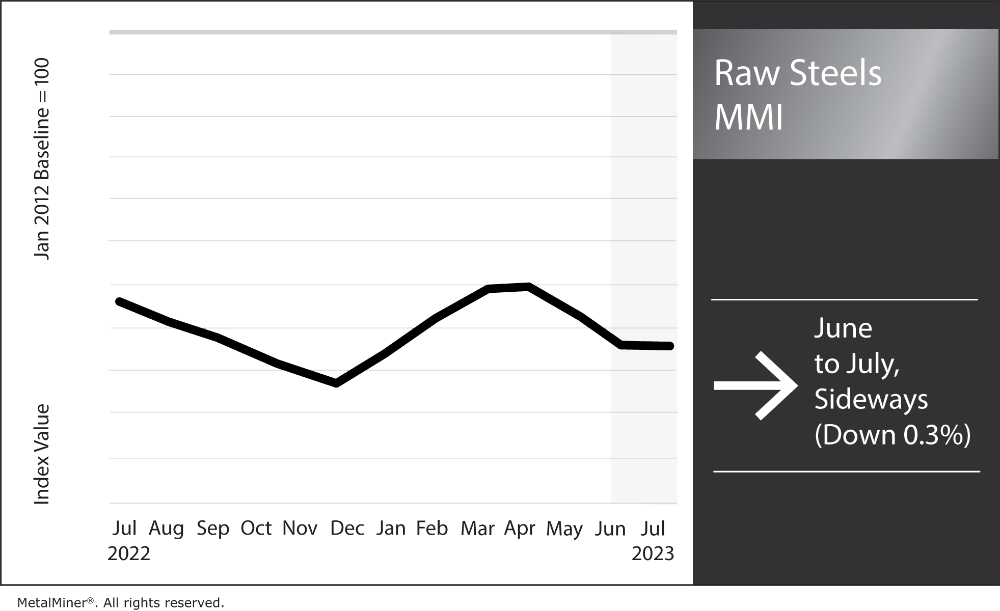
The Raw Steels Monthly Metals Index (MMI) moved sideways, with a modest 0.32% decline from June to July. Flat rolled steel prices appeared decidedly bearish throughout June. HRC prices saw the largest month-over-month decline, dropping nearly 16% before finding a bottom at the start of July. From there, HRC prices saw a modest $1/st increase during the first week, as steel prices started to move sideways. Prices would need to breach monthly resistance levels to suggest a trend shift, but as the market remains in backwardation, downside risks remain.
MetalMiner’s free weekly newsletter provides up-to-date metal price intelligence.

Steel Prices Hit Bottom Amid SDI Outage
Steel prices found a bottom at the close of June, disrupting a more than two-month downtrend. Steelmakers, including Cleveland-Cliffs, Nucor, U.S. Steel, ArcelorMittal, and Stelco, issued a series of price hikes throughout June in an attempt to help prices find a floor. However, markets appeared unmoved by the increases, with HRC, CRC, and HDG prices continuing to slide following the bevy of announcements.
Steelmakers argued that low service center inventories would force hesitant buyers to return to the market despite historically short mill lead times. The average lead time for HRC prices fell to three weeks in mid-June. However, by July, mill lead times for flat rolled steel started to climb again. The unexpected July 1 outage at SDI Sinton tightened supply enough to push the average HRC mill lead time up to 4.5 weeks. Though this is still beneath the historical average* of over five weeks, HRC lead times are now the longest they’ve been since late May.
SDI Sinton’s closure comes at what seems to be an opportune time for steelmakers already plagued by an apparent oversupply. A number of North American automakers started planned maintenance outages at the end of June. These shutdowns will extend through August, which will translate to lower overall steel demand from the sector. his remains a notable downside risk for steel markets, however, as the auto sector has been one of a declining number of industries still supporting overall steel demand while the U.S. manufacturing sector continues to contract. This remains a notable downside risk for steel markets, however. Amid the contraction of U.S. manufacturing, the auto sector has been one of a declining number of industries still supporting overall steel demand. Although SDI Sinton has yet to announce a restart date, the company expects the shutdown to last 2-4 weeks, with production returning by July 30.
*MetalMiner started tracking lead times in December 2018.
Are you under pressure to generate steel cost savings? Make sure you are following these five best practices.
Steel Capacity Utilization Rate Lowest Since April
SDI Sinton’s closure has already caused a sharp decline in the capacity utilization rate for domestic raw steel production. The ramp-ups of several mills (including SDI Sinton, which hit 56% by the end of Q1 and could reach 80% capacity during H2 2023) saw the overall capacity utilization rate reach 78.1%, its highest this year, on June 24. However, by July 8, the rate fell back to 75.2%, the lowest since mid-April.
Still, tighter supply gives steelmakers increased control over the market. This comes as a growing number of U.S. industries continues to see slowdowns in demand. Steelmakers may even attempt to narrow production levels further upon the return of SDI Sinton to prevent prices from returning downward in search of a new bottom. However, for now, the unexpected outage, on top of a modest increase in mill lead times, has proven enough to flatten steel prices in the short term.
Discover what else impacts the U.S. steel market and generate hard savings on your metal buys year-round. Trial MetalMiner’s monthly outlook report.
SDI Lowers Scrap Consumption
At the recent Global Steel Dynamics Forum, Steel Dynamics (SDI) CEO Mark Millett noted the company’s declining use of prime scrap as part of its melt mix. According to Millet, SDI’s Butler and Columbus plants roughly halved prime scrap consumption levels from 60-65% to 30-34%.
While some market participants expressed concern that the increased use of EAF furnaces could lead to a shortage of scrap, that has yet to materialize. At the same forum, Millet stated, “I don’t think there’s going to be a shortage of scrap,” pointing to improved margins as the reason for the decision. Should other steelmakers replicate SDI’s strategy, it could cause the correlation between steel and scrap prices to erode. This, in turn, could affect the use of scrap costs as a leading indicator for U.S. steel prices. Currently, HRC and U.S. No. 1 Prompt Industrial Comp. (#1 Busheling) prices boast a moderately strong 85.05% correlation.
CRU is a popular steel contracting index. But you shouldn’t use it very often. See why!
Biggest Moves for Raw Materials and Steel Prices
- Midwest HRC future prices saw the index’s largest increase, rising 11.82% to $889 per short ton as of July 1.
- Chinese coking coal prices rose 5.11% to $288 per metric ton.
- Chinese HRC prices saw a modest 2.25% increase to $549 per short ton.
- Meanwhile, Chinese slab prices fell 2.11% to $596 per metric ton.
- U.S. shredded scrap prices dropped by 11.99% to $411 per short ton.


