Sign up for daily news updates from CleanTechnica on email. Or follow us on Google News!
California has been a leader in the installation of solar power plants and wind power plants for many years now (despite its recent anti-rooftop solar shift via “Net Metering 3.0”). That has led to more and more of its electricity generation coming from renewables. The trend has been going on for years, but there are a couple of recent developments that should really get people’s attention.
Record Solar Power in California Passes 100% of Power Demand
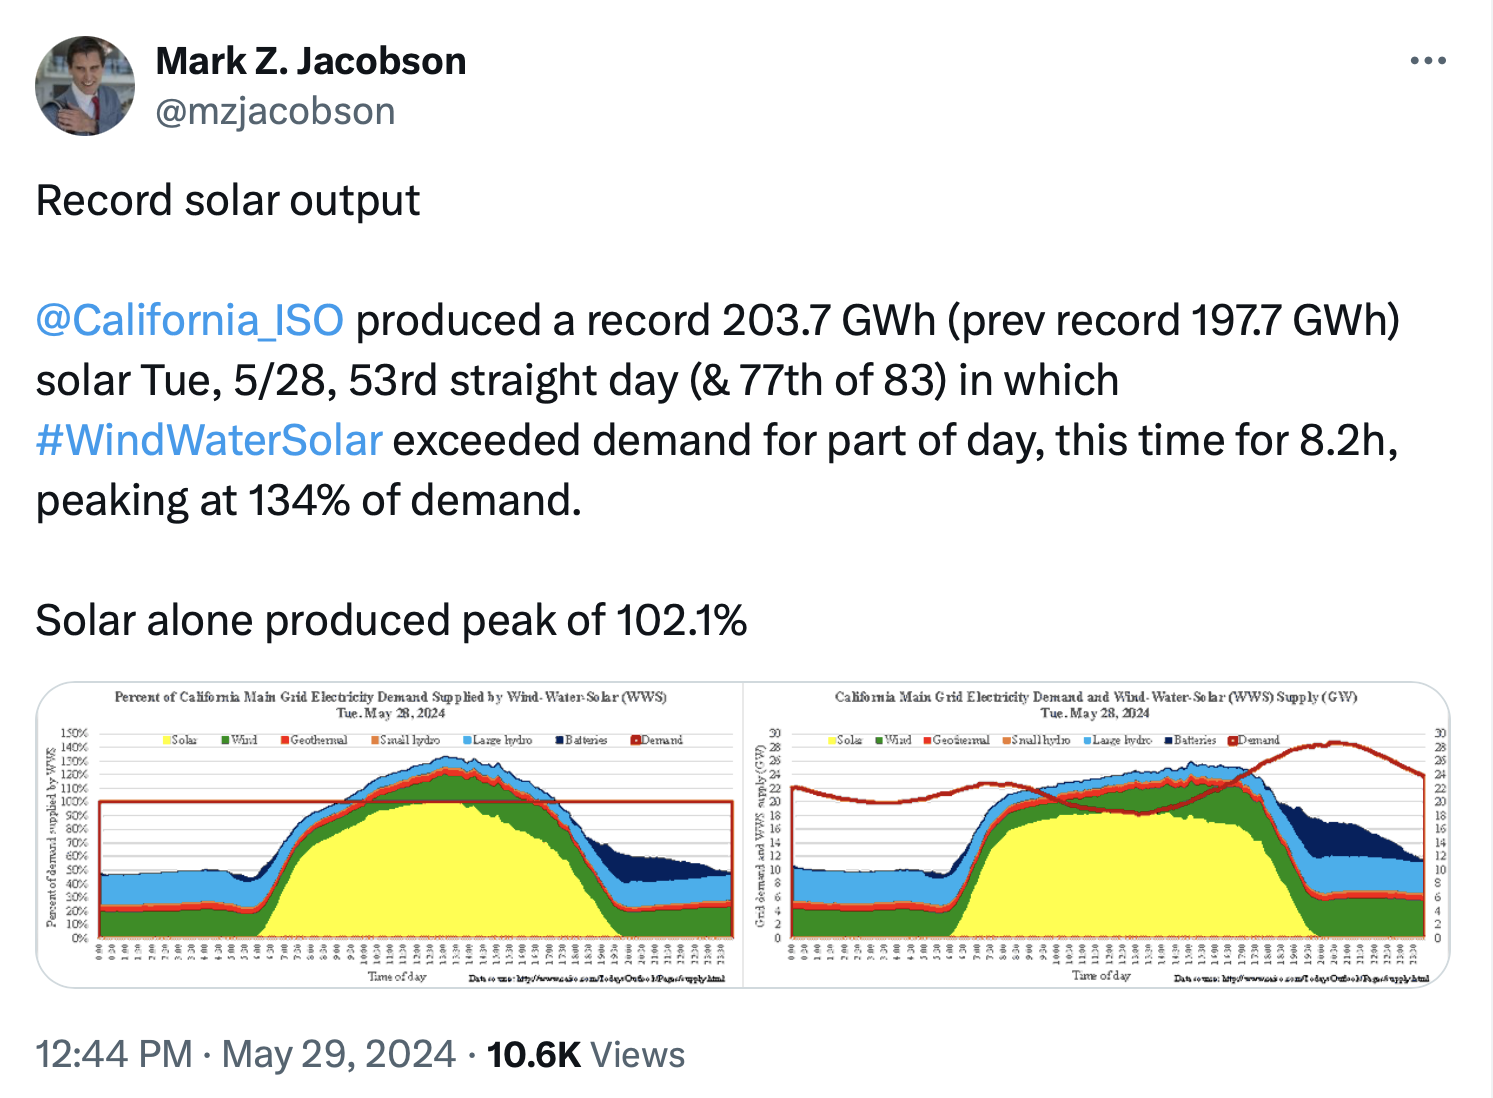
For 56 days in a row, electricity from solar, wind, and water (hydro) power has exceeded 100% of power demand on California’s main grid for part of the day. Also, going back further, that has been achieved in 80 out of the last 86 days. That is since early March (International Women’s Day), late winter.
Repetition turns a hypothesis into a theory.
The theory here is that we can consistently and increasingly supply clean, renewable energy to California’s grid.
For 54 straight days and 78 of 84, #WindWaterSolar supply has exceeded 100% of demand during part of each day. pic.twitter.com/nZxCeE8qCG
— Mark Z. Jacobson (@mzjacobson) May 30, 2024
As part of that, solar power recently hit record output, and it actually surpassed 100% of power demand briefly.
As you can see above, at its peak, solar power was providing 102.1% of electricity demand in California. Together, wind, water, and solar peaked at 134% of electricity demand!
Clearly, California’s progress on renewables is proving pro-renewables advocates right. But what about the infamous “duck curve?”…
California Quickly Solving the Duck Curve
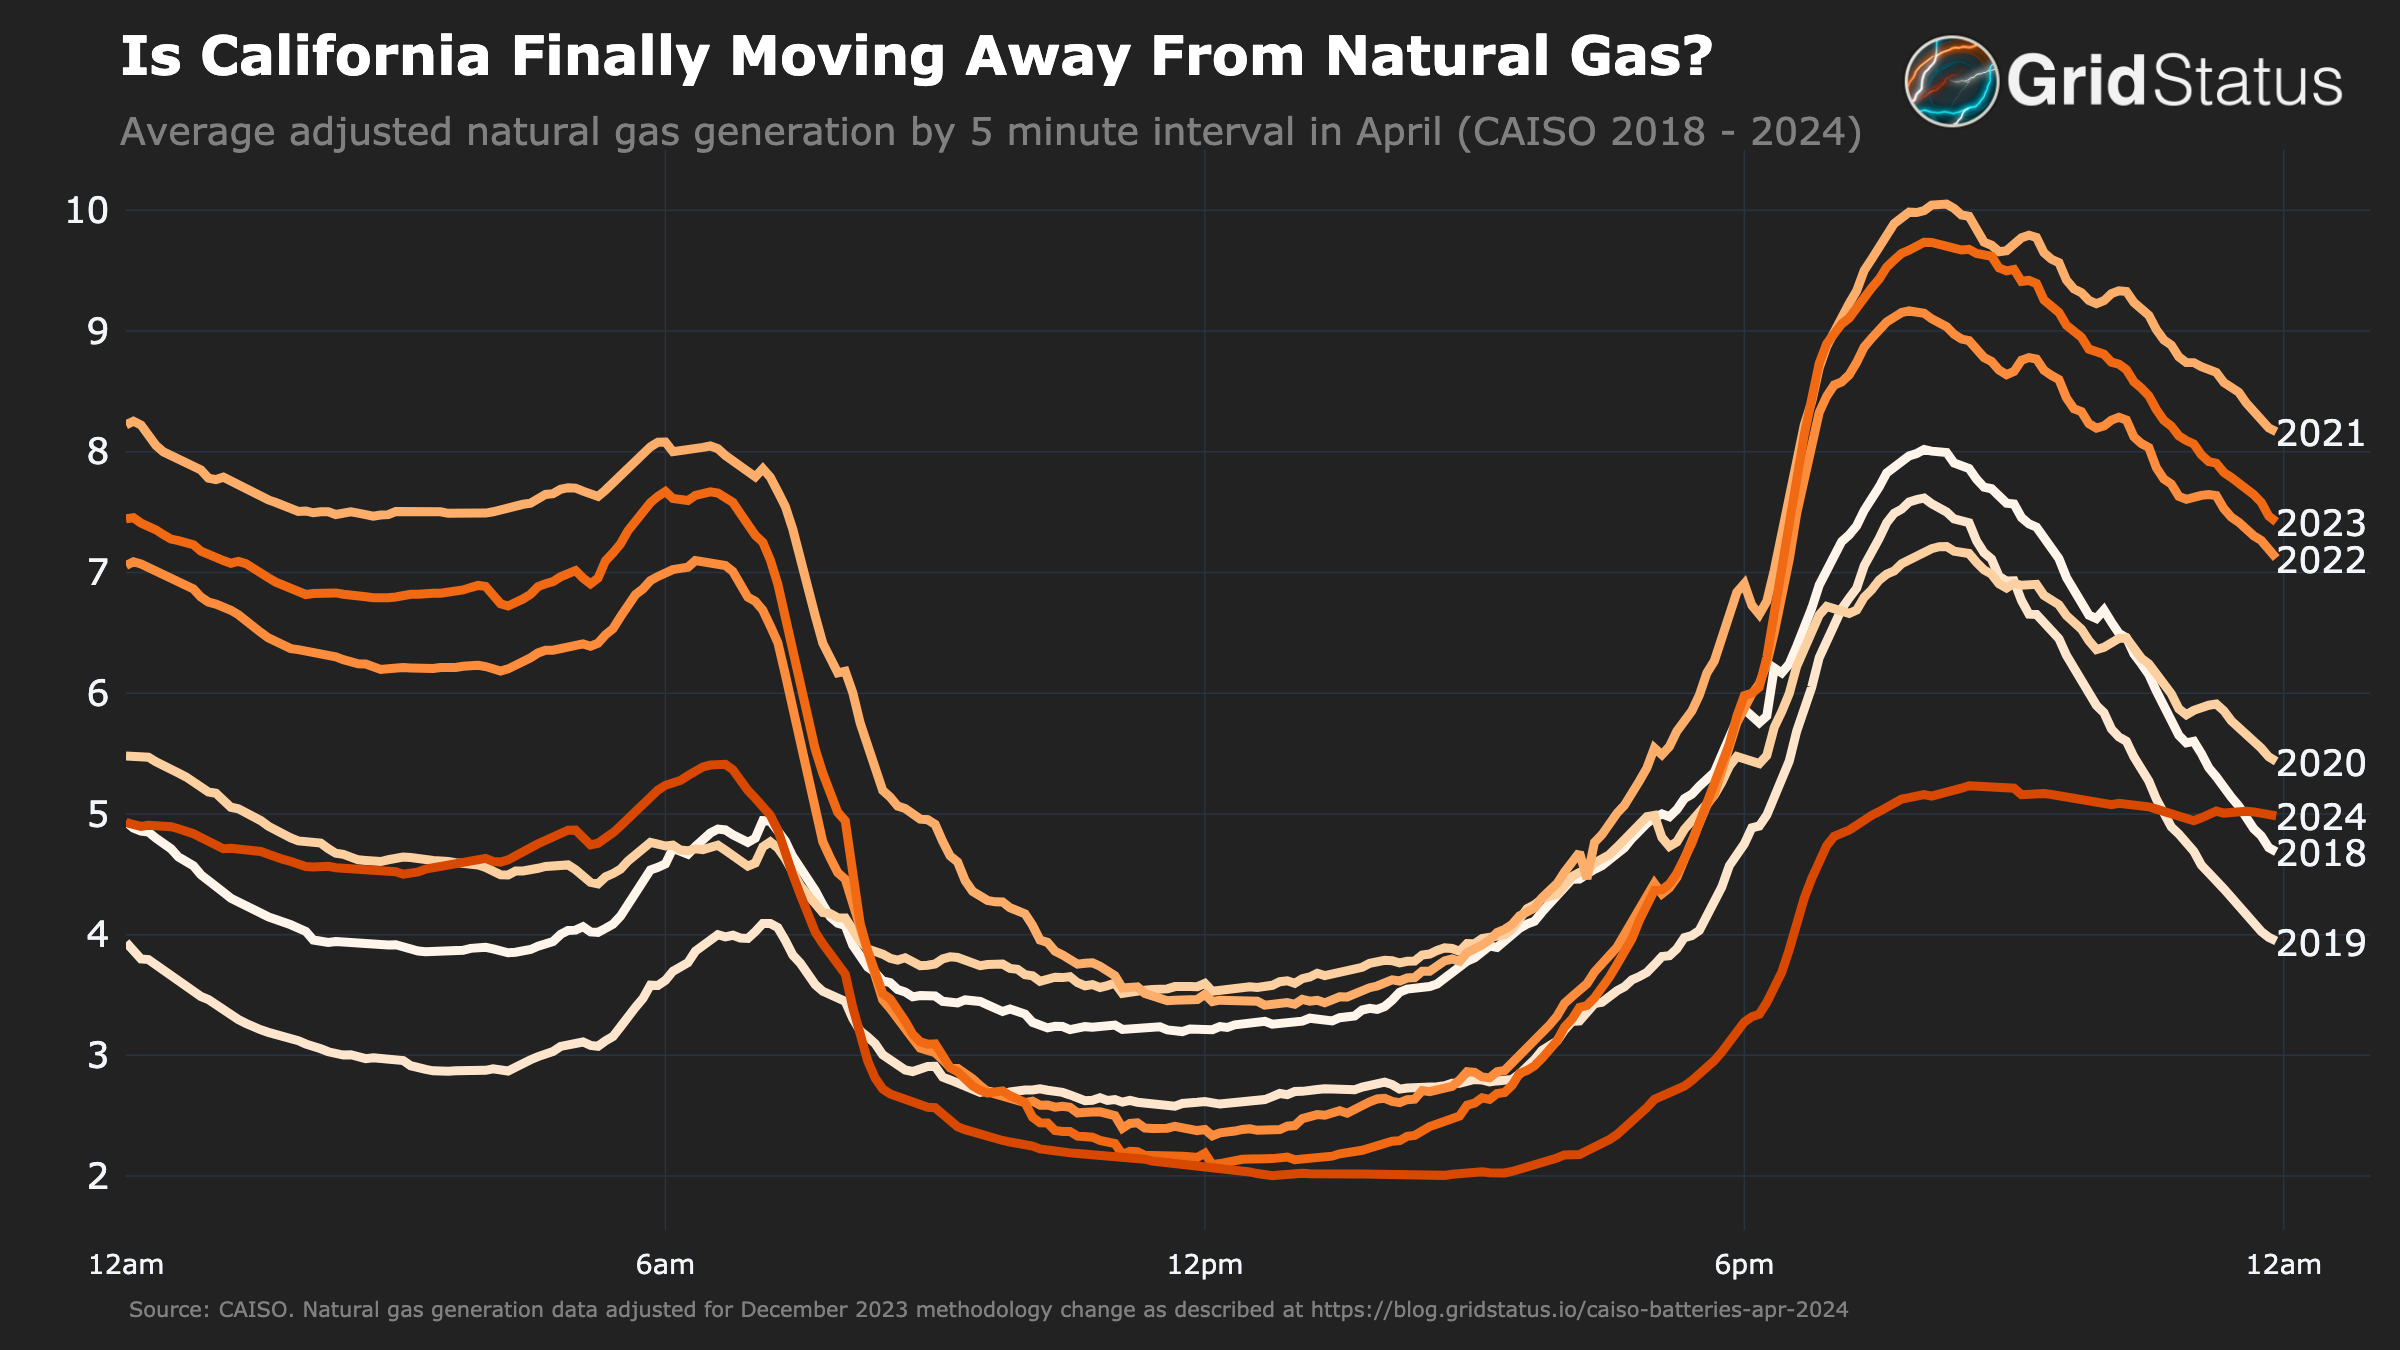
The best news is that California seems to quickly be chopping the duck curve down to size. The duck curve basically comes down to this: “In some energy markets, daily peak demand occurs after sunset, when solar power is no longer available. In locations where a substantial amount of solar electric capacity has been installed, the amount of power that must be generated from sources other than solar or wind displays a rapid increase around sunset and peaks in the mid-evening hours, producing a graph that resembles the silhouette of a duck.”
The solution for the duck curve is clear: energy storage. Store that bursting solar energy produced in the middle of the day and gradually use it in the evening as the sun goes down and electricity demand rises. The good news is that California has been making progress on this very fast! Look at the graph below regarding electricity generation from natural gas and note the line for 2023 versus the line for 2024.
Phase 2)
Solar+wind+batteries replace up to ~90% of fossil electricityBatteries can basically solve problem 1), 2) and 3) for you: that is huge!
They can flatten the “Duck curve” to a razor and it’s already started in California:https://t.co/Va66S1WFqD pic.twitter.com/L33ZA9Jk3i
— AukeHoekstra (@AukeHoekstra) May 25, 2024
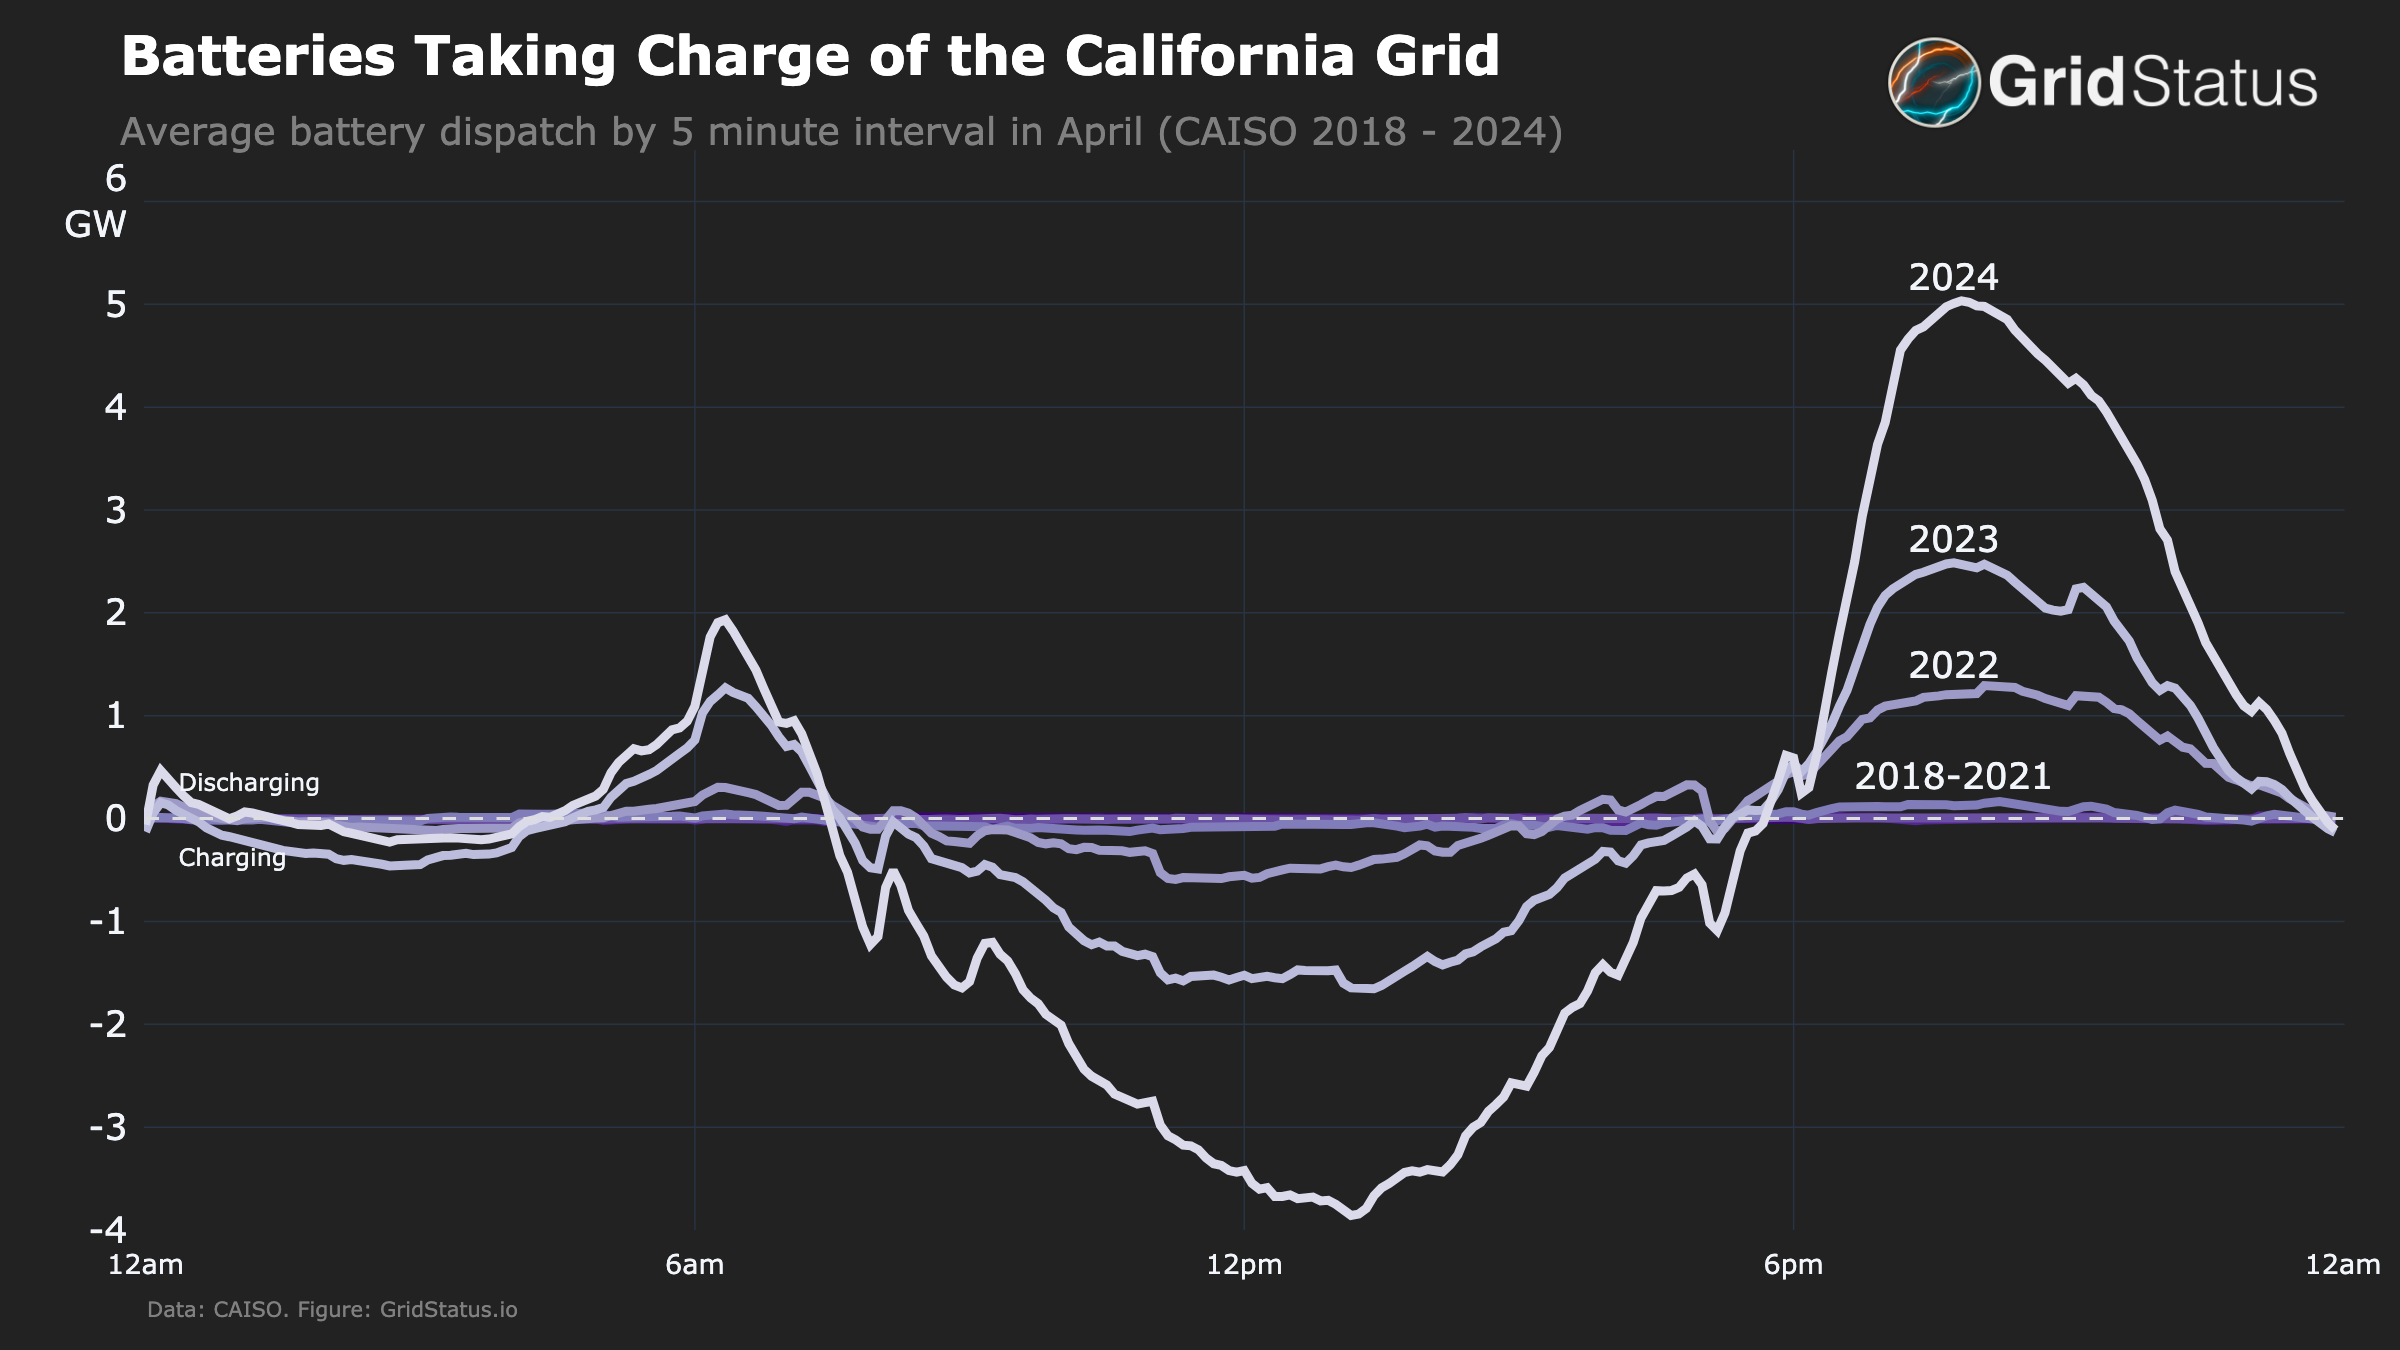
Here’s another one showing battery dispatch on the grid:
Fascinating analysis of the increasingly pivotal role that batteries are playing on the California grid. They are steadily eating away at fossil gas. https://t.co/76AijwBAGr
— David Roberts (@drvolts) May 23, 2024
Indeed — batteries are taking charge and solving California’s duck curve crisis.
It makes me think of the decade-long net metering debate and how much the duck curve was used as an excuse to cut rooftop solar power incentives. Looking at how quickly this duck curve issue has been solved, one has to wonder how disingenuous some of those anti-rooftop solar arguments were. …
The California Electricity Prices Critique
Some people love to counter any positive news about California renewable energy progress by bringing up California’s relatively high electricity prices. This is not from renewables. In fact, research has repeatedly shown that renewable energy drives down electricity prices. There are other things that have resulted in high electricity prices in California. Mark Z. Jacobson summarizes (text modification to spell out words):
“California electricity prices are high because California has the 3rd-highest fossil gas prices in US; & utilities have passed on to customers costs of San Bruno+Aliso Canyon gas disasters, retrofitting gas pipes, wildfires from transmission sparks, undergrounding lines, and keeping Diablo Canyon nuclear open.”
CA electricity prices are high b/c CA has the 3rd-highest fossil gas prices in US; & utilities have passed on to customers costs of San Bruno+Aliso Canyon gas disasters, retrofitting gas pipes, wildfires from transmission sparks, undergrounding lines, and keeping DC nuclear open https://t.co/0Il7fmosw9
— Mark Z. Jacobson (@mzjacobson) June 1, 2024
California Renewable Energy Leading the Way
The overall story is that California renewable energy continues to lead the way forward. Solar power is now peaking at more than 100% of electricity demand, renewables as a whole are peaking at 134% electricity demand, the duck curve has been shaved down to basically no duck curve at all (but you could now call the battery charge/discharge curve a duck curve), and the whole state (and world) is benefitting.
Get ready for more records in the days to come. We’re still a few weeks away from the summer solstice.
Have a tip for CleanTechnica? Want to advertise? Want to suggest a guest for our CleanTech Talk podcast? Contact us here.
Latest CleanTechnica.TV Videos
CleanTechnica uses affiliate links. See our policy here.


