Sign up for daily news updates from CleanTechnica on email. Or follow us on Google News!
In this introduction blog for SACE’s latest edition of our “Solar in the Southeast” report series, you can read up on which utilities and states can expect to see solar growth. Additional blogs in this series will unpack more of the results, observations, and key policy developments detailed in the report.
Now that it’s summer, it’s time to shine a light on solar progress in the Southeast. In SACE’s latest edition of our “Solar in the Southeast” report series, you can read up on which utilities and states can expect to see solar growth. Overall, the Southeast can now claim about 22 gigawatts (GW) of solar (22,183 megawatts, MW) on a full-year operational equivalent basis, or an average solar ratio of 665 watts per customer in 2023. The Southeast is projected to nearly double the amount of solar in the region to almost 44 GW for 2027. We also detail how key policy developments such as recent utility resource plans and the influx of federal funding from the Inflation Reduction Act (IRA) to Southeastern states help inform and grow the solar market.

REGISTER FOR THE REPORT WEBINAR ON JULY 16
How do we track solar progress for different states and utilities?
We start by looking at the overall amount of solar measured in megawatts (MW) of capacity that are operating or planned in a state or utility. Solar projects can be categorized as either utility-scale solar or distributed solar. Distributed solar is smaller and is typically installed on the rooftops of residential or commercial customers, while utility-scale solar is larger and is installed in ground-mounted arrays owned by a utility or a developer.
Utility-scale solar capacity figures include both projects that have been reported to federal data collectors, as well as the aggregate capacity of future solar resources in a utility’s integrated resource plan (IRP) that have yet to be sited at a specific location. In both cases, the utilities may purchase power from a solar developer to receive the solar project’s output for a 20–30-year period instead of owning it outright, but the capacity itself is still attributed to the utility for that time period.
Distributed solar is interconnected to the utility in a variety of different program stylings, such as net-metered solar, virtual solar, and tariffed solar, which are included in all of our figures.

Altogether, the Southeast is able to claim more than 22 gigawatts (GW) of solar (22,183 MW) as of 2023. In order to compare hundreds of different utilities in the Southeast, SACE ranks utilities on the basis of solar watts per customer (W/C). This illustrates the overall amount of solar power sourced to a utility or state relative to the number of that specific utility’s retail customers. To use 2023 as an example, the Southeast regional average would equate to an average solar ratio of 665 watts per customer for the region’s 33 million customers served by electric utilities. That measurement is for the entire region, and every utility within the region in turn has its own metric that may be higher or lower than the regional number.
The latest figures show solar growth despite some unrealized potential
Overall, the Southeast is projected to nearly double the amount of solar to almost 44 GW over the next four years, rising to 1,350 watts per customer in 2027. In general, utilities across the Southeast have made larger capacity deployments in shorter time frames than ever. As an example, Florida Power & Light deployed approximately a gigawatt of solar capacity in 2023. This is a trend that can only continue to improve with stronger planning processes for utility resources and transmission.
Yet, there is still some unrealized potential in recent utility resource plans and regulatory approvals. For example, Georgia Power ranks above the regional average in watts per customer (W/C) at 1,168 W/C in 2023 despite its latest resource plan, and not because of it. Georgia Power unexpectedly filed an updated IRP in 2023 outside the regular schedule due to unanticipated load growth, but instead of adding any incremental solar in the near-term, it has instead pushed for more fossil gas. Likewise, even though Alabama Power has received approval to build 2,400 MW of additional renewable energy generation by 2029, a prior approval of 400 MW went largely unused for most of its timeframe before being extended, meaning Alabama Power did not end up siting most of the solar that was approved.
There are also some utilities that are currently undergoing resource planning process, or expected to start soon: Duke’s utilities in the Carolinas filed an update to their resource plan in January 2024 that unfortunately does not allow new incremental solar before 2028; and the Tennessee Valley Authority (TVA) was set to release its IRP in March, but that has now been delayed to the fall of 2024. However, both of these resource plans would be unlikely to be reflected in the near-term forecast that is the focus of this report.
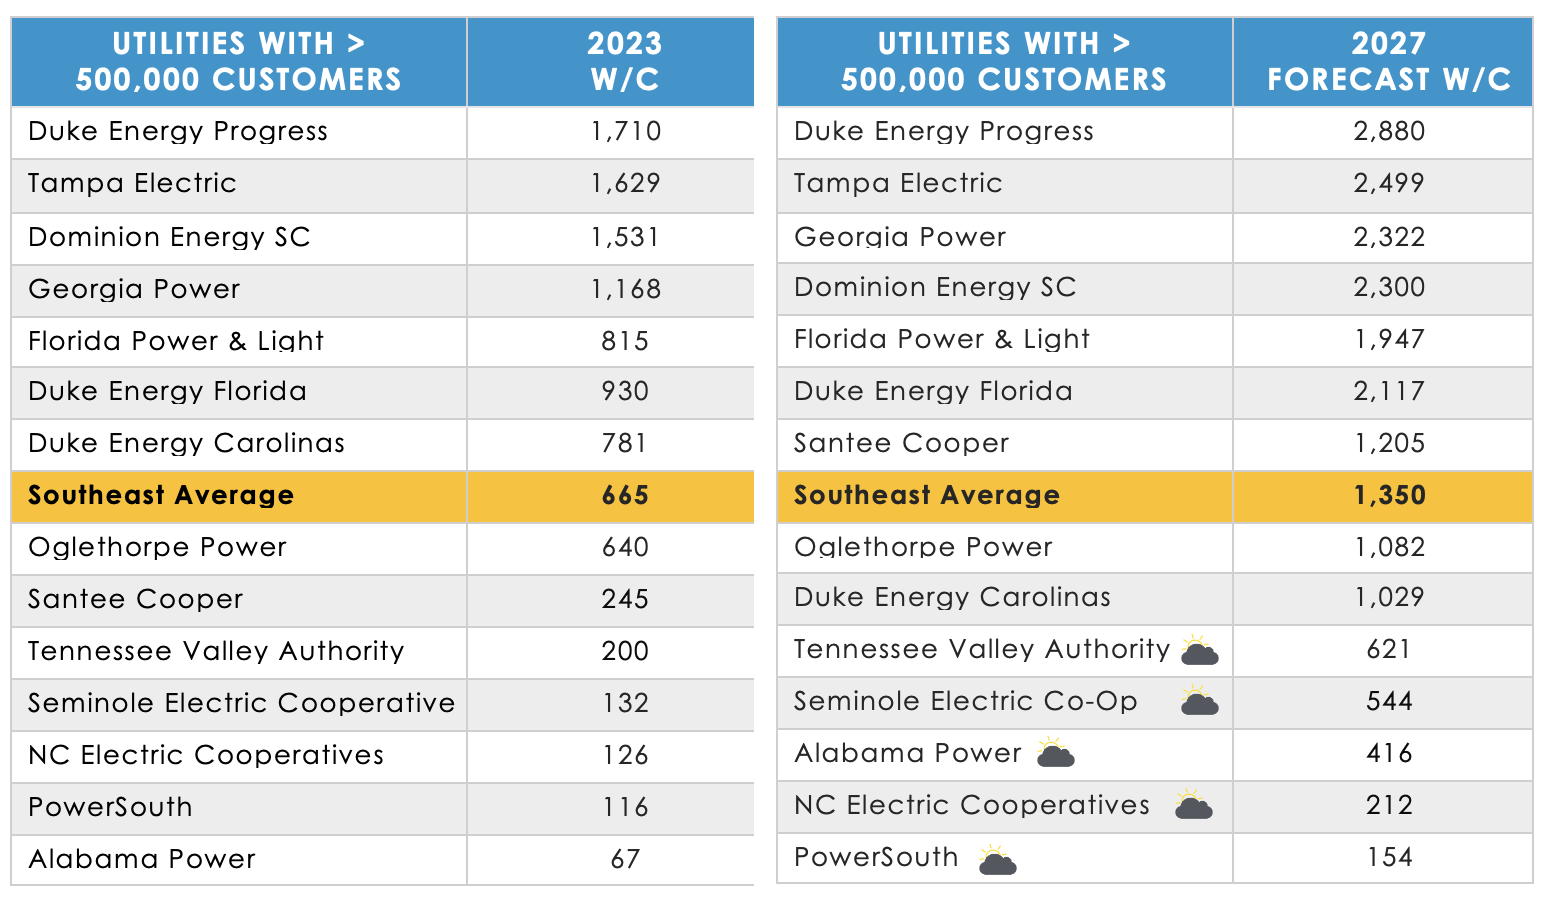
This year’s report reflects several SunBlockers: utilities whose four-year forecast remains below last year’s regional average. The Tennessee Valley Authority (TVA) unfortunately fell just short of the benchmark needed to avoid making the this year. And despite a promising increase from new solar capacity expected to provide power to the grid, Alabama Power has yet to make it off the SunBlocker list. The North Carolina Electric Cooperatives, Seminole Electric, and PowerSouth are all at the bottom of the list this year.
However, there is hope for utilities that are on the SunBlocker list. Many provisions of the Inflation Reduction Act (IRA) are aimed at providing certainty to developers and expanding financing options for non-traditional utilities, such as direct pay of the ITC (Investment Tax Credit) and PTC (Production Tax Credit) as well as the New ERA (Empowering Rural America) funding. So utility resource plans and other solar pro,rams offered by states or utilities still have unrealized potential they should consider cashing in on.
In subsequent blogs we we will unpack the utility rankings and watts per customer forecast for major utility systems further. Additionally, we will explore the SunRisers from this year’s report, the utilities exhibiting the highest total increase in W/C solar ratio between the baseline year (2023) and the four-year forecast (2027). Stay tuned for more!
Courtesy of Heather Pohnan and Bryan Jacob, Southern Alliance for Clean Energy
Have a tip for CleanTechnica? Want to advertise? Want to suggest a guest for our CleanTech Talk podcast? Contact us here.
Latest CleanTechnica.TV Videos

CleanTechnica uses affiliate links. See our policy here.
CleanTechnica’s Comment Policy


