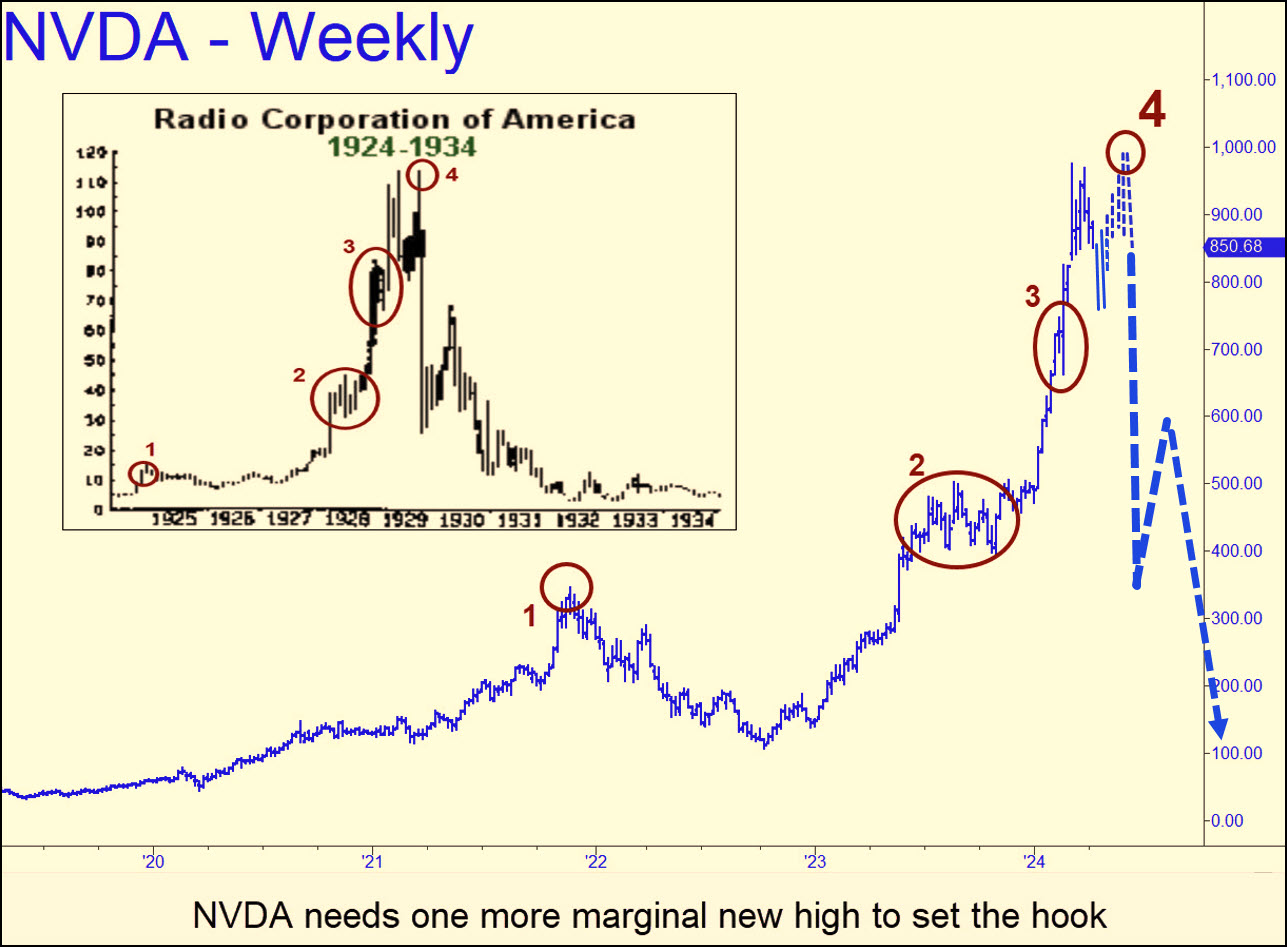
The chart above shows RCA’s spectacular climb to the Mother of All Tops in 1929. The larger chart that frames it shows what Nvidia shares would have to do to replicate the peaks and troughs that set up RCA’s plunge into hell. Notice that the stock’s final top (#4) was just marginally higher than one recorded six months earlier. NVDA’s chart would look nearly identical if the stock were to hit 1000 in May. It got a potential running start on this with last week’s 120-point leap to 877.35.
Nvidia is the dominant supplier of hardware and software for AI and makes a good comparison with RCA. The latter had a commanding position in one of the hottest games in town, home entertainment. The company’s console radios and record players provided a big step up from the days when a spinet piano in the parlor was the main source of music in the home.
How Hot Is Nvidia?
So how hot is Nvidia? Two months ago, it became the third company in U.S. history to achieve a $2 trillion valuation. Moreover, it reached that benchmark just 180 days after hitting the $1 trillion mark. That compares with 500 days for the two biggest companies, Apple and Microsoft. Nvidia is also regarded as one of the most exciting places to work in Silicon Valley at a time when many firms have been downsizing. Half of the firm’s workers reportedly made more than $228,000 last year.
The company’s hold on investors’ imagination of the future has produced a buying mania in the stock that is every bit as heated as the one that occurred in RCA nearly a century ago. Will their charts ultimately coincide, implying a bloodbath ahead? Quite possibly not, especially if the coincident charts become too widely observed in the weeks ahead. Even so, if a push above $1000 generates enough bullish hubris, that would be reason enough to take the similarities between the two charts seriously.
*********


