Sign up for daily news updates from CleanTechnica on email. Or follow us on Google News!
At 140 terawatt hours, more renewable electricity was generated in Germany in the first half of 2024 than ever before, accounting for 65% of net public electricity generation. Generation from fossil fuels continues to decline as do the electricity prices on the exchange. These are the findings of the half-year data on net public electricity generation presented today by the Fraunhofer Institute for Solar Energy Systems ISE. The analysis is based on the data platform energy-charts.info.
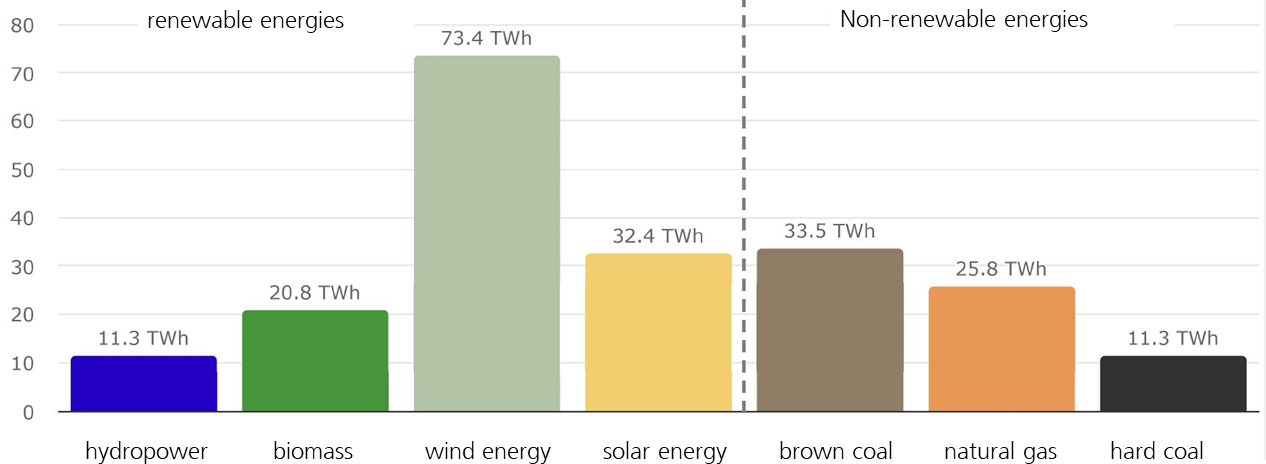
Wind energy was once again the biggest source of electricity by far with 73.4 terawatt hours (TWh), compared to 66.8 TWh in the first half of 2023. The share of net public electricity generation from wind was 34.1%, with 59.5 TWh being generated onshore and 13.8 TWh offshore. Photovoltaic systems fed 32.4 TWh into the grid, an increase of 15 percent compared to the first half of the previous year (28.2 TWh). The half-year values of electricity generation from hydropower rose from 8.9 TWh in 2023 to 11.3 TWh in 2024, while biomass fell slightly from 21.6 TWh to 20.8 TWh. In all, a total of 140 TWh was generated from renewable sources, setting a new record. In the first half of 2024 the renewable share in the load (i.e., the sum of electricity consumption and grid losses) amounted to 60%, an increase from 55.7% in the first half of 2023.
Share of Electricity Generated by Fossil Fuels at All-Time Low
Total electricity production amounted to 215 TWh in the first half of 2024, compared to 222 TWh in the same period in 2023. The share of fossil fuels in the energy mix continued to fall, dropping from 39.6% to 35.0%. At 75 TWh, less electricity was generated from coal, natural gas, oil and non-renewable waste than ever before. Since 2015, electricity generation from renewable sources has risen by 56%, while generation from fossil sources has fallen by 46%.
The load amounted to 233 TWh in the first half of the year, an increase of 1.8% compared to the same period of the previous year (229 TWh).
Import and Export in First Half-Year
In the first half of 2024, Germany had on balance a net import surplus of 11.3 TWh compared to a net export surplus of 0.8 TWh electricity during the same period in 2023. Electricity imports came from Scandinavia (Denmark, Sweden and Norway), France, Switzerland, Belgium and the Netherlands. Due to the favorable electricity prices of wind and hydropower in Scandinavia, electricity imports were cheaper than electricity from German coal and gas-fired power plants. Electricity was exported to Austria, the Czech Republic, Luxembourg and Poland.
Prices Fell Sharply
Electricity exchange prices fell sharply from 100.54 EUR/MWh (day-ahead auction, volume-weighted) to 67.94 EUR/MWh. “The effect of falling exchange electricity prices will be reflected in electricity prices for private and industrial end customers eventually,” comments Dr. Bruno Burger, lead scientist for the Energy Charts at Fraunhofer ISE. The price of natural gas also fell sharply from 44.99 EUR/MWh to 29.71 EUR/MWh. Both prices are thus moving closer to the price levels seen in the years before the war in Ukraine. The cost of CO2 emission allowances also fell, from 86.96 to 63.60 euros per ton of CO2.
Expansion of Wind Power Remains Weak
After a record expansion of 15.3 gigawatts (GW) of solar PV capacity in 2023, the growth remains strong in 2024. By the end of May 2024, 6.2 GW of PV were installed in Germany. Planned total expansion for 2024 is 12.5 GW, which would bring the total installed PV capacity to 88.9 GW. On the other hand, the expansion of wind power remains weak and falls far short of the targets for 2024. Only 0.8 GW of new onshore wind capacity was added and 0.2 GW offshore in the first half of 2024, compared to the 2024 expansion targets of 7 GW onshore and 1 GW offshore. In terms of installed wind capacity in watts per inhabitant (W/inhabitant), the State of Brandenburg is leading with 3408 W/inhabitant, followed by Schleswig-Holstein (2928 W/inhabitant) and Saxony-Anhalt (2487 W/inhabitant). Brandenburg also leads in terms of installed solar PV capacity with 2669 W/inhabitant, followed by Mecklenburg-Western Pomerania (2398 W/inhabitant) and Saxony-Anhalt (1988 W/inhabitant).
The expansion of electrical energy storage, an important factor for balancing renewable electricity generation with the load throughout the day, is progressing. In the first half of 2024, storage systems with an output of 1.8 GW and a capacity of 2.5 GWh were connected to the grid. At 9.9 GW, the installed capacity of battery storage is now equal to that of pumped storage. In terms of storage capacity, battery storage is at 14.4 GWh and pumped storage at 40 GWh.
Article from Fraunhofer Institute for Solar Energy Systems ISE.
Have a tip for CleanTechnica? Want to advertise? Want to suggest a guest for our CleanTech Talk podcast? Contact us here.
Latest CleanTechnica.TV Videos

CleanTechnica uses affiliate links. See our policy here.
CleanTechnica’s Comment Policy


 - CleanTechnica")