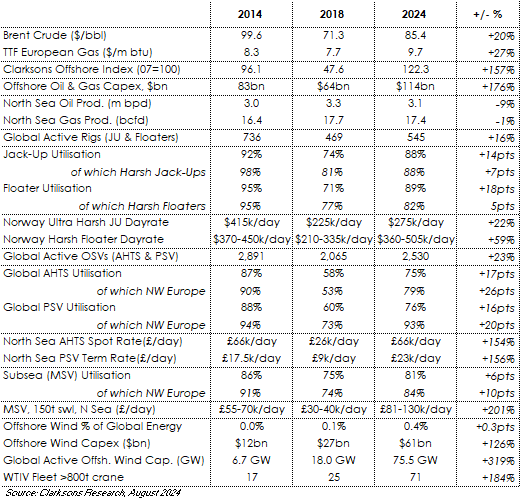
Clarksons Research have produced a review comparing the improving offshore energy markets today against the context of the previous cycles. Reviewing the data points (see below and attached), Steve Gordon, Managing Director of Clarksons Research commented:
2004-14: Boom Years
Since the first ONS in 1974, participants have experienced many dramatic offshore cycles. Arguably, the ten years up to 2014 was a “golden period” for offshore as the industry became increasingly international, subsea and “deepwater” focused. A relatively brief downturn after the financial crisis aside, the Clarksons Offshore Index (rig, OSV and subsea day rates) remained strong reaching a record 114 during ONS 2008 before recovering again to 101 in 2013. Newbuilding investment was most remarkable: between 2004-2014 there were 233 floaters, 367 JUs and 2,855 OSVs ordered (from 2015-2024, there were 7 floaters, 3 JUs and 155 OSVs).
2015-20: Lean Times
In 2H 2014, oil prices corrected as OPEC upped supply to try and drive US shale producers out of business. A sharp reduction in investment offshore followed, just as a wave of newbuilding hit the fleet. The imbalance lasted the rest of the decade, with ONS 2018 perhaps the low point (our Offshore Index was below OPEX levels at 48, less than half of 2014 (see table), rig utilisation was 73%).
2021-24: Record Upturn
Since mid-2021, offshore markets have seen a strong upturn, with improving utilisation and dayrates (see table). Our Index hit a new record in July (122 points, +157% on 2018 low). Though the downturn was severe (plus a Covid set-back), this laid the groundwork for the improvements by developing fleet supply side constraints via removals, ageing fleets, little newbuilding and owner consolidation. Although some recent trends have varied (e.g. some JU rates have eased), the fundamentals seem encouraging: ~$80/bbl oil price, increasing E&P spend (2024(f): 114bn), a record subsea contract backlog ($40bn) and a small newbuild orderbook (CSOV aside).
Energy Transition and Security
Energy security and energy transition are key themes at ONS 2024, with the North Sea often at the forefront of efforts. Emissions from offshore production infrastructure are a focus (~2%* of global CO2 and methane emissions) with initiatives such as selling rather than flaring gas, reducing or eliminating pipeline leakage and installing shore power. Reducing vessel emissions (from 2026 some offshore vessels will be in EU ETS) is supporting retrofitting batteries for peak shaving (195 vessels), and a handful of alternative fuel newbuilds (for the North Sea). Carbon capture projects also continue to make progress (we track 56 offshore projects globally, 28 in North Sea). And there is now 76 GW of offshore wind energy globally (up from 16 GW and 0.1% of global energy supply in 2018). After inflationary challenges it seems that investment appetite and government support for offshore wind is increasing again in the North Sea: we expect growth from 35.1 GW today to 89 GW by 2030. With global energy supply from “offshore” potentially increasing from 16.5% (O&G: 16%, Wind: 0.4%) today to 18.3% (17%, 1.2%) in 2030 there will be lots to discuss at this year’s ONS.
- You can find Clarksons Research at ONS in Hall 2, Stand 2062.

Offshore Intelligence Network provides data and analysis of utilisation, day rates and market supply / demand of the offshore fleet including rigs, OSVs, subsea and floating production.
Clarksons Research are market leaders in the provision of independent data, intelligence and analysis around shipping, trade, offshore and maritime energy transition. Millions of data points are processed and analysed each day to provide trusted and insightful intelligence to thousands of organisations across maritime. Better data for better decisions.
Information Source: Read More
Oil and gas press covers, Energy Monitor, Climate, Renewable, Wind, Biomass, Sustainability, Oil Price, LPG, Solar, Marine, Aviation, Fuel, Hydrogen, Electric ,EV, Gas,


