Price action last week in the charts of three bellwethers suggests that this year’s ‘October surprise’ could arrive right on schedule and that it could be a doozy. The first shows the dollar’s so-far shallow correction off a minor Hidden Pivot rally target. This portends yet more strength, threatening to turn Powell’s tightening regime into a globally ruinous debt deflation. Second, rates on the 30-Year Bond topped at 4.81%, precisely matching the prediction featured here last week. And now let me add this detail: If yields pop above 4.81%, they should be presumed headed for exactly 4.98%, a top that I regard as very unlikely to be surpassed. Interest rates presumably would fall thereafter — for a long, long time — discounting a weakening economy bound for, if not depression, then at least a very severe and prolonged recession.
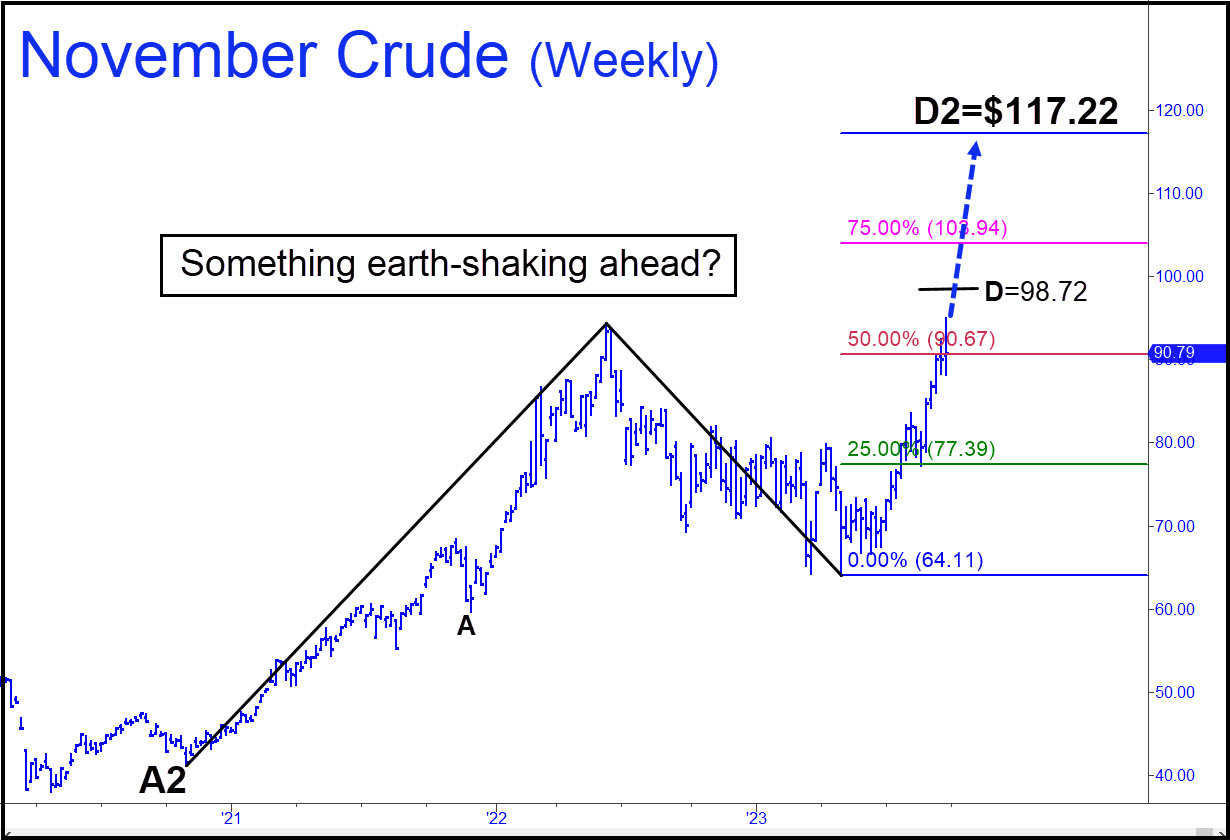
One of the updated charts packed quite a surprise: NYMEX Crude. We’ve been quite bullish on oil since early this year, when quotes were lingering around $72/barrel. However, the rally turned unusually steep in May and hit a high last week at 95.03 that fell a few dollars shy of a $98 target we’d been using as a minimum upside objective. This prompted a look at a longer-term chart. Lo, the weekly bars imply an impending run-up to $117 a barrel. Moreover, last week’s decisive move through the pattern’s Hidden Pivot midpoint at 90.67 implies that a surge to $117 is no worse than an even-money bet. Could this mean that a long-anticipated war in the Middle East is about to break about? Regardless, if the price of oil is in fact bound for $117, something world-shaking is about to occur.
*********


