History will reflect on Gold’s breakout in March from a 13-year cup and handle pattern as extremely significant and the major turning point for a new secular bull market in precious metals.
However, Gold has yet to break out in real terms.
A breakout and strength in real terms is imperative for capital to flow beyond only Gold and large gold producers.
It is actually a signal of more capital flowing into the sector, and when that occurs, buying flows downstream into silver stocks, junior miners, and junior explorers.
As for Gold in real terms, two important charts are near major breakout levels.
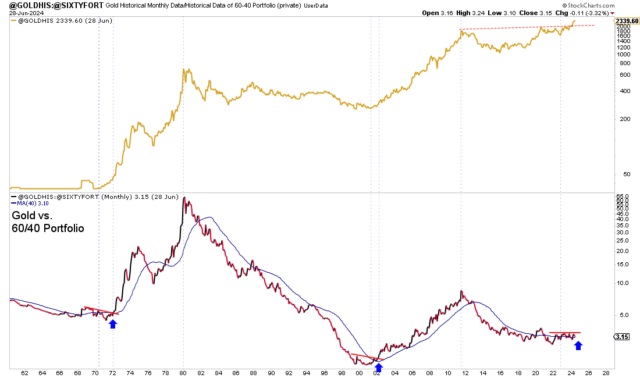
The first is Gold against the total return of a 60/40 portfolio.
Gold has exploded through the cup and handle pattern and $2100, but Gold against the 60/40 portfolio continues to meander below the red line.
As you can see, in the very early 1970s and 2000s, Gold bottoms and began its move before it launched against the 60/40 portfolio (in 1972 and 2002). We are waiting for that launch.
Next, we plot the Inflation-Adjusted Price of Gold (Gold against the CPI) and the Barron’s Gold Mining Index below.
Gold vs. CPI is the best fundamental indicator for gold stocks.
Gold vs. CPI is close to breaking out of a 45-year base.
Gold has traded between $2300 and $2400 for the majority of the past three months. As long as it continues to hold $2290, it is in a good position for another leg higher into the autumn.
If the next move higher is strong enough for the inflation-adjusted Gold price to break to new all-time highs and Gold to break out against the 60/40 portfolio, it would be a far more significant development than breaking $2100.
It would confirm a new secular bull market in precious metals and kick off a buying frenzy.
Importantly, I hold quality companies poised for huge returns in that environment. We shall move down the risk curve only when a new secular bull is confirmed.
********


