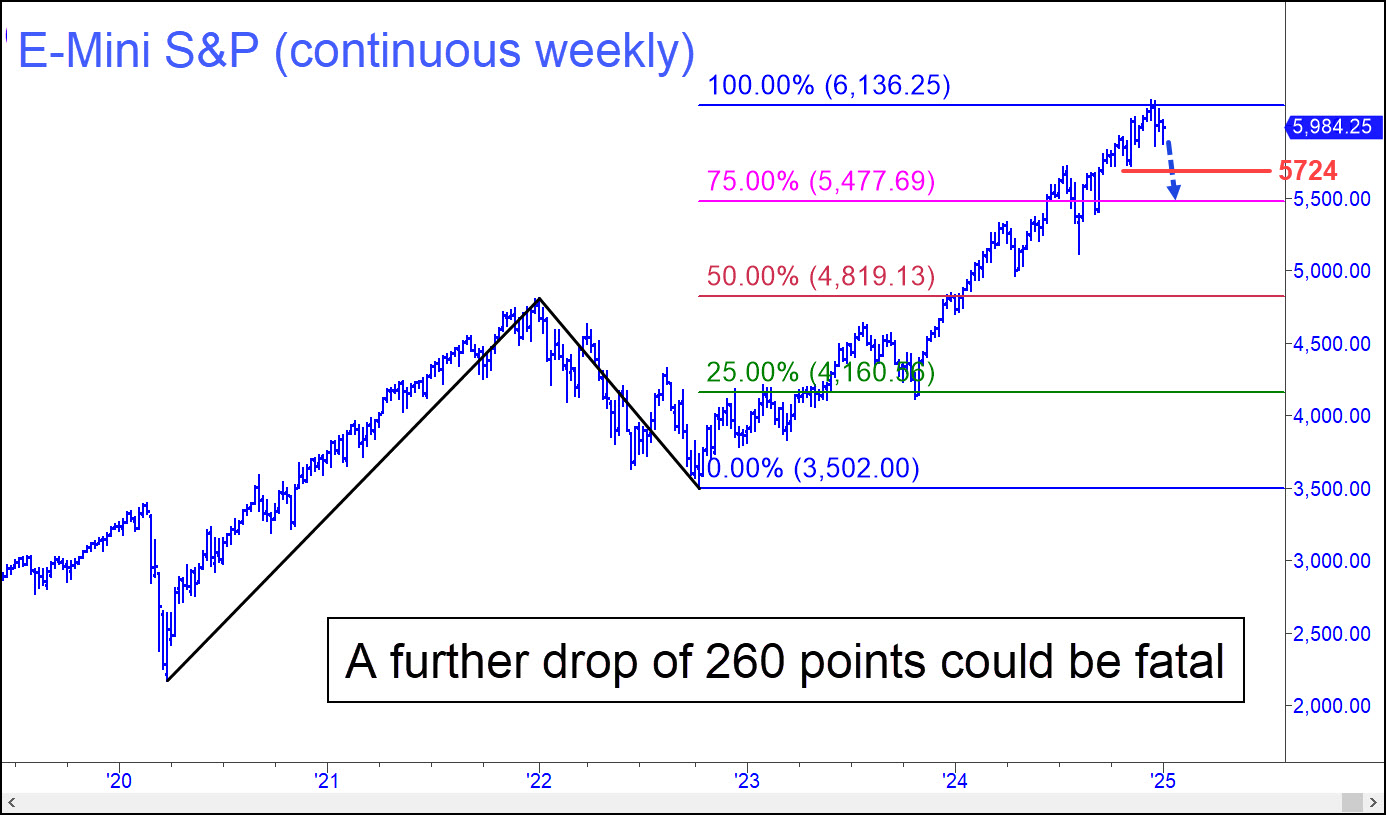
The party is over, or so says the chart above. It is a long-term picture of the E-Mini S&Ps, and it shows the futures rolling down after touching a 6136 target that has been nearly five years in coming. Actually, it has taken nearly 16 years to get there since the longest bull market in U.S. history began in March 2009. The economy was emerging from the devastation of the Great Financial Crash, ready to embark on a fresh cycle of foolishness that has put Americans in an even deeper state of hock. The major stock indices have more than quadrupled since then, and anyone who has stayed fully invested in index futures or a few high-flying ‘lunatic stocks’ would have achieved long-term gains that no portfolio manager in decades past could have imagined.
My analysis has utilized a standard ABCD pattern to project the 6135.25 top. However, it should not be expected to work precisely for two reasons. For one, it is a blended chart, with key highs and lows derived from many successive contract months. Although the coordinates are matched closely, the result is not seamless, and the ‘D’ target could therefore be off by as much as 10 to 15 points. For two, the pattern is so in-your-face obvious that every Tom, Dick and Harry who fancies himself a chartist would have spotted it more than a year ago and used it to ride the bull to the top.
Obvious, but Potent
Assuming they did, more than a few would have reversed their positions and gotten short at the recent peak. If so, we shouldn’t be surprised to see a short squeeze rip them a new orifice in the weeks ahead. The result would be a jagged top littered with the bodies of intrepid traders. Whatever happens, I strongly doubt that 6136 will be significantly exceeded before the bull market strokes out. Although the pattern is too obvious and its target too widely anticipated to produce a perfect climax on cue, the overall look of it is compelling enough to produce a major top.
So far, the pullback from the 6170 high has not breached any prior lows. However, if the weakness of the last four weeks were to take out early November’s 5724 low, that would generate the first bearish impulse leg we’ve seen on the weekly chart in three years. Still more troubling is that this will have occurred off a target sufficiently well defined to cap the bull market. Permabulls in particular should take note of this and tune out the siren song of Wall Street’s mighty PR machine. It has never, ever contained a warning, and it will always be loudest at market tops.
********


