Sign up for daily news updates from CleanTechnica on email. Or follow us on Google News!
The free rider problem in climate action arises when some countries or actors benefit from the efforts of others to mitigate climate change without contributing their fair share. Since the atmosphere is a global common good, actions taken by one country to reduce greenhouse gas emissions benefit the entire world, including countries that do not take similar steps. Europe’s consistent reductions in emissions since 1990 and China’s starting rapid structural decline make the USA’s actions look anemic on the surface, and worse under the covers.
Let’s start with the obvious: the Inflation Reduction Act from the Biden Administration is much better than what came before it in any administration. However, as per my recent climate report card series on the country, the past four years still only merited a B- on climate.
And while the IRA and related efforts are merely okay, the United States has turned into the world’s largest extractor, processor, refiner and exporter of fossil fuels, with a rather absurd amount of growth during Biden’s Presidency. (There is a glimmer of a silver lining around that very black cloud however.)
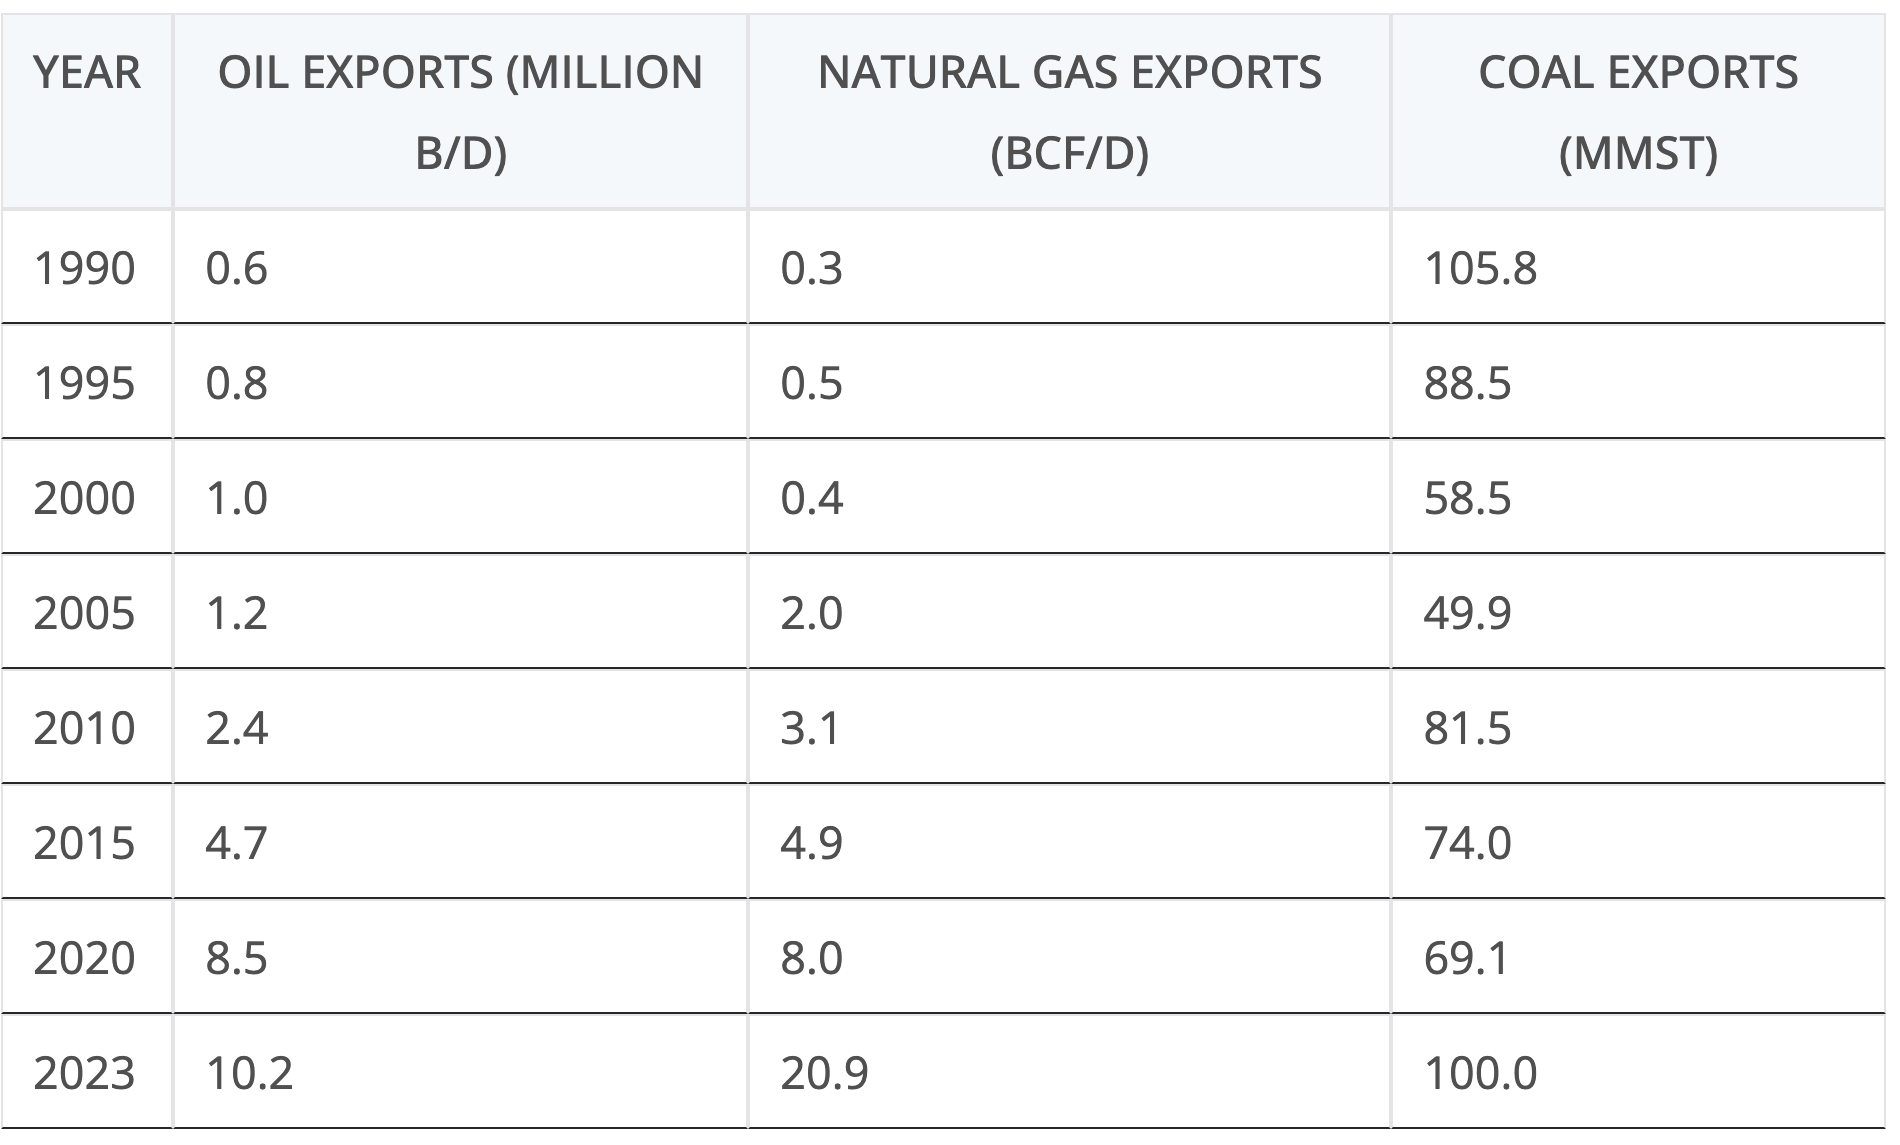
Exports of coal have replaced burning coal in its electrical generation system, which means that the claimed wins of reducing emissions there are deeply questionable. The coal is still being burned, but now it’s being burned overseas with added emissions from shipping it. Further, that replacement of coal was mostly with natural gas, and as has been found in domain after domain, burning natural gas comes with a lot of extra methane emissions. Maritime shipping, oil and gas industry processing power plants and combined cycle gas turbines all have much higher methane slippage than industry estimates, and the USA has led on powering things with natural gas and LNG over the past 20 years.
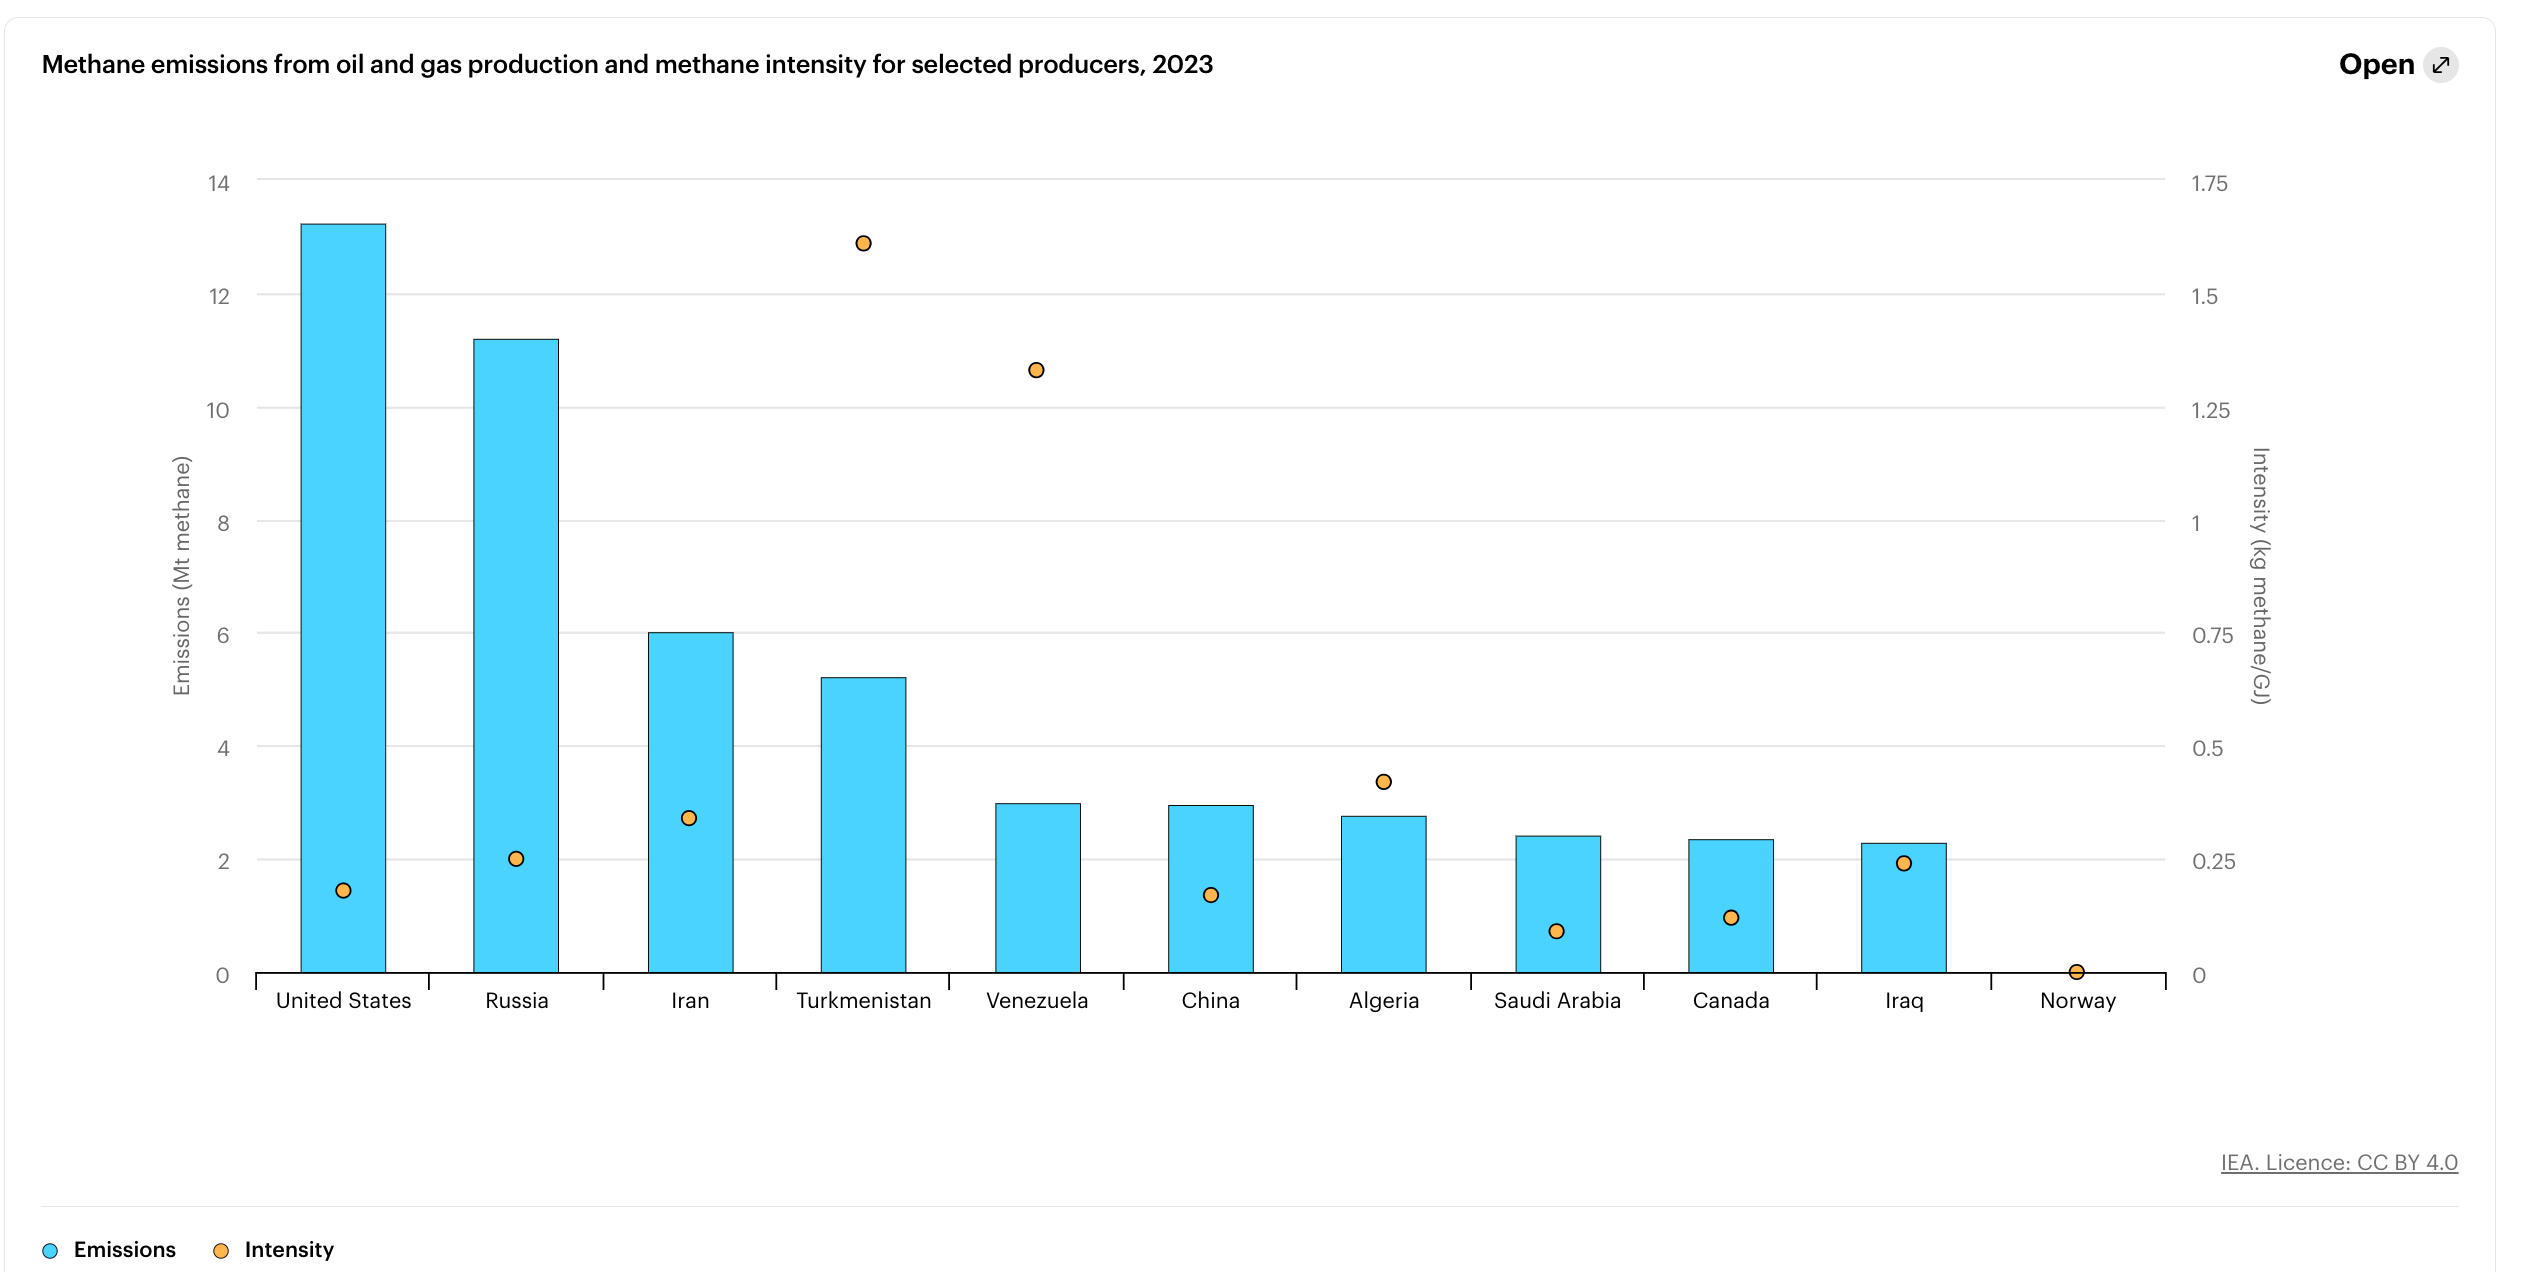
The shale and fracking revolution have led to the USA having by far the highest methane emissions from its oil and gas industry. The chart above from the EPA uses the low-ball EPA and industry percentages, and study after study by methane-monitoring academics and NGOs consistently find much higher emissions in reality. An accurate chart would see a skyscraper from the USA and a village at its feet from other countries.
Most of that is from shale oil, where fracking approaches are used to fracture shale beds, unlocking the sweet, light crude trapped in them. Unfortunately, with shale oil comes shale gas, and shale oil operators aren’t looking for gas. As a result, they’ve been pumping it into the atmosphere by the megatons. Even when they flare it, combustion is incomplete, so lots of methane slippage comes from even the best flare stacks. Needless to say, most of the flare stacks aren’t the best. And operators frequently stop flaring due to complaints from the neighbors, so it ends up just being vented.
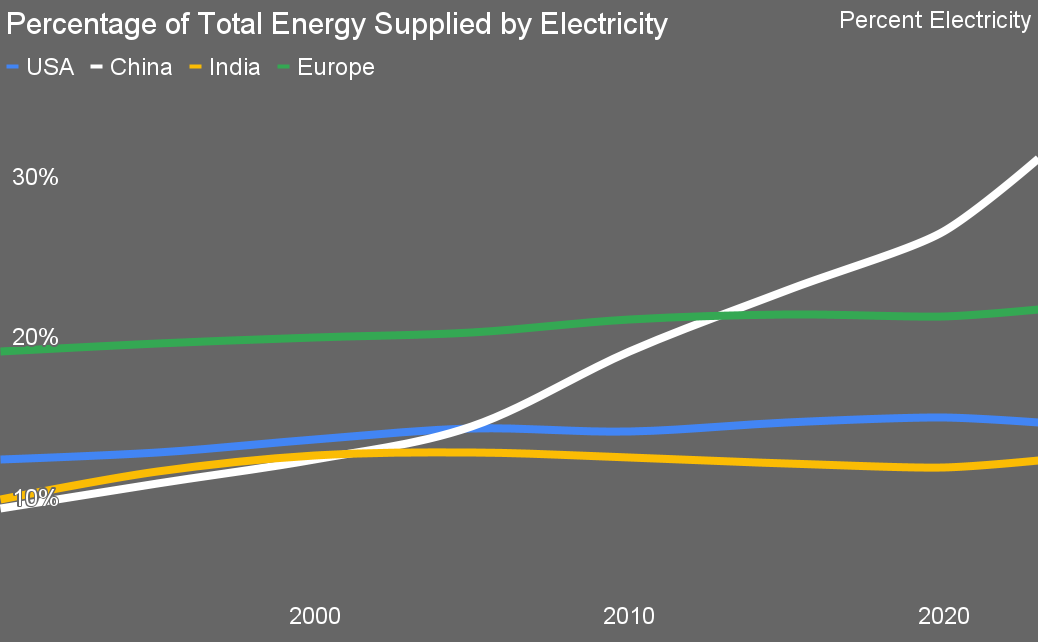
As I noted in a recent global assessment, there’s a prime measurement of decarbonization trajectory, and that’s the percentage of electrification of the economy that has been realized. The United States has a low percentage of electrification compared to both Europe and China, and the slope of that line means that it’s going to take approaching forever to achieve 100% electrification.
The first story to learn from that chart is that while the USA is purportedly decarbonizing electricity but really isn’t due to methane emissions, it isn’t expanding electricity. Yes, there’s more wind and solar than there used to be, but it’s displacing fossil fuels, not adding to total electricity. End services consuming electricity in residential, commercial and industrial heating haven’t budged and transportation hasn’t budged.
The second story is that even this chart is inaccurate for the USA. There’s a little secret about its current fossil fuel extraction approaches. They have much higher energy requirements than traditional oil, which was in pressurized underground reservoirs which when pierced pumped the oil to the surface themselves. Same with natural gas. Fracturing shale for oil and gas requires vastly more energy to both fracture the shale and to extract the fossil fuels. So does enhanced oil recovery with carbon dioxide, another major portion of US unconventional oil techniques.
The fossil fuel industry gets this energy behind the meter from their own fossil fuels and they burn the fossil fuels behind the meter to produce the energy. That’s true for fracking, extracting and processing, for the most part. It’s true for some distribution as well. That energy isn’t counted in national energy budgets because no one is required to report it, as far as I can tell. US fossil fuel use for fossil fuel extraction has shot up in the past 20 years, yet it’s not being counted because dollars aren’t changing hands.
Shale oil requires 2 to 5 gigajoules per barrel of oil for drilling, fracturing, extraction and processing. That’s 0.33 to 0.82 barrels of oil of energy. And remember, a barrel of oil is thermal energy, not work, while drilling, fracturing and extraction are mostly work. That means you have to multiply the energy requirements by a factor of three on average to get the actual fuels required. Every barrel of shale oil is burning 0.9 to 2 barrels of oil equivalent, mostly as natural gas, to get it out of the ground and make it fit for distribution and refinement.
US electrification ratios are probably wrong simply because that energy isn’t being counted anywhere in the national quads of energy calculations. They probably have been going down over the past 20 years, not slightly up. That’s the wrong direction.
There’s a reason why electrify everything is at the top of most comprehensive climate action lists, and it’s not because they are sponsored by the makers of electric appliances. The United States hasn’t moved the needle on this, which is why their transportation sector has become the biggest acknowledged greenhouse gas emitting segment. The country has far fewer electric cars, buses and trucks than China or Europe, and it’s being outstripped on electric buses by India and a couple of African countries too.
There’s a great source of cheap, amazing quality, full-featured electric light vehicles that Americans would love to have access to, but the United States has put unprecedentedly high tariffs on electric vehicles and batteries from China. Those proved completely inadequate to give the country’s domestic manufacturers — other than Tesla — any ability to build an affordable electric car they could make even the tiniest profit on, so now they are banning all Chinese software in cars, a policy as ludicrous as the TikTok nonsense.
The effective ban on Chinese cars and batteries will cause the United States and its unfortunate hostages Canada and Mexico to lag on electric vehicle uptake at all levels of road transportation. More lagging on climate action.
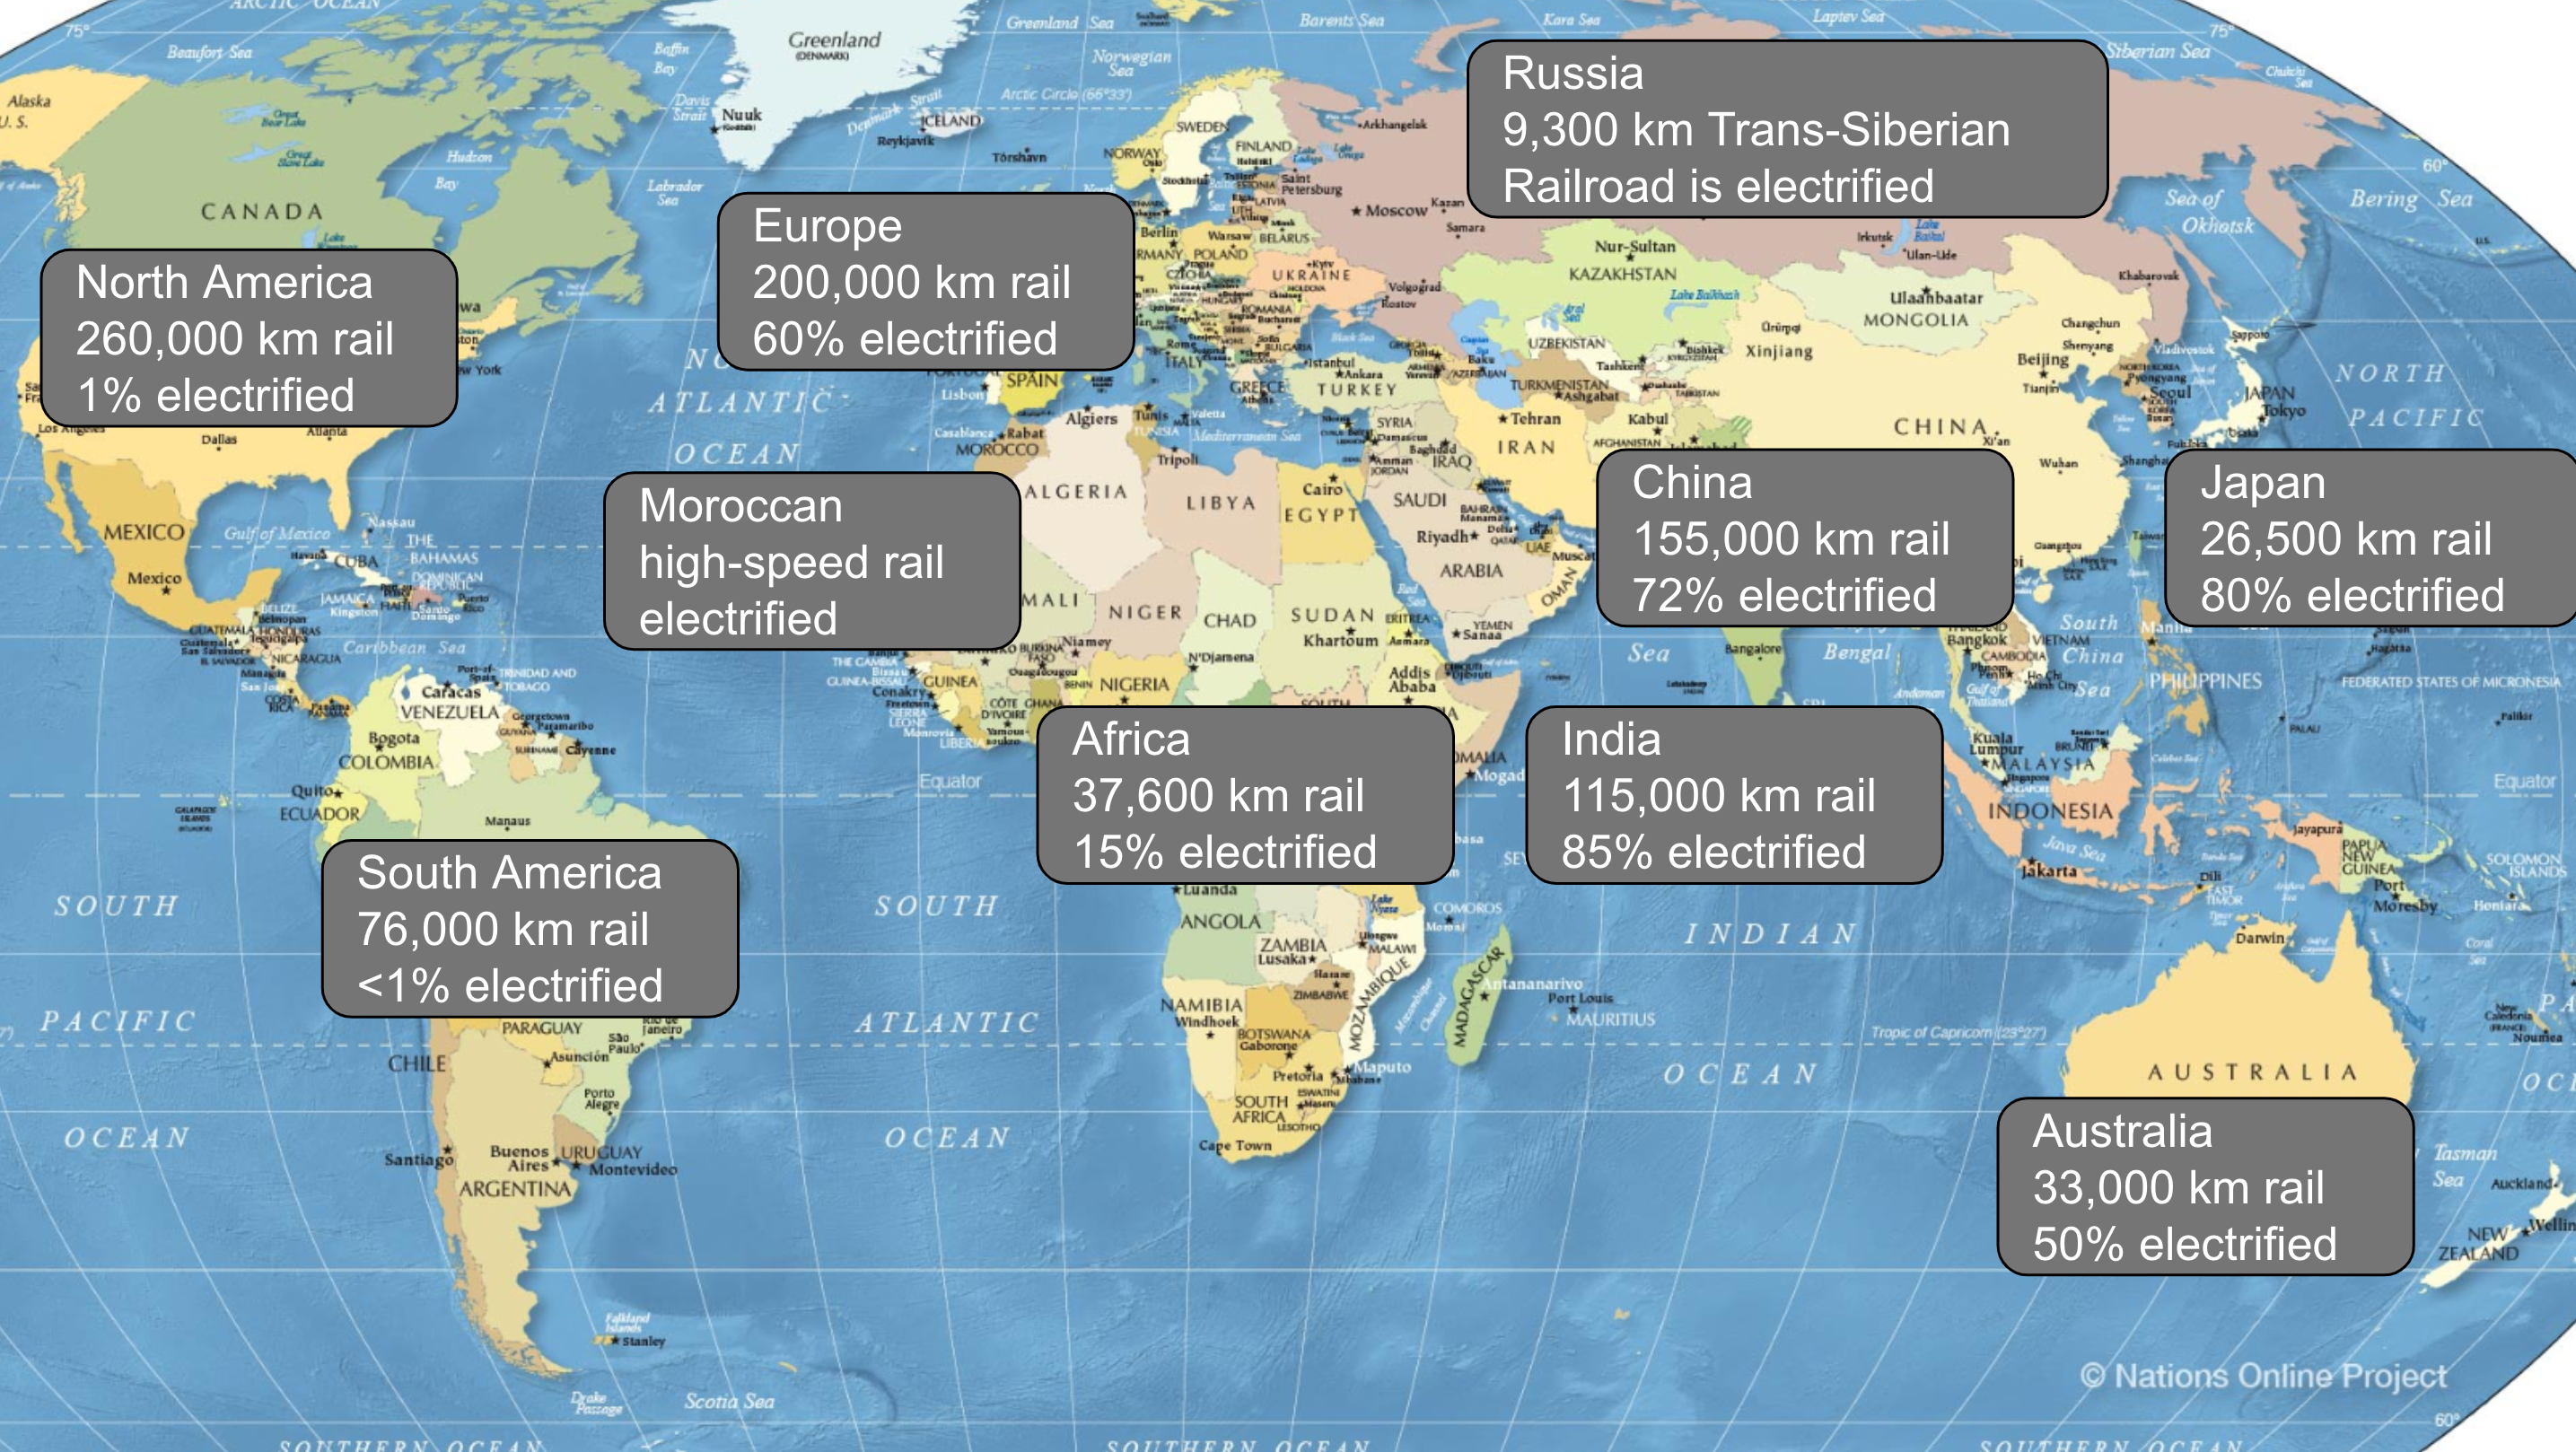
Outside of the Americas, every other geographical region is advanced on electrifying rail, passenger rail and even high speed rail. Africa has more electrified rail and high-speed rail than the USA. Indonesia has high speed rail. The Trans-Siberian Railway is electrified for the entirety of its 9,300 kilometers. India moves the majority of its domestic freight, 75%, by rail, and will have 100% electrified rail this year. The United States? Nothing, and the Class 1 railroads are strongly lobbying against it.
The United States still moves a reasonable amount of freight by water, but the Jones Act and now the aforementioned absurdly high tariffs make real decarbonization of domestic water freight very difficult, not to mention making the mode shifting to water freight the US transportation blueprint wishes were possible actually impossible.
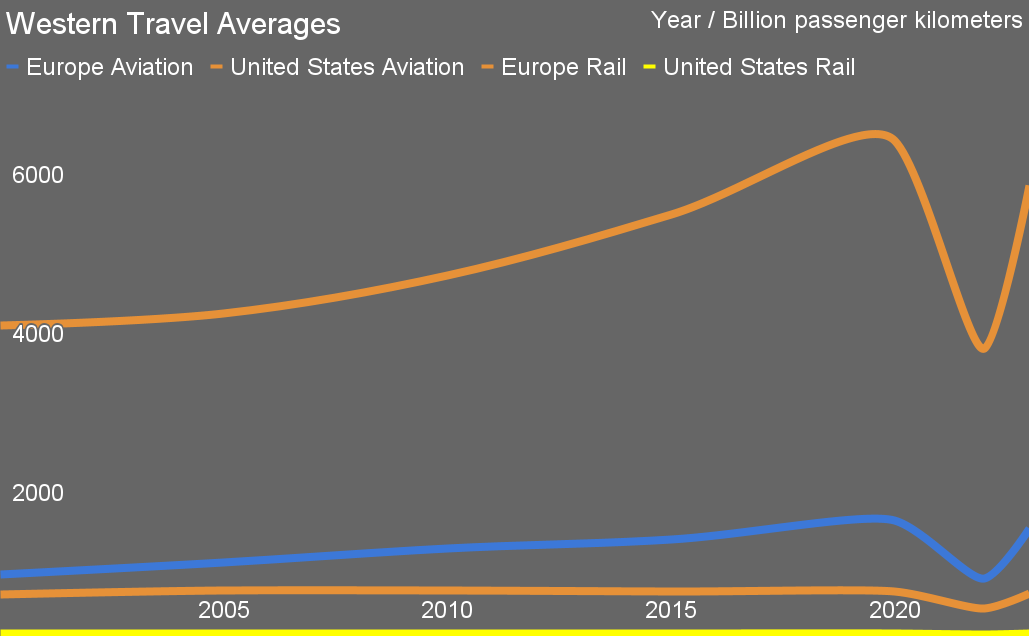
The United States has citizens who fly vastly more kilometers per year than the European average, never mind the vastly smaller less done by Asians and Indians. The huge drop during COVID makes it clear that it’s completely unnecessary flying, not critical flying, and the rapid return since then means Americans are burning up the skies and hence the planet still.
The United States has also ceded all aviation regulatory control to Boeing, with the FAA papering around the edges with beyond visual line of sight rules for drones. More on this later, but the USA doesn’t put a carbon price on aviation fuel, unlike other jurisdictions. The combination means that actually getting movement on real aviation decarbonization is incredibly unlikely in the country. There’s zero economic incentive for domestic aviation or foreign flights originating in the country to buy low carbon fuels.
Meanwhile, Europe is putting a carbon price on all flights and Canada’s increasing — although at risk with current politics — carbon price applies to jet fuels, as it should.
As I noted not long ago, the USA is uniquely constrained when it comes to decarbonizing transportation, with rail that won’t electrify for a couple of decades minimum, water freight that can’t expand and will be very slow to decarbonize and a human transportation pattern based on driving and flying everywhere. It’s basically made itself into the worst case, most inefficiently structured country in the world for transportation, and hence is going to be the hardest to deal with.
When it comes to heating and cooling, the United States is exceptional in the bad sense again. While China and Europe are hot beds of heat pump deployment, especially China, heat pumps have barely started moving in the USA. A few cities have banned gas hookups in new buildings, but that does nothing for the masses of old buildings, and it only covers about 3.5% of the US population. Building codes and zoning in the USA have favored sprawling, poorly insulated homes and buildings, and as a result, energy requirements for heating and cooling are the highest in the world for equivalent temperatures. The dirt cheap cost of fossil fuels for heating — more on that in a minute — means owners have very limited economic incentives to insulate and stop drafts.
Then there’s carbon pricing. India just finalized its carbon pricing system, which has some national mandated carbon pricing and too strong a reliance on somewhat regulated voluntary markets. China has a national carbon market, one that hit a record high price recently, and is expanding it to include steel, cement and aluminum. Europe’s emissions trading system prices carbon far above California’s or Canada’s carbon price, will expand to include all greenhouse gases in 2026, and will be applied in a carbon border adjustment mechanism starting that year as well. That’s the biggest countries in the world, including the what-about countries, that are pricing carbon at a national level.
Meanwhile, the USA under Biden abandoned plans to put a carbon pricing bill to a vote, even though it was disguised as anti-China, carbon border adjustment. Domestic carbon pricing just wasn’t viable. It’s still remarkable to me that the USA managed to get a refrigerant carbon market mechanism and a leaked methane carbon market ( which is as full of loopholes as Swiss cheese) enacted.
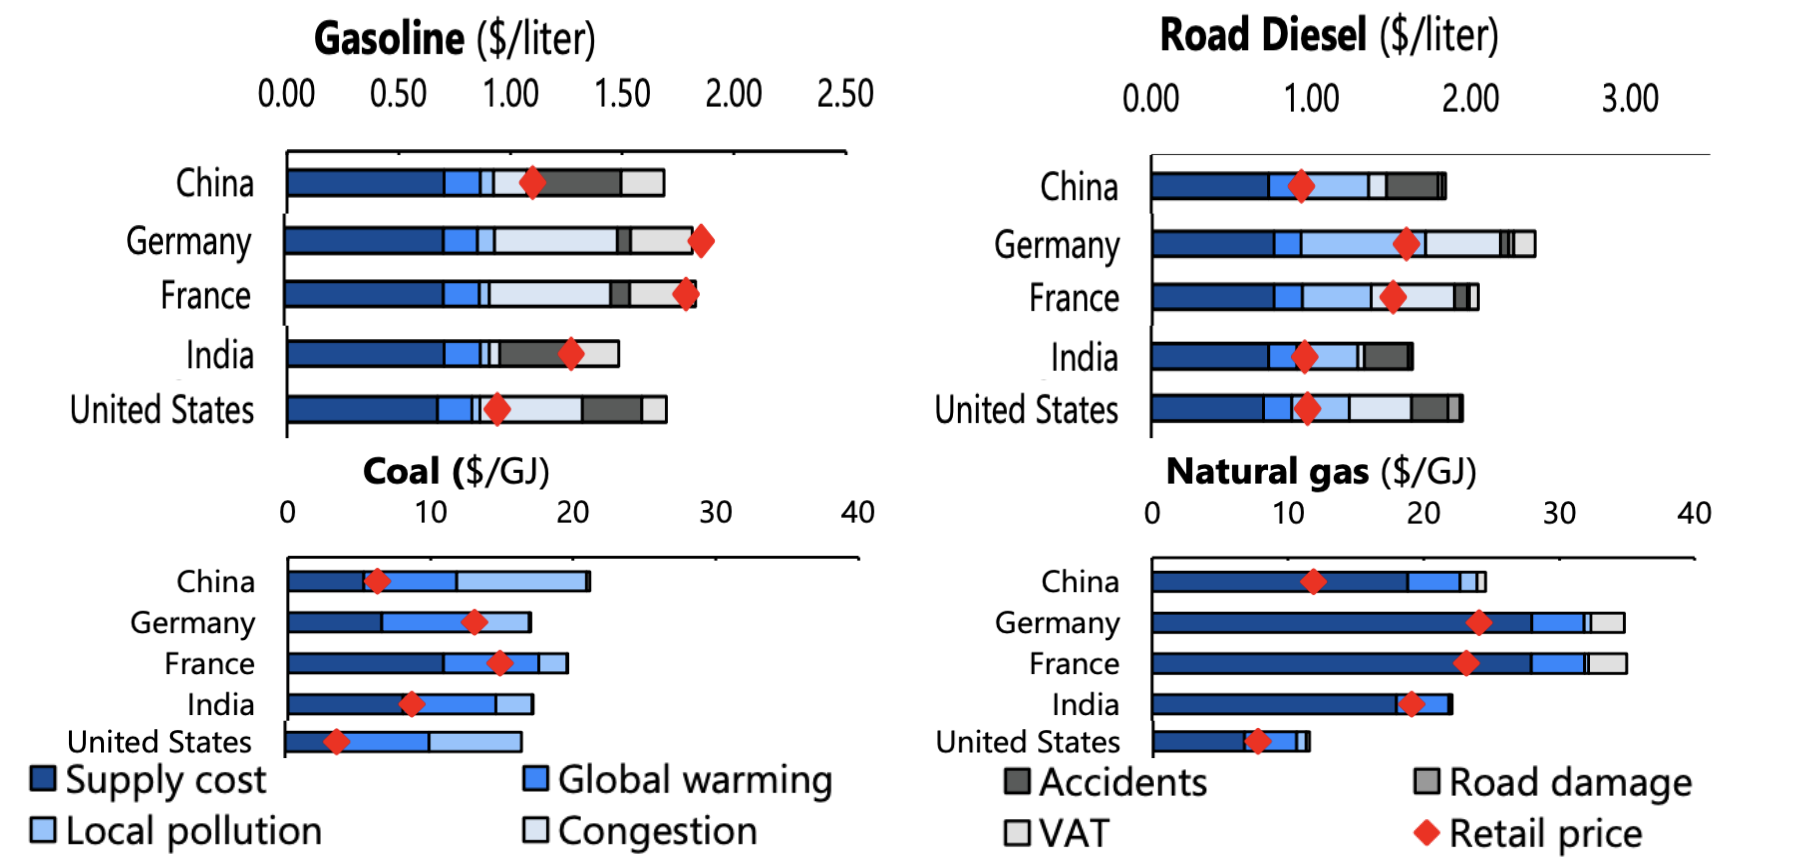
Sensible countries like Germany have intentionally kept energy prices high to incentivize efficient use instead of waste. That’s been problematic as they kept electricity prices high as well despite among the lowest wholesale electricity costs in Europe. That has resulted in a distinct lack of electrification, but Germany finally got the memo and is now enacting much cheaper industrial electricity rates, US$0.06 per kWh.
The United States has intentionally avoided applying any policy adders for efficiency, pollution or greenhouse gas to energy prices, has vast amounts of fossil fuel resources inside its border and next door in Mexico and Canada, and as a result has very cheap energy prices. That’s led to their massive land yachts and dependence on cheap natural gas for residential, commercial and industrial heat, where they aren’t burning oil for heat.
The country has the lowest fossil fuel prices among the major economies, isn’t removing the subsidies for fossil fuels and isn’t pricing carbon. As a result, there’s very little zero economic incentive to electrify or use biofuels. California’s low carbon price and regulated requirement to shift to low-carbon ground transportation is good, but deeply inadequate. The several blue states that have an even lower gasoline and diesel taxes are even more inadequate.
There appears to be exactly zero will to change this. As a result, transportation, electrical generation and all forms of heating will be fossil-fuel based long past the time the rest of the world has decarbonized those segments.
The only approach that appears to have any national political will behind it is to throw subsidies at green hydrogen, a brain dead solution that will result in still very high energy costs, an incredible waste of electricity that could be used much more directly, more national debt, and an economy that won’t use it unless forced to, which the USA isn’t doing.
Back to China, one of the major what-about countries. Its coal use this year is plummeting. Building lots of coal plants for the capacity when needed isn’t remotely the same as running them all the time. Their iron manufacturing is well off as they are finished the major infrastructural build out, for the most part. The country has banned new coal powered iron and steel mills and is pushing hard toward electric steel minimills (one of the USA’s few bright spots with 70% EAF steel, tarnished substantially by their use of more natural gas for pre-heating). They are continuing to hammer in more wind, solar and hydro electricity, supporting by lots more HVDC transmission, more pumped hydro than exists in the rest of the world, lots of battery storage, and they are going through more electricity market liberalization.
As an earlier chart shows, they’ve been aggressively electrifying their economy for decades, with much higher rates of industrial electrification than the USA (or Europe), hundreds of thousands of electric buses and trucks, 45,000 km of high-speed electrified rail which they use much more than airplanes, and on and on and on. Their cities are much denser, they live in multi-unit residential buildings with heat pumps, they take electrified public transit and all of their two-wheeled vehicles are electrified.
Peak gasoline demand happened in 2023 in China. Peak diesel is past now as well. While natural gas has been rising, from 4% of energy in 2010 to 9% to 10% in 2023, peak natural gas is coming too. Peak coal is probably this year, just as David Fishman of the Lantau Group predicted last year.
And it’s not a peak then a long plateau. China is continuing to electrify everything everywhere all at once and deploy 300 GW of wind and solar annually. It’s both growing electricity demand rapidly at the expense of fossil fuels as an energy service end point, and massively growing generation of decarbonized energy.
What this means is that the combination of much lower construction and its energy demands, vastly more electrification of what remains and vastly more low-carbon energy, China’s greenhouse gas emissions will be going down as sharply as they went up in coming years.
| Energy Source | China’s Share of Global Consumption (%) | USA’s Share of Global Consumption (%) | Europe’s Share of Global Consumption (%) | India’s Share of Global Consumption (%) |
|---|---|---|---|---|
| Oil | 15-16% | 20% | 13-14% | 5-6% |
| Coal | 50-55% | 7-8% | 5-6% | 11-12% |
| Natural Gas | 8-10% | 20-21% | 15-16% | 1.5-2% |
| Diesel | 13-14% | 12-13% | 15-16% | 7-8% |
Chart of percentages of fossil fuel usage by major economic block or country by author
The United States is currently the world’s biggest consumer of oil and natural gas, and those levels will persist while China’s already lower demand for those fuels drops rapidly. The USA will soon have the highest consumption of diesel in the world as Europe’s strong focus on decarbonizing road and domestic water freight gains traction. China’s demand will be falling quickly as well, as they continue to electrify road and domestic water shipping.
China’s massive coal consumption will be plummeting in coming years, consigned to lower and lower capacity factors by the massive renewables build out. The relatively low US percentages aren’t particularly great, because as a reminder, Europe, China and India have far more people, and Europe and China have not only almost identical land areas, but also very high gross domestic products.
Spread those numbers across 1.4 billion Chinese people, another 1.4 billion Indian people and 745 million Europeans vs the 330 million Americans, and you’ll see that on a per capita basis, the USA’s fossil fuel consumption is the highest in the world. Because of structural and systemic reasons combined with approaching zero political will to actually address this, the USA’s consumption won’t be going down much while China’s and Europe’s declines rapidly. Only India’s increasing coal use will be something for the USA to feel proud in comparison too, as long as they don’t do the per capita math.
That’s why I gave the Democratic climate platform for the 2024 election only a grade of C. It’s vastly better than the alternative, and the only real choice for any American concerned with climate change (and the economy, wages, health care, education, equity and a raft of other concerns), but it’s completely inadequate for a country that’s soon going to have the highest greenhouse emissions again.
I did mention a silver lining, and those of you who have persisted through the rather appalling and depressing data on the reality of climate action in the USA deserve a reward, so here it is. Those high shale oil methane emissions might be peaking and in decline soon.
The USA is in Shale 4.0 now. The shale deposits that were cheapest to frack and had the highest expected output have been fracked. It’s now very clear that a shale oil well only lasts a small handful of years before being tapped out. On average, the big players who have consolidated most of the shale operations and land rights are now into increasingly marginal profitability. As peak oil comes, oil prices are likely to decline under the likely optimistic US$60 breakeven point for a lot more of the wells that are waiting for fracking. Shale output has been flat for a couple of years.
What that means is that the next decade for US shale might be as tumultuous as the 2000s and 2010s, but instead of incredibly rapid growth with unmet expectations causing debt laden companies to bankrupt, it will be rapidly declining volumes as it won’t be worth fracking new wells. Of course, the odds of the owners actually sealing their wells tightly and monitoring them approaches zero, because the oil industry is all about privatizing profits and socializing costs, but at least they won’t be expanding the problem nearly as rapidly. Ditto those LNG exports as well as the world pivots away from US methane too.
I’ve been exploring the structural challenges to real climate action in the USA and looking at global decarbonization constraints as well for quite a while. To be blunt, I see almost no honesty among even American climate policy makers and strategists about the reality of the challenges, and as a result I don’t see much in the way of realistic strategies to deal with them. Americans believe they are leading the world, that their solutions are the best and that it’s the rest of the world that has to catch up, and that’s the Americans who actually want to address climate change enough to even register.

Have a tip for CleanTechnica? Want to advertise? Want to suggest a guest for our CleanTech Talk podcast? Contact us here.
Latest CleanTechnica.TV Videos
CleanTechnica uses affiliate links. See our policy here.
CleanTechnica’s Comment Policy


