What if the worst in interest rates is yet to come?
Until recently, the prevailing wisdom held that the Federal Reserve would start chopping interest rates sometime this year. At first it was seven cuts, than five, three, now it’s down to two cuts.
The question of when this happens is a moving target. First cut was in March, then it was June, now it’s September. Wall Street is even considering the possibility that there won’t be a cut until March 2025.
The federal funds rate (FFR) currently sits within a range of 5.25 and 5.50%. The last time the Fed raised rates was in July 2023, meaning that rates have been left unchanged for six of the last seven Federal Open Market Committee (FOMC) meetings.
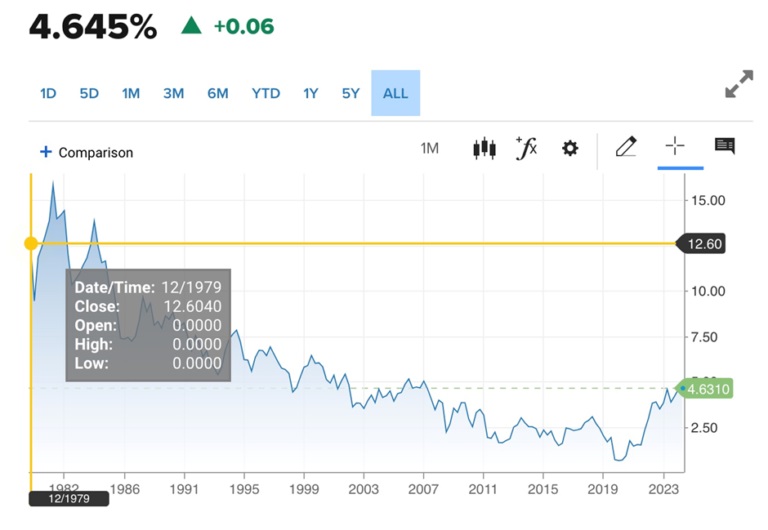
The high FFR, also known as the prime rate, has trickled down to US Treasuries and the US dollar. The 10-year Treasury yield currently sits at 4.6% and appears to be heading to 5%.
Source: CNBC
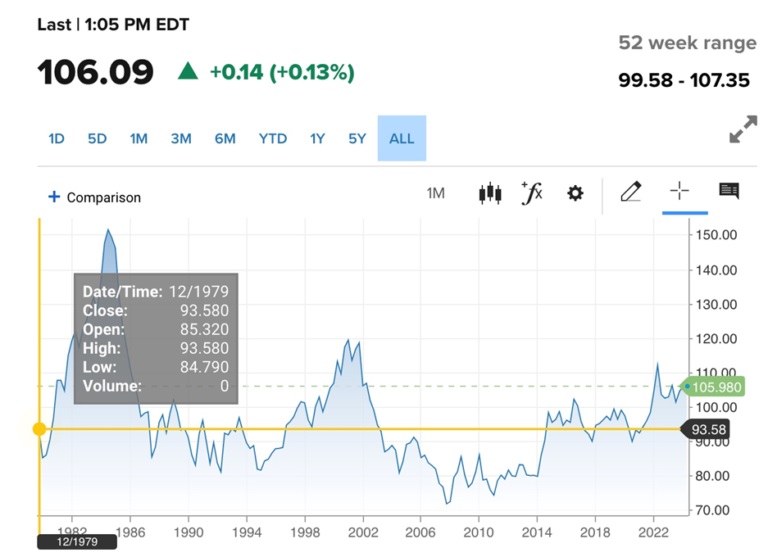
The US dollar index DXY has been climbing all year and currently sits at 106.
Source: CNBC
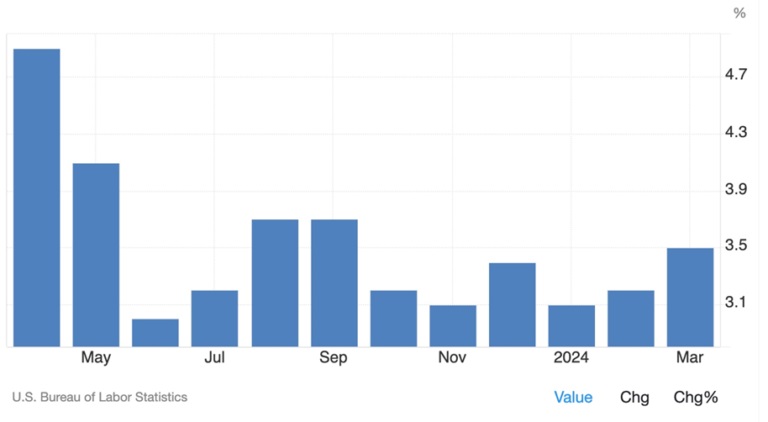
What’s the Fed waiting for? In a word: inflation. The Fed needs inflation to come down to its 2% target. But inflation isn’t dropping. The March Consumer Price Index inflation print, made public on April 10, was 3.5%. In February it was 3.2% and in January it was 3.1%.
US inflation. Source: Trading Economics
Persistent inflation and the weird phenomena of several economic indicators all rising in tandem has us at AOTH looking to history for answers. We’ve already shown that inflation, the dollar, and bond yields are climbing. Normally when the dollar and bond yields rise, gold falls. But gold is hitting record highs and is currently trading over $2,300 an ounce. The gold price is extremely sensitive to the US dollar and interest rates. When bond yields minus inflation “go negative”, as in negative real rates, it’s usually a positive signal for gold. But real rates have been positive for months, yet the gold upleg continues.
We’ve shown that central bank gold purchases are the main price driver, and more recently, institutions and wealthy individuals. The retail investor is not yet invested in this gold bull market because more funds are flowing out of gold ETFs than in.
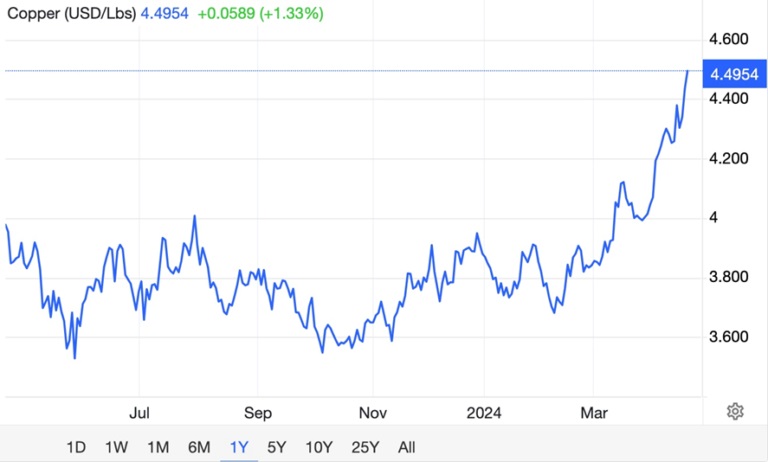
Copper, a barometer of global economic growth because it has so many industrial uses, is also having a moment — rocketing from $3.76 a pound at the beginning of February to the current $4.44 — after spending most of 2023 under 4 bucks.
Source: Trading Economics
Again, this shouldn’t be happening while the dollar is strong.
Global manufacturing recovery underway, can it last?
When inflation was hitting 40-year highs in 2022 many, including us, were compelled to look back in history at when this last happened.
1979 vs 2022: Why interest rate hikes are different
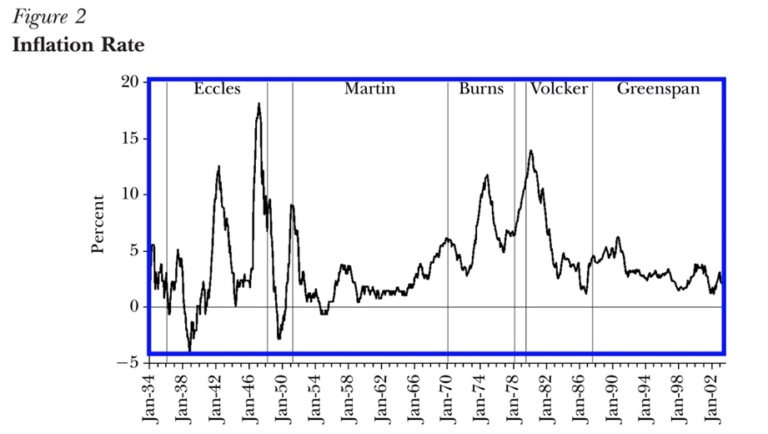
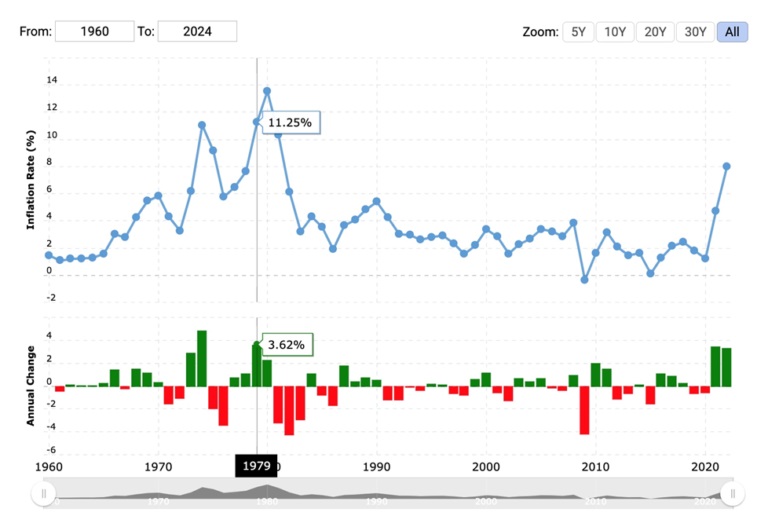
In 1979, then US Federal Reserve Chair Paul Volcker faced a serious challenge: how to quell inflation which had been wracking the economy for most of the decade. The prices of goods and services had averaged 3.2% annually since World War II, but after the 1973 oil shock, they more than doubled, to an annual 7.7%. Inflation reached 9.1% in 1975, the highest since 1947. Although prices declined the following year, by 1979 inflation had reached a startling 11.3% (led by the 1979 energy crisis) and in 1980 it soared to 13.5%.
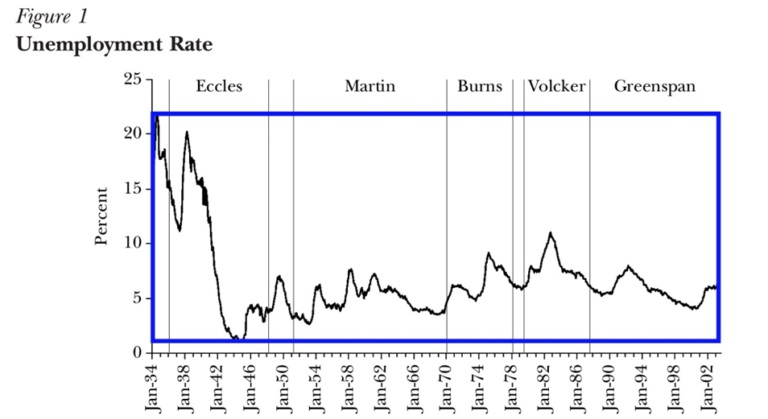
Not only was inflation going through the roof, but economic growth had stalled and unemployment was high, rising from 5.1% in January 1974 to 9% in May 1975. In this low-growth, hyperinflationary environment we had “stagflation”.
Volcker is widely credited with curbing inflation, but in doing so, he is also criticized for causing the 1980-82 recession. He did it using the same playbook as the current Federal Reserve: by raising the federal funds rate. Except he was way more aggressive. From an average 11.2% in 1979, Volcker and his board of governors through a series of rate hikes increased the FFR to 20% in June 1981. This led to a rise in the prime rate to 21.5%, which was the tipping point for the recession to follow.
Powell vs Miller
Usually the Powell Fed is compared to the Volcker Fed, but what if the proper comparison isn’t to Paul Volcker but his predecessor, William Miller, who served as Federal Reserve chairman from 1977 to 1979?
In a way the comparison is more fitting because Miller is considered to have gone too easy on inflation by refusing to raise interest rates to quell demand. He left the dirty work to Volcker.
Maybe Powell, like Miller, hasn’t raised rates enough, and he will go down in history as following too dovish a monetary policy. Perhaps another more hawkish Fed chairman is waiting in the wings to do his dirty work. Let’s begin by taking a look at what Miller did and didn’t do.
William Miller was appointed chairman of the Board of Governors of the Federal Reserve by President Carter in 1977. He took up the post on March 8, 1978, and served until August 6, 1979. Previously Miller was a director at the Federal Reserve Bank of Boston.
According to Federal Reserve history,
As chairman at the Board of Governors, Miller became known for his expansionary monetary policies. Unlike some of his predecessors, Miller was less focused on combating inflation, but rather was intent on promoting economic growth even if it resulted in inflation. Miller argued that the Federal Reserve should take measures to encourage investment instead of fight rising prices. He believed that inflation was caused by many factors beyond the Board’s control.
Miller left the Board of Governors after being appointed secretary of the Treasury, where he served until January 20, 1981.
We talk about the inflationary 1970s in the section below, but for now, let’s turn to a 2004 paper published in the ‘Journal of Economic Perspectives’, titled “Choosing the Federal Reserve Chair: Lessons from History”.
Authors Christina and David Romer note that in January 1979, when unemployment was at 5.9%, Miller testified that tight conditions in the labor market were “a normal accompaniment of economic expansion and to date have not reached troublesome dimensions.” (the current US unemployment rate is 3.8%)
Miller’s Federal Reserve attributed high inflation to factors such as reduced supply of agricultural goods, increases in the minimum wage, and depreciation of the dollar, rather than demand pressures.
The latter is probably the biggest difference between Miller and Powell. Powell immediately recognized that a big part of the inflation which grabbed a hold of the economy in 2022 was demand for goods and services exceeding supply as the United States and other countries powered out of the pandemic. That, and money-printing. We’ll get into that below too.
The concern about inflation and wanting to reduce it was expressed by other members of Miller’s Federal Open Market Committee.
But as Romer and Romer write, their optimistic estimates of the natural rate led them to avoid seriously contractionary actions. Miller testified: “The Federal Reserve, for its part, is continuing to pursue a monetary policy that aims at a reduction of inflationary pressures while encouraging continued economic growth and high levels of employment” (Bulletin, December 1978, p. 943)…
[a]s Miller himself noted on a number of occasions, “Real interest rates…still appear to remain low by historical standards and thus continue to facilitate an expansion of overall demands” (Bulletin, March 1979, p. 227)…
The effects of Miller’s relatively expansionary policy (as well as the lagged effects of Burns’s last hurrah) are obvious in Figures 1 and 2. The unemployment rate fell steadily in 1978 and early 1979, and inflation surged even before the oil price shock in the second half of 1979.
Source: Global Financial Data. The small gap between Burns and Volcker is the Miller era.
Source: Bureau of Labor Statistics
The Great Inflation
The 1970s has become known as a decade of failed monetary policy. The Great Inflation lasted from 1965 to 1982.
When President Nixon was inaugurated in 1969, he inherited a recession from President Johnson, who had spent generously on the Vietnam War and the Great Society, a series of social programs aimed at reducing poverty.
Nixon famously entered office as a fiscal conservative and left it as a free-spending Keynesian. In 1972, for example, Congress and Nixon agreed to a big expansion of Social Security, in time for him to get re-elected the same year.
According to Investopedia, The Great Inflation was blamed on oil prices, currency speculators, greedy businessmen, and avaricious union leaders. However, it is clear that monetary policies that financed massive budget deficits and were supported by political leaders were the cause.
Nixon’s other economic about-face was imposing wage and price controls in 1971. As inflation began creeping higher, Nixon temporarily froze prices. When his controls were lifted, prices bounced even higher, into double digits.
In 1971, Nixon severed the US dollar’s link to gold, turning the dollar into a fiat currency. Investopedia notes The dollar was devalued, and millions of foreigners holding dollars, including oil barons in the Middle East with tens of millions of petrodollars, saw their value slashed.
In 1972 and ’73, Fed Chairman Burns started to worry about inflation, which by 1973 had more than doubled to 8.8%. By the end of the ‘70s it was 12% and by 1980 it was at 14%.
It was the actions of Fed Chair Paul Volcker that would finally tame inflation through a series of brutal interest rate hikes.
NPR notes that by 1983, inflation had retreated to just over 3%, but at the cost of about 4 million job losses during back-to-back recessions in the early 1980s. For the next four decades, inflation wouldn’t become a problem until the pandemic struck in 2020 followed by the war in Ukraine. In June 2022 inflation reached 9% for the first time in 40 years.
Source: Macrotrends
Let’s take a closer look at the period just before Volcker was installed as Fed chair, because we want to know if it resembles the economic conditions we are in today.
The economy of the 1970s was a period commonly known as stagflation. Stagflation occurs when economic growth slows and inflation rises simultaneously.
The economy was in a recession from December 1969 to November 1970 and again from November 1973 to March 1975.
The massive cost of the war in Vietnam and the expansion of social programs at home drove inflation higher. Meanwhile, US manufacturing especially car making lost ground to overseas rivals Germany and Japan.
The Khan Academy notes unemployment rose by 33% between 1968 and 1970 while the consumer price index went up by 11%.
In one year, unemployment nearly doubled to 6.1%, and by 1975, had surpassed 11% — the highest since the Great Depression. Consumer price inflation hit nearly 15%, and the dollar lost half of its value — $1 in 1970 was worth $0.47 in 1980.
In 1973 the country was hit by an oil crisis. As mentioned, the oil-rich nations of the Middle East were angered when the United States under Nixon devalued the dollar. When the US supported Israel after a surprise attack by Egypt and Syria in the Yom Kippur War, the Organization of Petroleum Exporting Countries (OPEC) exacted their revenge by imposing an oil embargo on the United States and Israel’s European allies.
The price of crude oil shot up to $11.65 a barrel, an increase of 387%. As the Khan Academy describes,
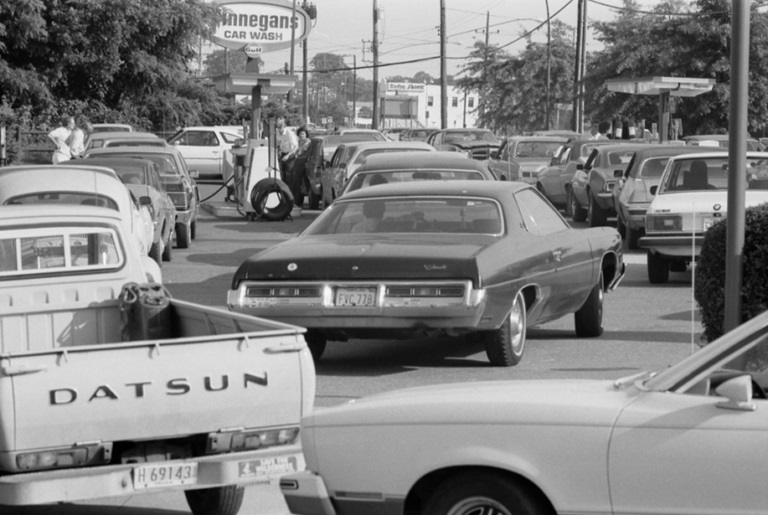
Lines miles-long formed at gas stations. The United States consumed one third of the world’s oil, and its citizens quickly discovered just how much of daily life depended on cheap oil. Families living in far-flung suburbs depended on automobiles to get everywhere. Even after the embargo ended in March 1974, prices for oil remained about 33% higher than they had been before the crisis.
Source: Library of Congress
When William Miller succeeded Arthur Burns as Fed chair in March 1978, inflation was high and the country still suffering from the oil crisis. The CPI was 4.9% in 1976 and 6.7% in 1977.
Wikipedia explains that, while Miller identified inflation as the country’s primary domestic challenge, and the chief obstacle preventing full employment, he did not favor aggressive interest rate hikes that would jeopardize growth. The modest increase in the federal funds rate during Miller’s term did little to rein in inflation.
It’s interesting to note that during Miller’s tenure as Fed chair, the dollar’s value decreased substantially. As Wikipedia states,
In November 1978, only 11 months into his term, the dollar had fallen nearly 34% against the German mark and almost 42% against the Japanese yen, prompting the Carter administration to launch a “dollar rescue package” including emergency sales from the U.S. gold stock, borrowing from the International Monetary Fund, and auctions of Treasury securities denominated in foreign currencies. This proved only a short-term fix; although temporarily steadying the dollar, it soon resumed its fall. The portmanteau stagflation, the combination of stagnation and inflation, was used increasingly during this time to describe the high rate of inflation, which failed to spur the economy. Even as the situation worsened, Miller insisted that contractionary policies like an overly aggressive interest rate increase would not fight inflation but rather encourage it while hurting the economy’s growth.
Similarities
To avoid a recession, Nixon pressured the Fed to lower interest rates. He fired Fed chair William McChesney Martin and installed Arthur Burns as his successor in early 1970.
Here is where we begin to see a similarity between the economic conditions of the 1970s and today.
Nixon, like Presidents George W. Bush, Obama, and Trump, wanted cheap money, which meant low interest rates to promote growth, and an expansion of the money supply to support government spending.
According to Federal Reserve numbers, M1 money supply grew from $228 billion to $249 billion between December 1971 and 1972. M2 money supply increased from $710B to $802B by the end of 1972.
This helped Nixon win the ’72 election, carrying 40 out of 50 states.
Prodigious government spending continued throughout the decade. The Heritage Foundation notes that, despite tax collections rising nearly six-fold from the Johnson to the Carter administrations, spending increased to 19.7% of GDP by 1975, and kept going to 22.3% by 1982.
The deficit rose from $1.4 billion in 1964 to $79 billion by the time of President Carter’s final budget.
The Heritage Foundation says Billions went to city-scale housing projects and urban development, with mass public transit cutting swathes across urban moonscapes. The nation’s railroads were bailed out, with passenger lines nationalized as government-owned Amtrak. Millions of new welfare recipients were created, social security beneficiaries massively expanded, and Washington was abuzz with talk of a “guaranteed annual income” mirroring today’s universal basic income.
Fast forward to today. According to the US government’s Bureau of Economic Analysis, as of the third quarter of 2023, total government expenditures of $10,007.7 billion is 36.2% of total annual GDP of $27,610.1 billion.
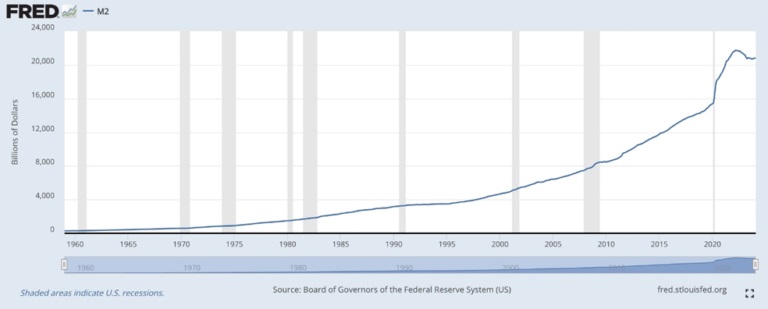
How has the government paid for these expenditures? By printing money, of course, and issuing bonds, i.e., government debt. M2 money supply was about $1,450 billion in 1979 and it currently sits at $20,783 billion.
Source: FRED
The federal government is running a cumulative deficit of $1.1 trillion so far in FY2024, $46 billion more than the same period in the prior fiscal year when adjusted for timing shifts (Bipartisan Policy Center).
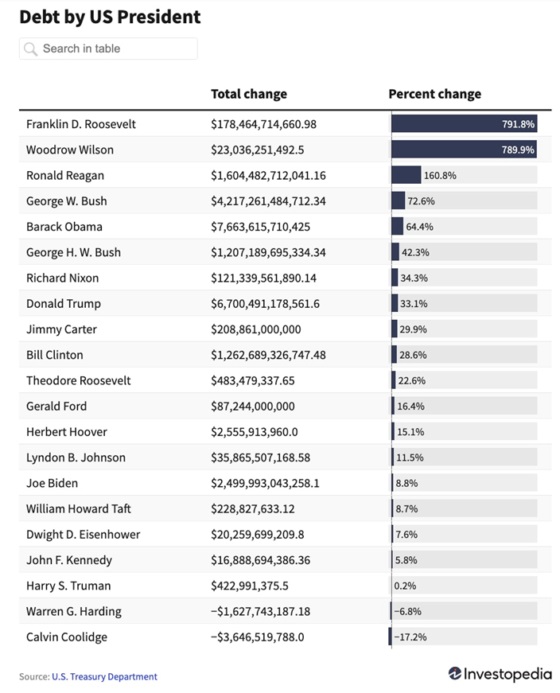
Investopedia reports the US national debt continues to rise under the Biden administration, increasing $6.24 trillion since Biden took office in 2021, largely driven by covid-19 relief measures. According to the Congressional Budget Office, Biden’s American Rescue plan will add $1.9T to the $34 trillion national debt by 2031.
His bipartisan infrastructure spending bill is estimated to cost around $375 billion over the next 10 years. Biden’s Inflation Reduction Act, which aims to invest in green energy initiatives and reduce health care costs, could actually reduce the deficit by $58B over the next decade according to the CBO.
However, new spending includes a $250 million aid package to help Ukraine in the ongoing conflict with Russia. This figure is in addition to the $75 billion in assistance already sent by the US to Ukraine between January 2022 and October 2023. (Investopedia) And there is the almost $100B being voted on today in military aid for Ukraine, Israel and Taiwan.
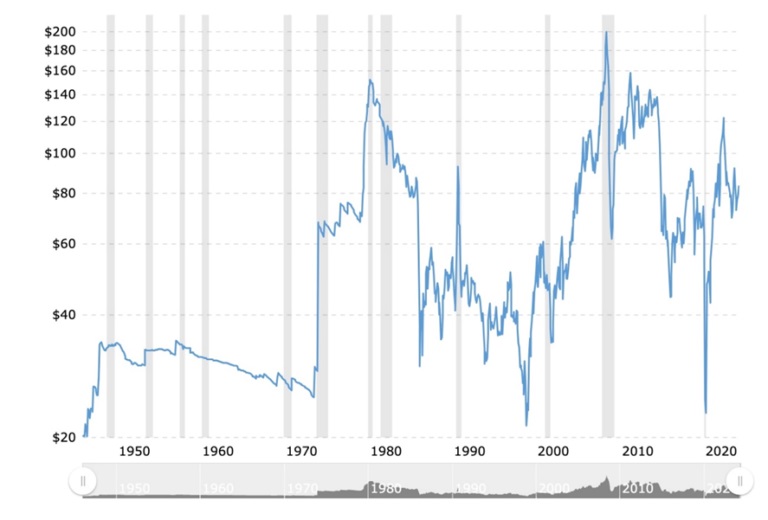
Commodity prices were generally stagnant in the late 1970s except for crude oil, which in early 1977 was about $73 a barrel, but by June 1980 has risen to $179.19 — the second-highest oil price behind the all-time high of $199.78 reached in June 2008, during the financial crisis.
In April 2022 after the Fed started raising interest rates, WTI crude oil was at $113.07. While it fell to $69 in May 2023, crude is back up to $82.86, as of April 19.
Source: Macrotrends
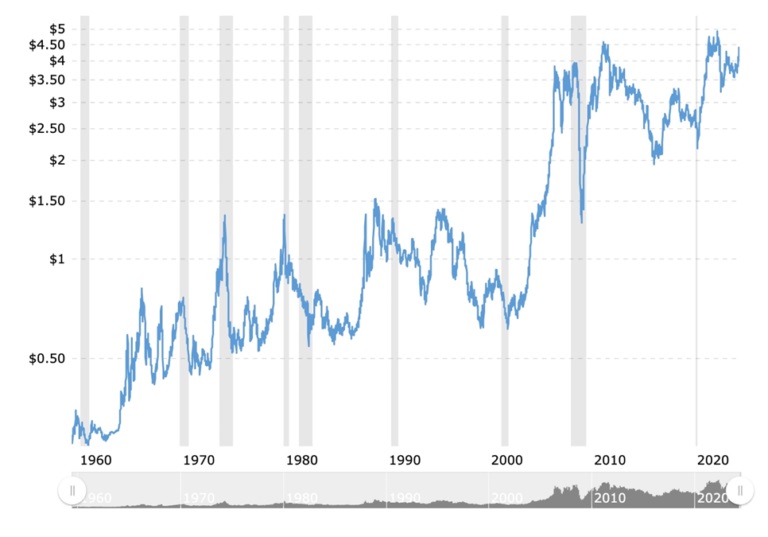
The copper price started 1977 at around 67 cents, and hit a 1980 peak of $0.99 on March 10. While copper fell to $3.40 a pound in October 2022, it has been rising of late, and currently sits at $4.48/lb.
Source: Macrotrends
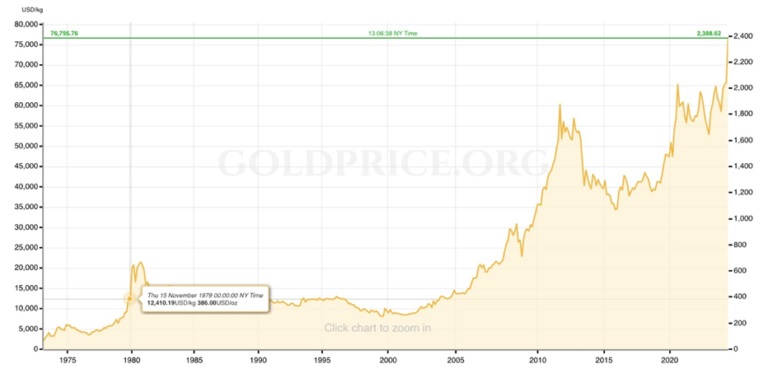
Gold, traditionally bought as a safe haven against economic turmoil, should have reacted to the low dollar in the late ‘70s, and it did. The precious metal started 1977 at around $132 an ounce, and steadily rose during the inflationary next two years. It hit a peak of $673 in September 1980, before falling back. Gold wouldn’t begin its next bull run for another two decades. It went from $282 in January 2000 to $1,873 in September 2011, a gain of 500%. Fasting forward to today, gold is up 16% to $2,388.10, at time of writing.
Source: Goldprice.org
Differences
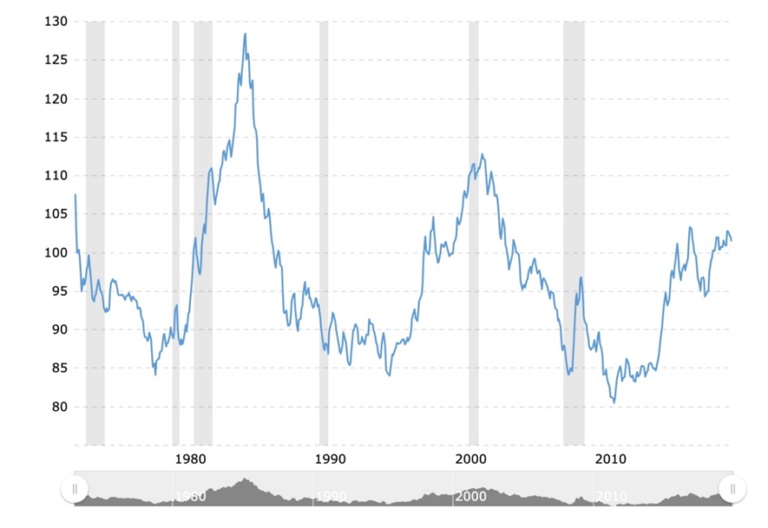
The dollar is one of the differences between the economic conditions of the late 1970s and now. Slow economic growth inhibited dollar strength during the Miller Fed. According to a historical dollar index (DXY) chart, the index was around 86 to 90 during those two years, compared to DXY’s current 106. The dollar’s value against a basket of other currencies has increased from about 99 in March 2022, when the Fed started raising interest rates, to the current 106, an increase of about 7%.
Source: Macrotrends
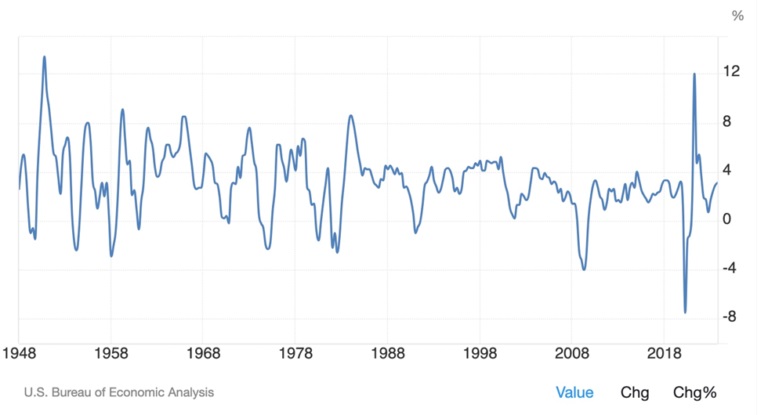
Economic growth in the United States is currently rising, in line with a resurgence in manufacturing, whereas in 1978-79 it was stagnant. According to a long-term US GDP growth chart, the economy was growing at 3.2% in the first quarter of 1977, and by the end of 1979 it had shrunk to 1.3%.
Global manufacturing recovery underway, can it last?
Source: Trading Economics
In the fourth quarter of 2023, the latest numbers available, US GDP was growing at an annual 3.4%, slightly below the forecasted 3.3%.
Conclusion
Has the US Federal Reserve done enough to reduce inflation, which would trigger a much-needed interest rate cut that would help millions of Americans who are paying high interest rates on mortgages, loans, credits cards and lines of credit? All the while contending with inflated prices at the grocery store and the gas station, among other places?
The news on this front isn’t good. Wall Street analysts now say a rate cut isn’t coming until September, and some believe it won’t happen at all this year.
We previously suggested that interest rates could rise, due to a failure by the Powell Fed to meet its 2% inflation target. We’re sticking to that hypothesis. In fact this analysis only strengthens the notion that the worst may be yet to come regarding interest rates.
Don’t be surprised if the Fed raises interest rates
Consider: inflation has been rising since January yet the economy is in great shape, posting low unemployment numbers and growth in quarterly GDP. The US dollar is strong and bond yields are approaching 5%. The usual indicators of an economy in trouble are just not there. In fact there appears to be resurgence in manufacturing which is spurring demand for metals including copper.
Gold recently hit a new record and continues to trade above $2,300, supported by central bank buying and physical gold buyers, particularly in Asia.
Is Fed Chair Jerome Powell William Miller? Talking metaphorically of course. There are similarities. Like Miller, Powell has been very careful about raising interest rates, doing so gradually, unlike the jolts inflicted on the market by Paul Volcker, who hiked interest rates past 20% causing back-to-back recessions in the early ‘80s.
But Powell is different from Miller in that he believes in squelching demand by raising rates. Miller was afraid to do that because it would lower economic growth. The modest interest rate hikes he implemented did little to quell inflation, same as Powell’s raises today have failed to quell inflation. Killing inflation required much stronger medicine in the form of Volcker’s rate hikes.
If today’s inflation proves impossible to tame, supercore, housing, food and energy are starting to surge again, will Powell do a Volcker? Well, spending under Biden will not slow down with another term, and Trump has shown himself to be almost as big a spender.
The economy of the late ‘70s is similar to today in that we have rising inflation, high oil prices (though nowhere near records), and prodigious government spending/ money-printing.
Like in the late ‘70s, gold prices are surging higher.
Yet today the dollar is strong whereas in 1977-79 it was weak. The US economy 50 years ago was struggling whereas today it appears to be booming, despite high borrowing costs and lingering inflation.
The job market is healthy, whereas in the 1970s it was sick, and got sicker during the two recessions of the early 1980s.
Our conclusion is that we are in uncharted territory. Everything, including gold, copper, the dollar, interest rates, and inflation is going up. It’s a trend for which there appears to be no historical precedent — apart from the fact that higher interest rates, though painful, eventually lead to the desired result of bringing inflation back into line.
Richard (Rick) Mills
aheadoftheherd.com
subscribe to my free newsletter
********

