Handling a 100% electric vehicle (EV) scenario will require significant upgrades and modifications to the existing electric grid, but how much? And how does that compare to historic grid growth? We’ll start with an estimate of the additional grid capacity needed for a fully electrified light-duty vehicle (LDV) fleet in the US and then compare that to historic grid expansion to get an idea of how disruptive this conversion will be.
Additional energy needed for 100% electric vehicle fleet
We’ll start with an aggressive but achievable conversion to 100% electric vehicles by 2040. To make a rough estimation of the resulting grid demand, we need to multiply total vehicle miles traveled times energy used per mile. A reliable source for vehicle miles traveled is the National Transportation Statistics report issued by the U.S. Department of Transportation, Bureau of Transportation Statistics. Table 1-35 — U.S. Vehicle-Miles lists miles traveled for a full range of vehicle types. For this article, we’ll focus on “light duty vehicles,” which includes cars and trucks, and use the most current data from 2021.
There is a wide range of electric vehicle sizes and powertrain designs with a range of efficiencies. I chose 360 Wh/mile, which happens to be the average used by our Tesla Model Y over 47,000 miles between September 2020 and April 2023. This vehicle is a mid-sized crossover format that is mid-range between a compact economy car and a full-size pickup. Our vehicle use is 18,000 miles per year, with a lot of high-speed freeway driving and covering three winters (in Minnesota) and two summers — so it is higher than typical for this vehicle. As with an internal combustion vehicle, energy use/mile includes all energy uses, from moving the vehicle down the road, to climate control, battery conditioning, and all other energy used by the vehicle when driving.
Using current data as inputs avoids trying to predict the future regarding both personal transportation use and the efficiency of future electric vehicles. We’ll also add a charging efficiency value of 90%, which is a reasonable estimate of the difference between what is put into the vehicle when charging and what it uses for driving, to better represent grid demand (charging energy). Vehicle energy used in driving is divided by this number to produce the equivalent charging energy.
With all inputs determined, we are now ready to calculate the total additional grid capacity needed for a 100% electric light duty vehicle fleet in the U.S.
Some 835,000 odd GWh sounds like a lot, which shouldn’t be surprising since it replaces a large percentage of crude oil mining, transportation, refinery operation, fuel distribution, and combustion in vehicles needed to operate today’s internal combustion light-duty fleet.
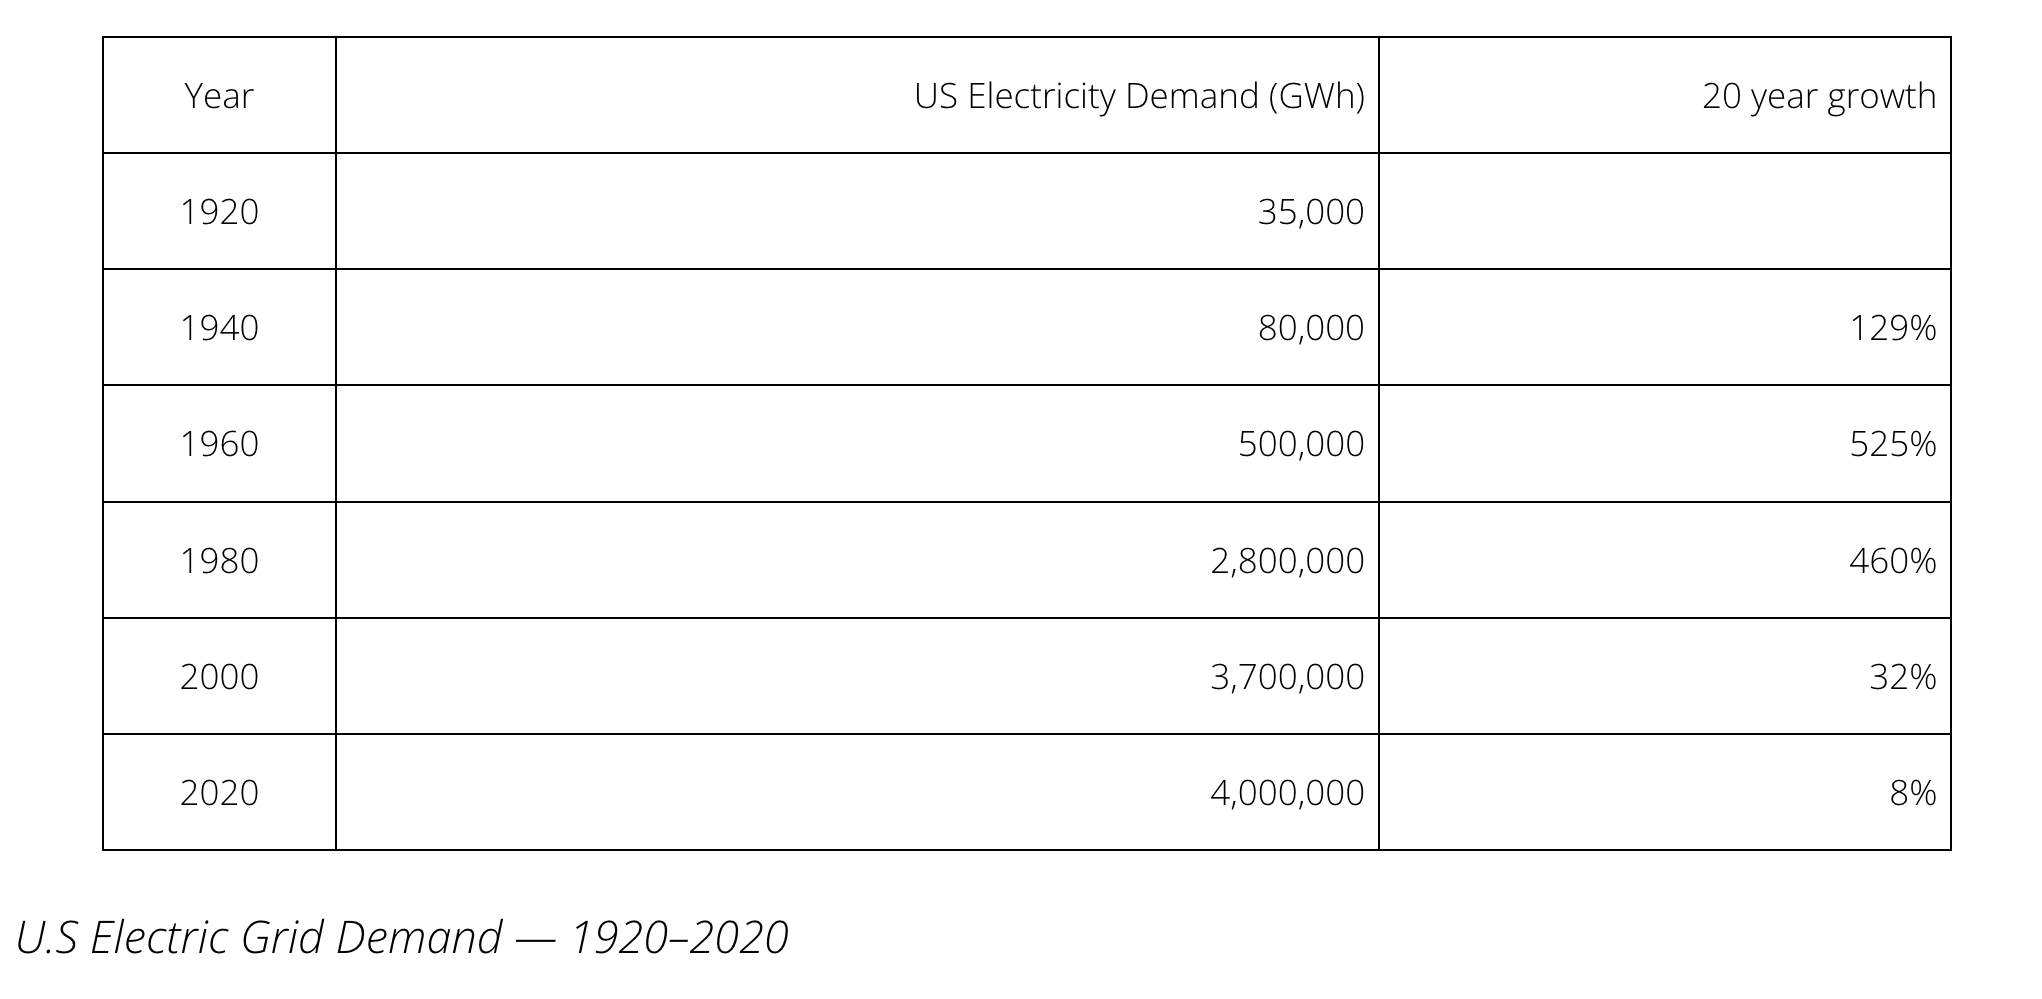
To get a sense of the magnitude of the needed additional grid capacity, we will: 1) add this amount to 2020 grid demand to simulate 2040 demand, 2) calculate the percentage of grid demand growth, and 3) compare the magnitude of historical growth in US electricity demand over 20 year periods from 1920 to 2020. This period covers over 99% of the US grid buildout to date.
US grid demand growth over time
The US electric grid has undergone continuous growth and improvement since creation in the late 19th century. Population growth, economic development, new electricity end-uses, and technological advancements (efficiency, smart grid) have all been major drivers. The following table lists approximate US electric grid demand in 20 year increments over the last 100 years.
There are several interesting things to note in this table. First, the average growth in the 20-year periods shown has been over 200%. This growth has slowed in recent decades, but earlier growth shows what the US is capable of when economic conditions are right. With this historical information, we are now ready to put the 100% EV vehicle fleet in the context of the incremental grid growth needed to support it.
100% electric vehicle grid demand in context
Adding the incremental demand from a 100% electric LDV fleet of 835,000 GWh/year to the 2020 estimate and applying that to 2040 grid demand yields a 20-year growth of 21% as shown below.
Twenty-one percent growth equates to a compound annual growth rate of just 0.95%. As the historic demand growth table above shows, only the most recent period had lower than 20% growth (8%). All prior periods were higher, and the average 20 year growth rate over 100 years from 1920–2020 was 230%.
Takeaways and additional factors
Clearly, the answer to the question posed in the title is: “Easily, even with US economic investment in the grid well below the historical growth rate.” But there is a full range of additional opportunities beyond just building enough additional grid capacity to handle the increase in electricity demand from 100% LDV electrification.
Consider the following:
- Electric vehicles can be programmed to charge when grid demand from other loads is low (demand response).
- Electric vehicles are primarily charged at home, where installing solar panels can enable charging directly with solar power with no net load on the grid.
- Electric vehicle batteries store enough energy to supply a typical home for several days.
Only existing, mature technologies are needed for all of these, which means only regulatory barriers and business inertia in the energy and transportation sectors stand in the way. The above and other factors will be explored in Part 2.
This post originally appeared on Let’s Go Zero Carbon.
Sign up for daily news updates from CleanTechnica on email. Or follow us on Google News!
Have a tip for CleanTechnica, want to advertise, or want to suggest a guest for our CleanTech Talk podcast? Contact us here.
Former Tesla Battery Expert Leading Lyten Into New Lithium-Sulfur Battery Era — Podcast:
I don’t like paywalls. You don’t like paywalls. Who likes paywalls? Here at CleanTechnica, we implemented a limited paywall for a while, but it always felt wrong — and it was always tough to decide what we should put behind there. In theory, your most exclusive and best content goes behind a paywall. But then fewer people read it! We just don’t like paywalls, and so we’ve decided to ditch ours. Unfortunately, the media business is still a tough, cut-throat business with tiny margins. It’s a never-ending Olympic challenge to stay above water or even perhaps — gasp — grow. So …


