On the heels of last week’s piece “Gold – Fundamentally Fabulous, Technically Torturous“, we’ve given consideration to some infamous tortures foisted upon mankind across the centuries. And how well-documented they are! The exasperating drips of the Chinese Water Torture… the exhausting torture of Sleep Deprivation… and (“Don’t say it!”) yet we must –> the excruciating endlessness of the Tickle Torture, (just to name a few).
But wait, there’s more! Today ’tis the ever-exponential agony of the GPTT: Gold Price Tease Torture! “Oh please mother make it stop!” –[Linda Blair, ‘The Exorcist’, Warner Bros., ’73]
“Well, mmb, there’s also your ‘live’ p/e of the S&P still unsupportably high in the sky as everybody waits — in your own words — ‘for it to all go wrong’; that’s kinda torture too…”
So ’tis, Squire. That price/earnings ratio now at 37.7x keeps clear-cut the case for a comprehensive S&P “correction”. However, there’s a significant difference between the S&P 500 and Gold: whereas the former is fully-engaged, the latter lingers unengaged. Folks follow stocks; few follow Gold. Going by Gallup as of this year, 61% of adult Americans own equities; going by “Gold IRA Guide” as of 2020, just 11% of adult Americans owned Gold. And globally, Gold’s ownership has been cited as less than 1%.
Still for those of us is the Gold know, our so-called GPTT continues blow-by-blow. For nary over a week ago, we were waving Gold’s flag to and fro. And as this past week did unfold, it appeared that Gold finally was on the go. Gold having then settled at 1946, we wrote our song and dance — including in last Tuesday’s Prescient Commentary the anticipation of price reaching the mid-1970s — and come Tuesday the yellow metal had streaked up to 1969 … only to then give it all back and then some by reaching down to as low as 1933 come Thursday.
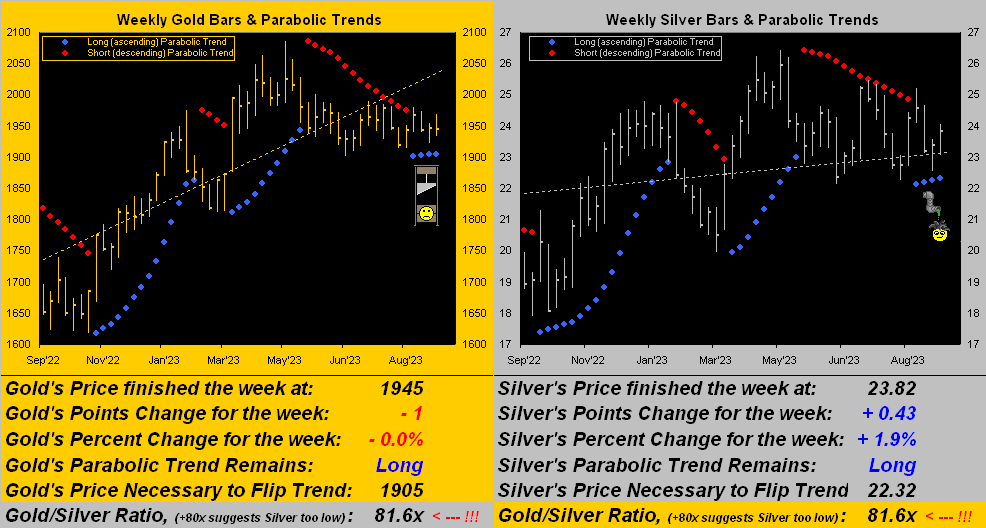
“Blame it on the Fed!“, they say. “The Dollar’s soaring up!”, they say. “Rates’ll never go down!”, they say. Either way, Gold settled the week yesterday (Friday) at 1945 in netting a -1 point loss for the week after tracing therein a high-to-low range of -36 points.  “It’s torrr-orrr-turrre…”
  –[The Cure, ’87]. And yet for both the yellow and white metals, the respective weekly parabolic trends remain Long per their rightmost four blue dots, with Silver actually bettering Gold for the week:
‘Course specific to the Federal Reserve — its Open Market Committee unanimously having voted to maintain the Bank’s Funds Rate in the 5.25%-5.50% target range — one’s take on it in large part is dependent upon one’s FinMedia source. Post-Policy Statement and Powell Presser this past Wednesday, if sourcing from Dow Jones Newswires, one read that “Fed predicts ‘soft landing’ for the economy — low inflation and no recession.” If instead sourcing from Bloomy, one read that “Stocks Fall as Yields Rise on Fed’s ‘Hawkish Skip’.” So which is it? Any wonder the precious metals are directionally confused? Fortunately for them, the math will out. To wit:
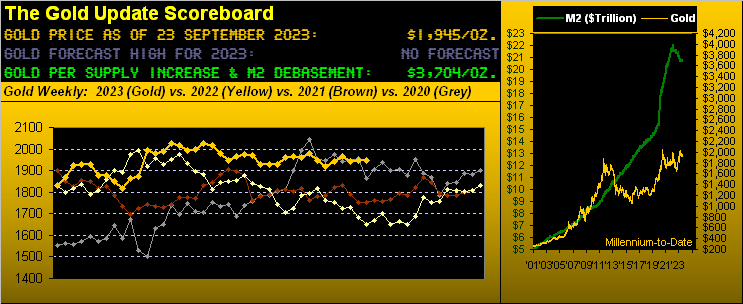
Per the opening Gold Scoreboard, albeit with price at a lowly 1945, valuation today is 3704, (i.e. +90% higher). Moreover, if you love Sister Silver, here’s the fun part: whilst settling the week at 23.82, given the century-to-date average Gold/Silver ratio being 67.7x, when applied to Gold’s valuation of 3704, that values Silver at 54.71! 130% higher! “What’s in your vault?” Nothing confusing there.
As to the StateSide economy, our Economic Barometer turned in a confusing week. Just eight metrics arrived, the best being August’s increase in Building Permits, and the worst ironically being August’s Housing Starts. Go figure, the Baro basically drawing a blank for the week:
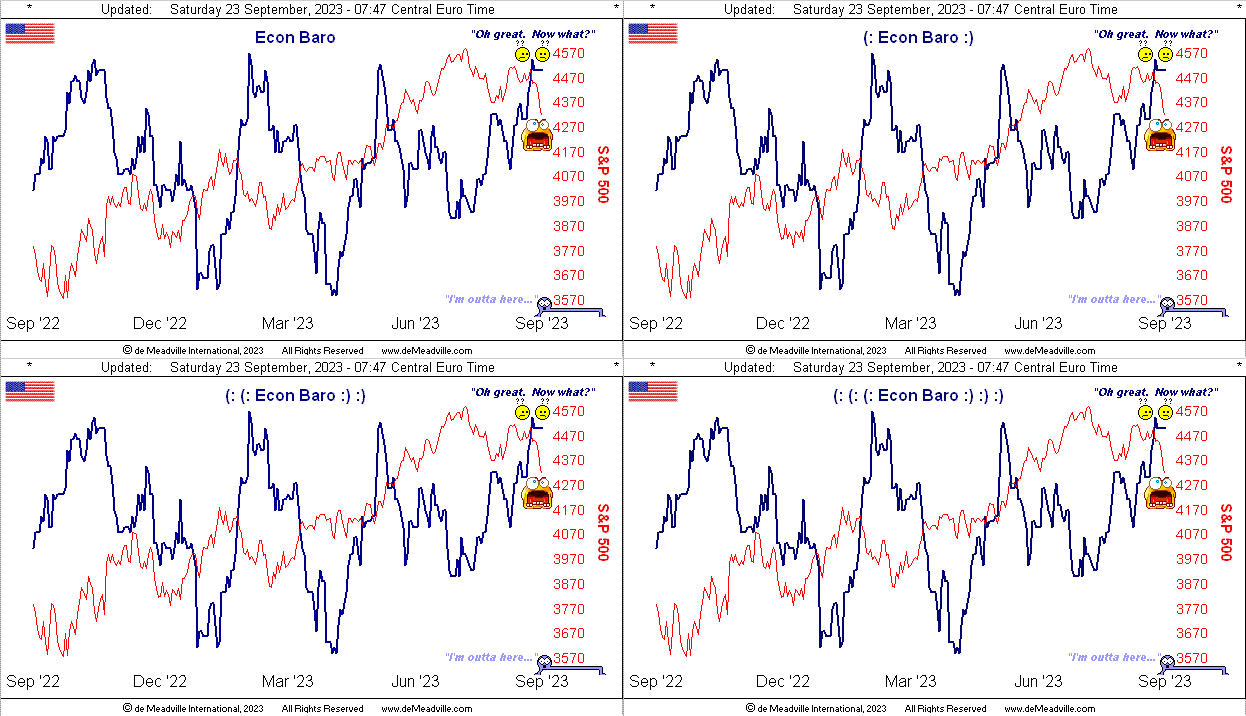
As for the S&P (4320) -6.2% from its year-to-date high (4607 on 27 July) — or if you prefer -10.4% from its all-time high (4819 on 04 January 2022) — everyone wants to know “Why?“ The obviously answer (as we simply practice the otherwise archaic science of math) is that price vis-à-vis earnings is historically excessive. The average p/e of the Top Ten cap-weighted S&P 500 constituents (AAPL, MSFT, AMZN, NVDA, TSLA, GOOGL, GOOG, META, LLY and UNH) right now is 51.5x. Remember (ad nauseum) ol’ Jerome B. Cohen? “…in bull markets the average level would be about 15 to 18 times earnings.”
Other answers as to “Why?“ may include it seasonally being September, considered the year’s notoriously worse stint.
Or that the S&P’s all-risk yield of 1.582% is absurd to abide given the risk-less U.S. three-month annualized T-Bill yield of 5.305%.
Or that ’tis better to get one’s money out of stocks given the market capitalization of the S&P 500 is now $37.7T versus a U.S. liquid “M2” money supply of just $20.7T. Remember ol’ Egbert? “Hey Mabel! I sold some stock but the broker says they don’t actually have the money to pay us!” That shan’t be good.
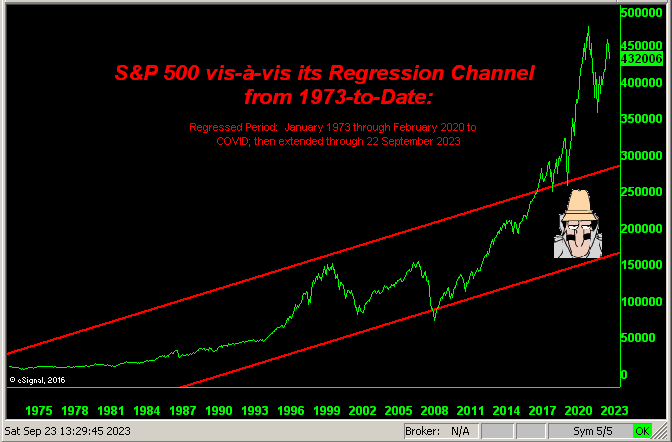
Or there’s the market overall pricing excess thanks to COVID and the Fed: recall the S&P’s regression growth channel had said “pandemic” not occurred? And further how the increase in the market capitalization of the S&P 500 equaled the monetary creation by the Fed to counter COVID? Here’s that updated graphic:
‘Course, just as the S&P rocket-shot was fostered by the Fed’s monetary injection, the market has since been somewhat succumbing via the Fed’s monetary withdrawal (which commenced in the week ending 2 April a year ago). Or in the words of Inspecteur Clouseau: “Out with zee bad air [equities] and in with zee geuuud [yield]…” And that’s quite a drop from today to the channel were the Fed to so drain…
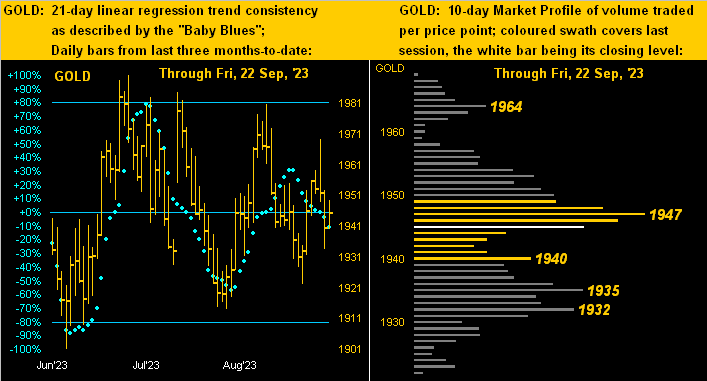
However through it all, the precious metals remain torturously tepid. Indeed were Charles Dickens around today to pen a book on Gold and Silver, ‘twould well be titled “Great Expectations, Part Deux”. Or more realistically given our two-panel graphic with Gold’s daily bars from three months ago-to-date on the left and 10-day Market Profile on the right, “What Expectations?”:
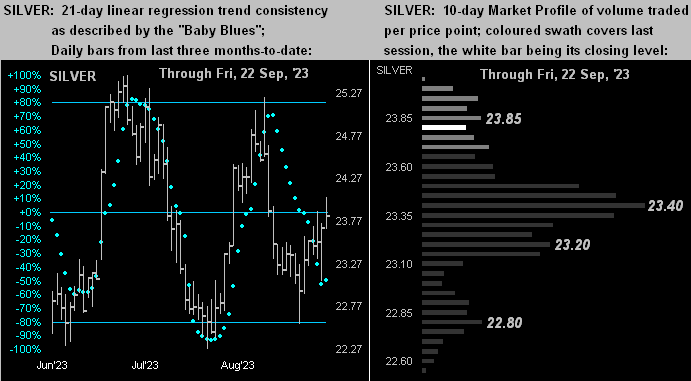
Silver as aforementioned is performing a tad better than Gold per the white metal’s like bars (below left) and Profile (below right). At least she is adorned in her precious metal pinstripes rather than in her industrial metal jacket. From her intraday low of 22.56 on 14 September she is now +5.6% higher, whereas Cousin Copper from his high a day later of 3.85 on 15 September is now -4.2% lower at 3.69. Stay your pinstripes pursuit, Sister Silver!
Torturous as may be this read, this let’s close with a notable FinMedia musing from late in the week: ’tis the notion that the Fed’s so-called “neutral rate” (i.e. inflation-adjusted lending rate) may have to naturally rise going forward. We wonder if this is to cover for the Fed having creamed the Dollar — increasing its “M2” supply by +42% or some +$6.6T from March 2020 into April 2022.
And yet specific to the Dollar Index, it has nonetheless risen from March 2020 (then 98.05) to 105.29 today. Either “the more there are, the more they’re worth” — else the offsetting currencies, substantively the €uro and ¥en — have been strained and puréed: which of course is the case. The €uro (that surprisingly has lasted more than four years) has gone from costing $1.104 in March 2020 to as low as $0.959 a year ago; (’tis today $1.068 as it now pays an interest rate). But pity the poor ¥en! From 107/$ in March 2020 to a vacation-worthy 146/$ today!
Cue Deep Purple from back in ’73 with “My Woman from Tokyo” 

Regardless of where your sun rises, when it comes to currency chaos, torturous as ’tis, where else would you rather be? Gold and Silver obviously!
Cheers!
…m…
www.TheGoldUpdate.com
www.deMeadville.com
and now on Twitter(“X”): @deMeadvillePro
*********

