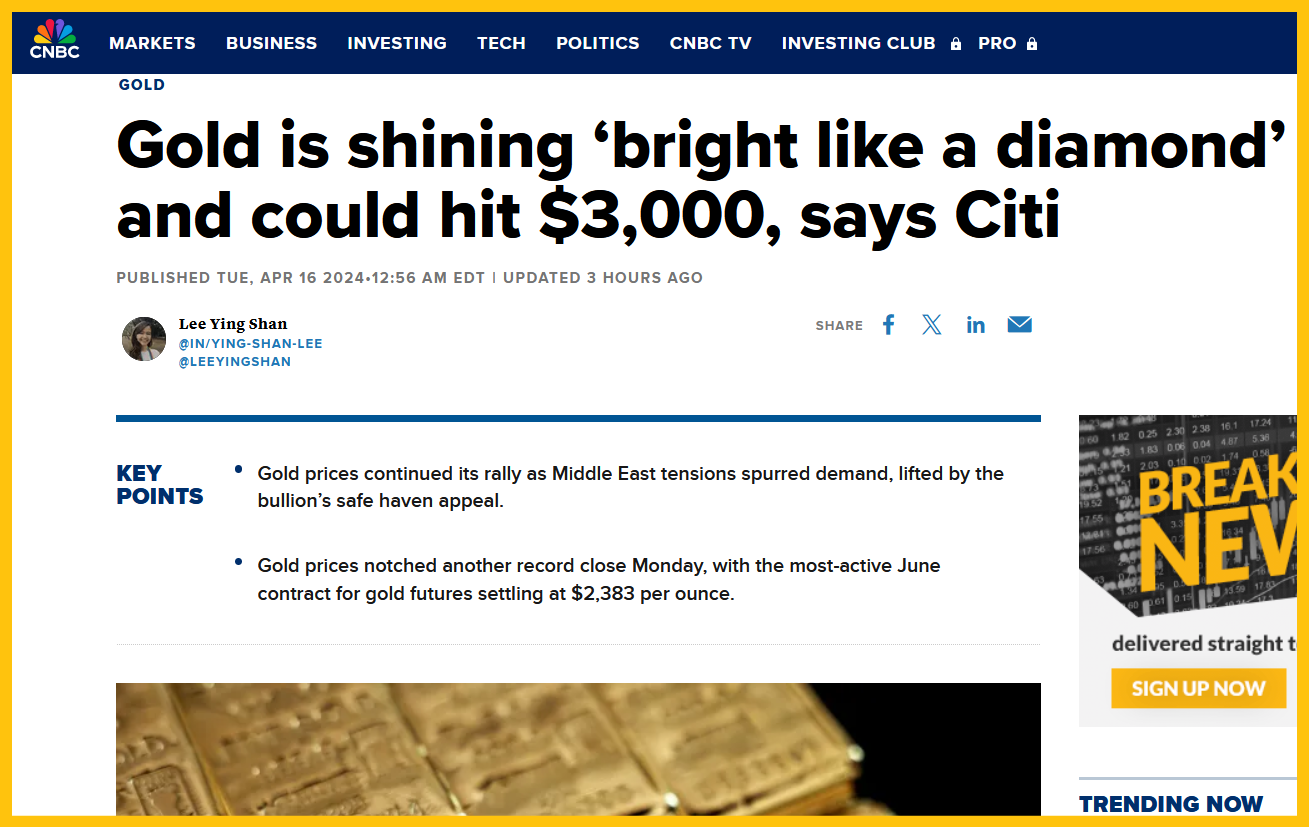
Mainstream analysts are becoming more excited about gold… even as it becomes technically overbought on the daily and weekly price charts.
Most Wall Street analysts failed to project the current rally. Are they wrong again now, or is gold set to keep rallying in its overbought state?
This is a spectacular weekly gold price chart. Both RSI and Stochastics are clearly overbought…
But if the fundamentals are strong gold can continue to rally for weeks, months, or even years while staying technically overbought.
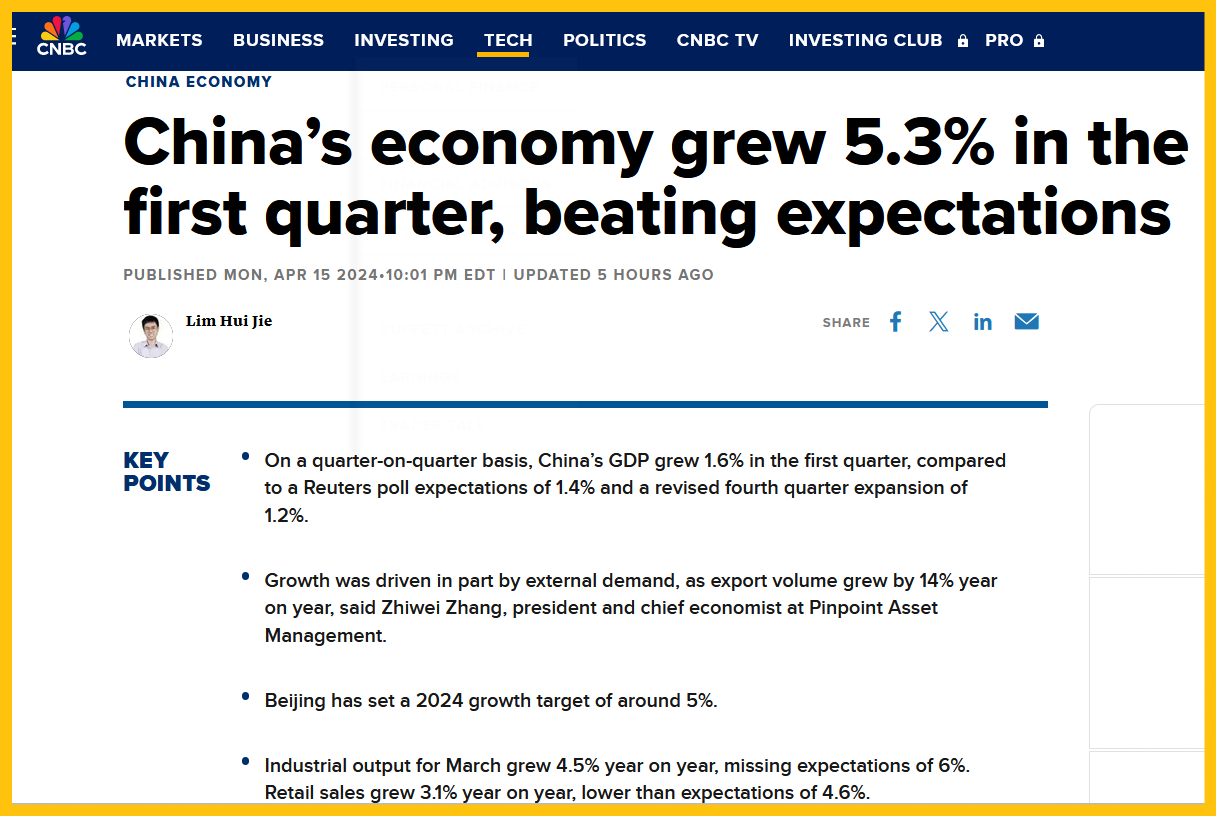
Two of the big drivers for gold right now are the citizens of China and the 2021-2025 global war cycle.
While total GDP is solid, Chinese retail sales are soft, the stock market and real estate are weak, so citizens there are focused on gold and silver for safety and growth.
While Israeli and Iranian war mongers are unlikely to get out of control, there’s enough animosity and action between them to keep Western gold market analysts in a bullish stance.
The US government’s failed war in Ukraine could become a bigger quagmire if congress borrows more fiat and uses it to prolong its proxy fight against the Russian government.
Gold would likely then begin a charge towards $3000.
The dollar is collapsing against ultimate money gold… and another leg down is at least as likely as a technical bounce.
On past meltdowns, the dollar hasn’t shown any technical rally after the initial collapse; it keeps falling into the abyss for months… and sometimes for years!
Short-term tactics?
There are weak H&S tops appearing on the gold ETF hourly price charts, but unless the necklines break ($2320 for gold itself), gold, silver, and the miners likely continue their “upside rampage”.
While a pullback of size looks increasingly unlikely, if it does happen, investors can do some aggressive buying in the $2200-$2050 zone.
Western analysts tend to focus on silly price targets (that are mostly wrong) while 3 billion Eastern citizens are focused on getting more gold. The bottom line:
Western gold bugs should ignore the analysts, focus on the actions of their Eastern brethren, and compete with them to get as much gold on sale as they can!
A daily focus on the big picture is critical for investors as inflation, recession, the 2021-2025 war cycle, a wildly overvalued stock market, debt ceiling horror, and empire transition dominate the investing landscape. I cover this big picture 5-6 times a week in my flagship Galactic Updates newsletter. At $199/year, investors feel the price is too low, but I’m offering a $179/15mths “special offer” that investors can use to get in on the winning action and meticulous analysis. Click this link to get the offer or send me an email and I’ll get you a payment link. Thanks!
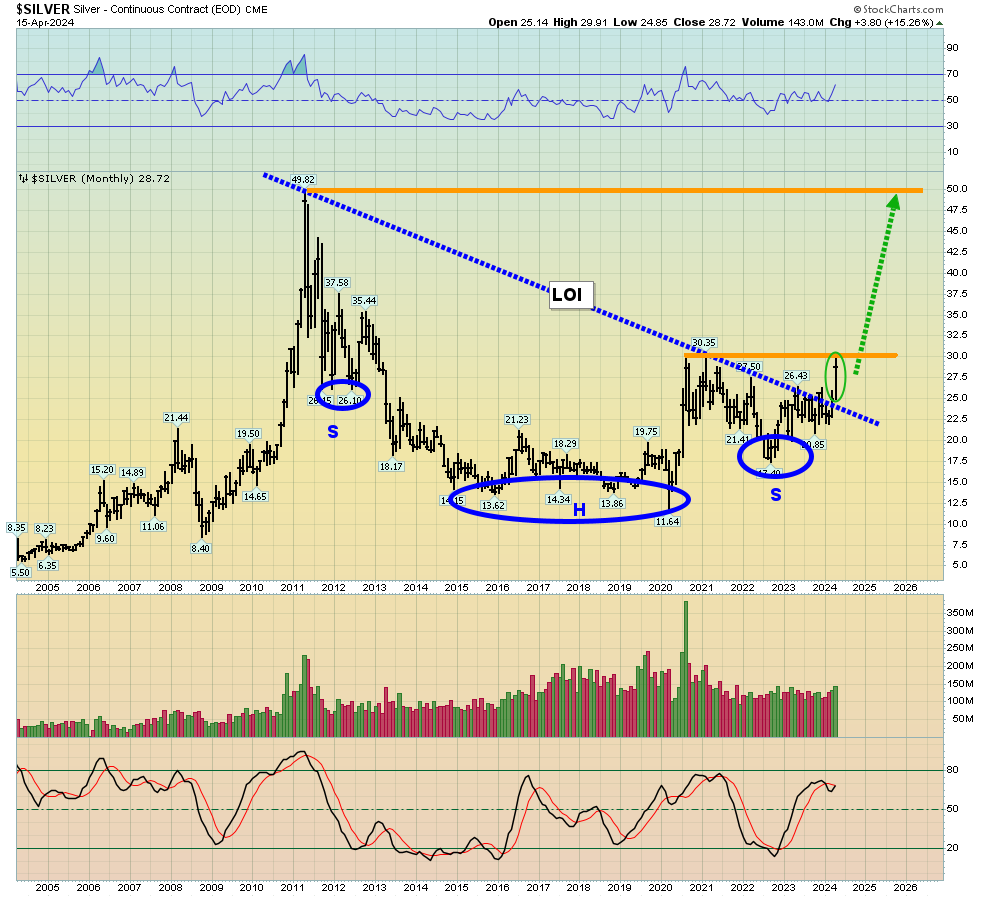
There’s no question that this long-term silver chart is one of the most spectacular charts on the planet.
Note the “LOI” (line of importance). It’s drawn a bit differently than the classic inverse H&S neckline…
But it is even more important than the neckline as it ushered in the thunderous breakout and rally from what is one of the largest base patterns in the history of markets!
Rather projecting price targets for “big fiat profits”, this beautiful chart beckons silver bugs to focus on the “GMS” (Get More Silver!) theme that is embraced with gusto by citizens of China and India.
What about the miners?
Double-click to enlarge this interesting GDX daily chart. Note the double-bottom action in February-March in 2023 and the same action in 2024.
The technical action is similar, but the fundamental drivers have changed; in 2023 analysts assumed that rate hikes from the Fed would slay the US inflation dragon.
Now, recent reports (including the “supercore” number that is close to 8%) suggest the inflation is much stickier than expected… and it’s the type of inflation that’s resistant to rate hikes.
Rather than swooning into October like they did in 2023, gold and silver mining stocks are more likely to have little more than a pullback that forms a right shoulder of a big inverse H&S pattern, followed by a surge to $40-$45, basis GDX. Western money managers are becoming frustrated with their stock market, the crypto ETF-themed rally has fizzed, and they are impressed with action of the miners. The bottom line: Good gold stock times are here, and a lot more may be near!
Thanks!
Cheers
St
Special Offer For Gold-Eagle Readers: Please send me an Email to [email protected] and I’ll send you my free “Get Jacked With J!” report. I highlight key GDXJ stocks that could surge after Fed man Jay’s speech this week! Both core and trading position tactics are included in the report.
Stewart Thomson
Galactic Updates
Note: We are privacy oriented. We accept cheques, credit card, and if needed, PayPal.
Written between 4am-7am. 5-6 issues per week. Emailed at aprox 9am dailyhttps://www.gracelandupdates.com/
Email:
Rate Sheet (us funds):
Lifetime: $1299
2yr: $299 (over 500 issues)
1yr: $199 (over 250 issues)
6 mths: $129 (over 125 issues)
To pay by credit card/paypal, please click this link:
https://gracelandupdates.com/subscribe-pp/
To pay by cheque, make cheque payable to “Stewart Thomson”
Mail to:
Stewart Thomson / 1276 Lakeview Drive / Oakville, Ontario L6H 2M8 Canada
Stewart Thomson is a retired Merrill Lynch broker. Stewart writes the Graceland Updates daily between 4am-7am. They are sent out around 8am-9am. The newsletter is attractively priced and the format is a unique numbered point form. Giving clarity of each point and saving valuable reading time.
Risks, Disclaimers, Legal
Stewart Thomson is no longer an investment advisor. The information provided by Stewart and Graceland Updates is for general information purposes only. Before taking any action on any investment, it is imperative that you consult with multiple properly licensed, experienced and qualified investment advisors and get numerous opinions before taking any action. Your minimum risk on any investment in the world is: 100% loss of all your money. You may be taking or preparing to take leveraged positions in investments and not know it, exposing yourself to unlimited risks. This is highly concerning if you are an investor in any derivatives products. There is an approx $700 trillion OTC Derivatives Iceberg with a tiny portion written off officially. The bottom line:
Are You Prepared?
********


