 Gold has had quite a run for 2024, up over 25% year to date as this article is going to press in late-December. Will the advance continue in 2025? Or will the new year see a reversal for gold prices after 2024’s strong performance?
Gold Rising Trend Until Proven Otherwise
Gold is within a clear rising trend, which began at the 2022 low of $1,615 per ounce. According to the principles of technical analysis: “A rising trend is valid until proven otherwise.” In this article, we will examine the price levels which will show us that gold’s rising trend is still intact for 2025.
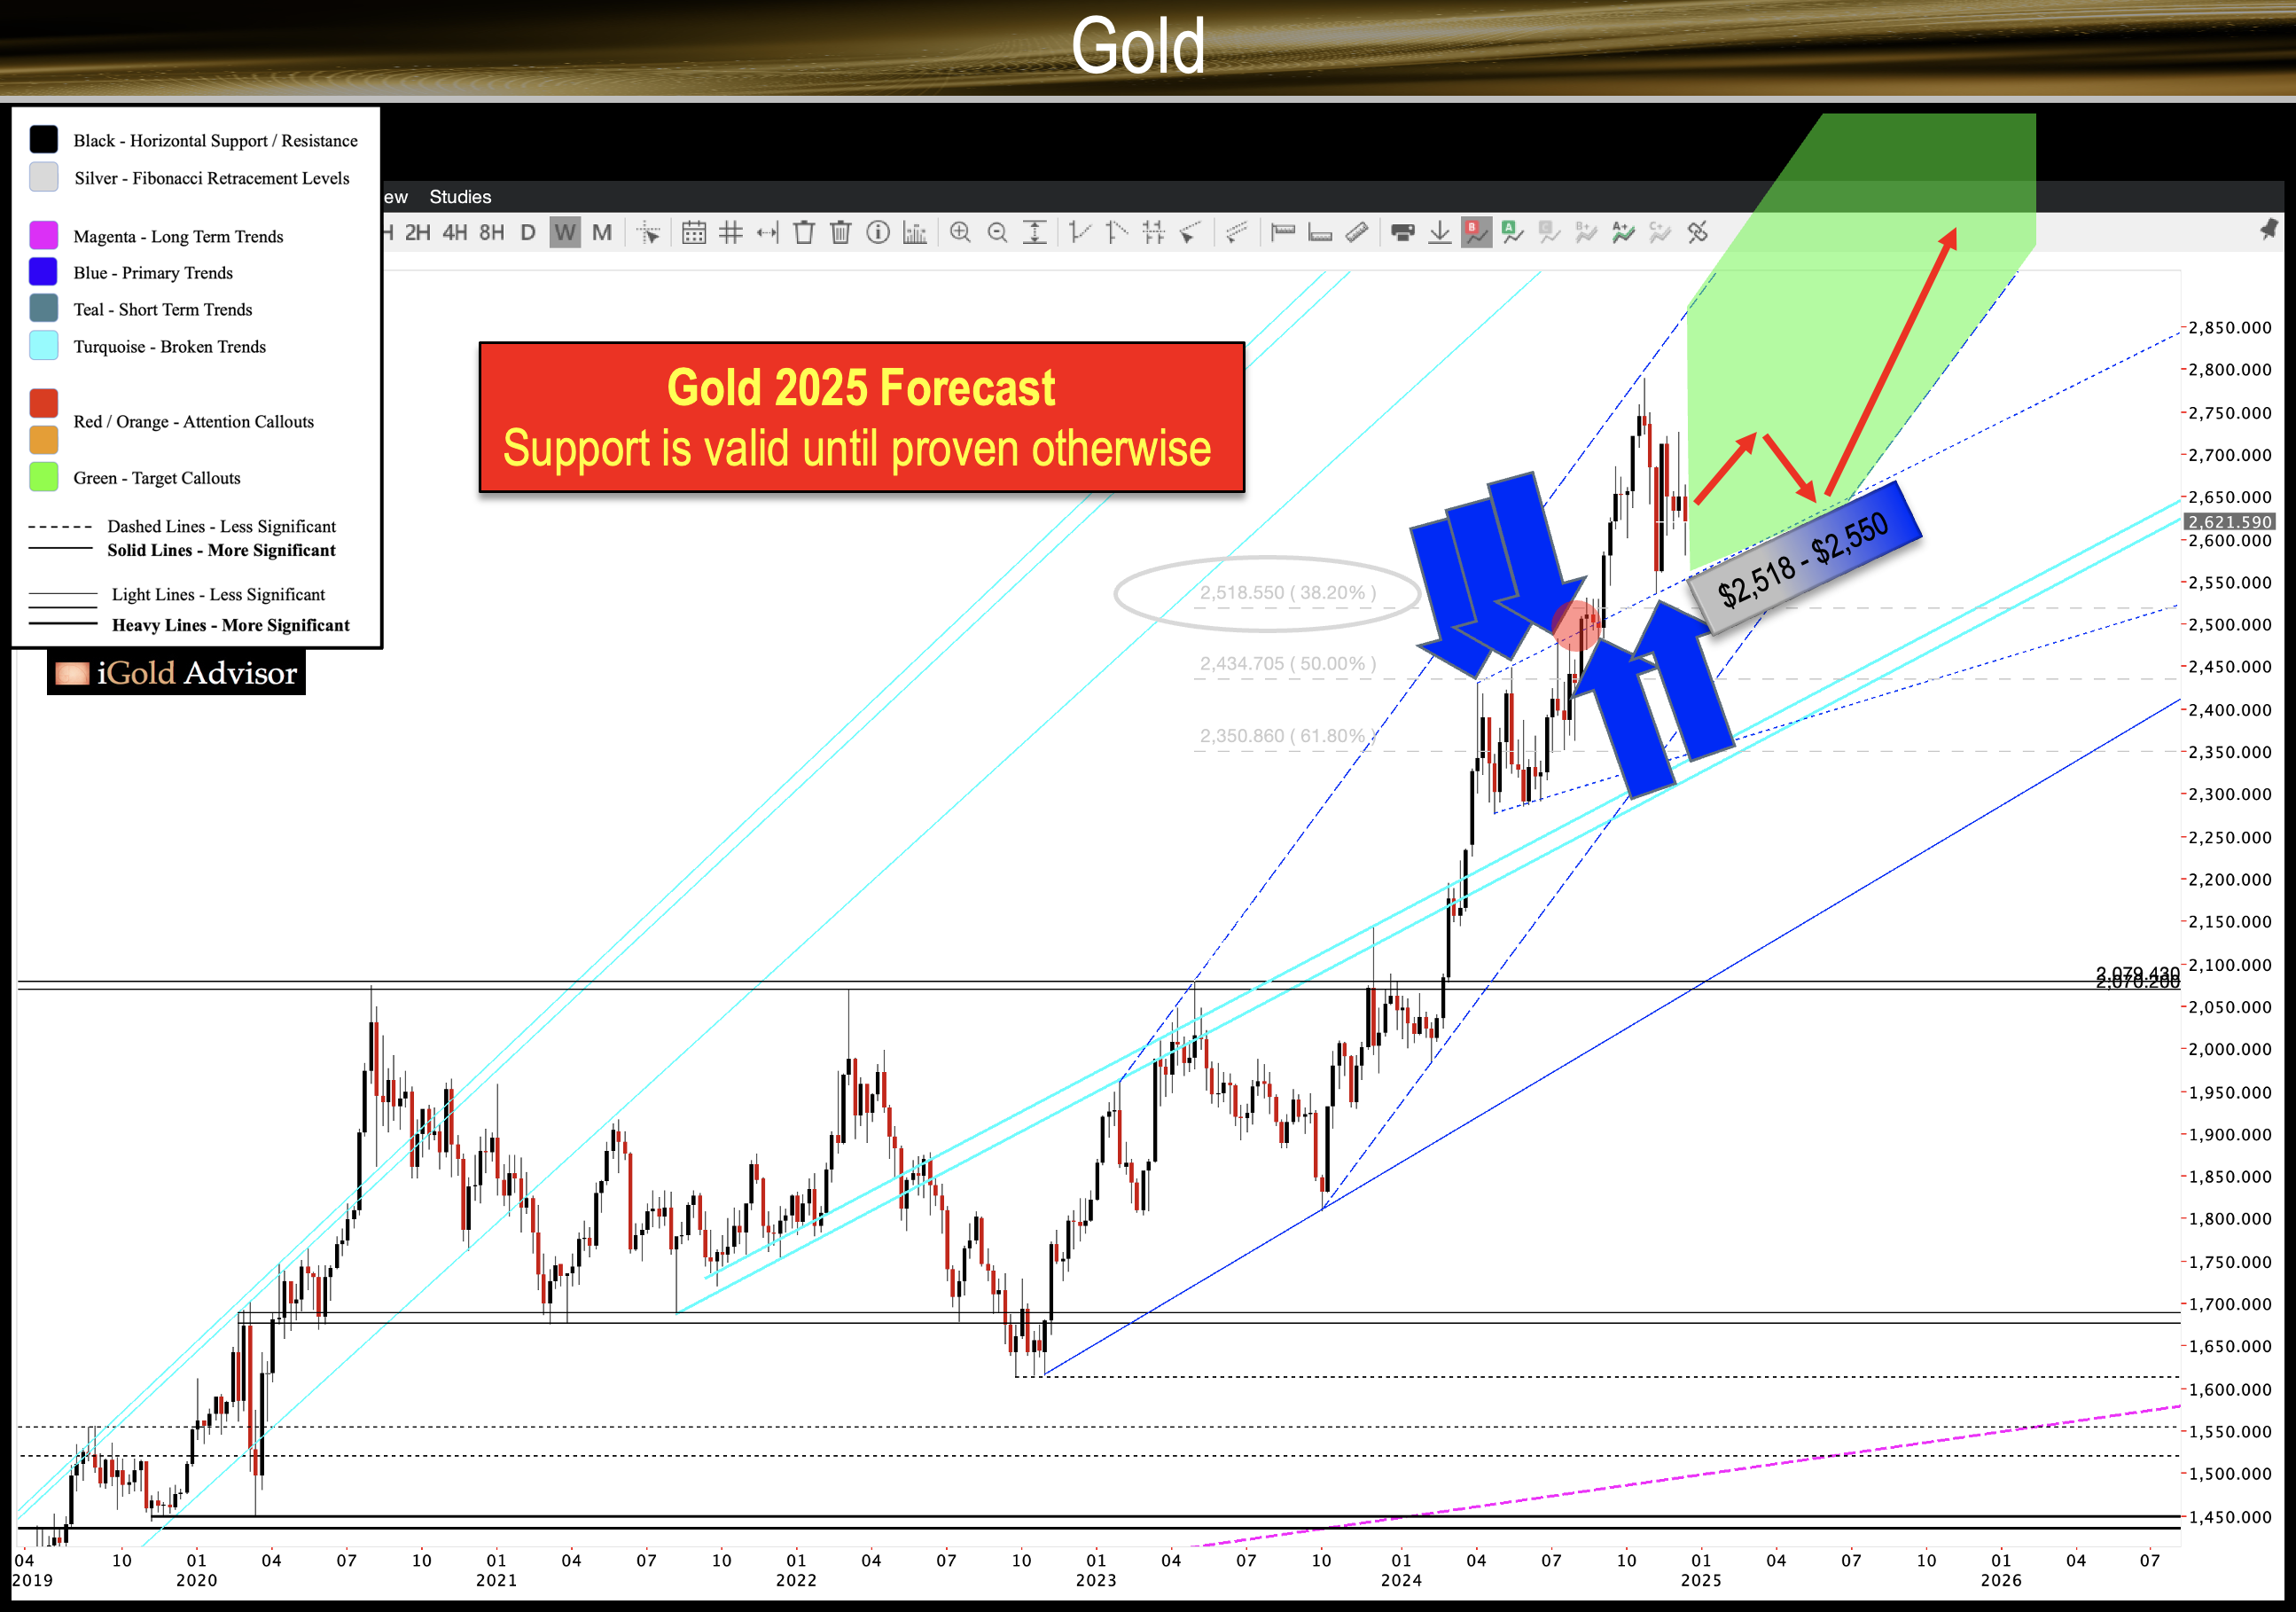
To do so, we will refer to the chart below:
First, notice the series of reaction highs (blue arrows) which began to form after gold broke out above its four-year resistance of $2,075 in March. A series of three reaction highs (blue arrows) formed sequentially in April, May, and July – all along a gently-sloped rising trend. This rising trend defined a resistance boundary.
Next note how gold finally broke higher from the rising resistance in August (red circle). Following such, on two separate occasions, this former resistance acted as support (blue arrows), thus illustrating the classic technical analysis principle that resistance, once broken à tends to act as support.
This now-rising support presently comes in at $2,550 per ounce in the spot market. In technical analysis, remember that support is valid until proven otherwise. Thus, we would expect to witness buyers emerge for gold at $2,550 should price weakness emerge in early 2025.
Note that this support trend is rising slowly as time progresses. Trends are inherently dynamic, so investors must continue to monitor trends as they progress to remain abreast of the most updated figures.
By the start of Q2 2025 this trend of buying support will exist near $2,600 and by the start of Q3 2025 the trend support will appear circa $2,650.
For now, $2,550 is the figure where we would expect to see buyers emerge on the first sign of price weakness.
Additional Fibonacci Support
Additional support for the gold market will exist at the 38.2% Fibonacci retracement of the entire advance following the breakout in March. Fibonacci levels are percentage targets that appear repeatedly in many patterns found within nature, from seashells to hurricanes to galaxy formations. The markets are the sum of human nature, and these percentages tend to exhibit an effect on the markets as well.
Fibonacci patterns found in nature

In the case of gold, the 38.2% Fibonacci retracement of the entire advance following March’s breakout comes in at $2,518 (silver highlight, chart above). This level is only $32 away from the independently-observed rising support already discussed at $2,550.
In technical analysis, when two completely separately-derived support levels exist within a small price band, that support becomes even stronger and more meaningful, and we can generally extend the support to be inclusive of the two levels.
In the case of gold then, we would expect support to exist between $2,518 – $2,550, taking into consideration both support levels.
Gold in 2025
Again, support is considered valid until proven otherwise. It would take dual-weekly closes below the $2,518 – $2,550 support zone to begin to suggest it has been permanently violated, and that perhaps a top is forming in the sector.
Remember, gold is within a rising trend until proven otherwise.
Meanwhile, strong resistance appears for gold in the vicinity of the October peak, which is the current all-time high: $2,789 per ounce.
If we go back and examine the chart, we can see that gold should thus be expected to consolidate above key support, yet below the $2,789 all-time high, into mid-2025. If gold is going to break out to new all-time highs, it will be in mid/late 2025.
In this case, the $2,518 – $2,550 support zone will continue to witness buyers emerge, and these buyers will appear at higher and higher intervals through the calendar year, thus “chipping away” at the resistance zone as time progresses.
After enough gold has been transferred from strong to weak hands, the market will overcome sellers at $2,789, and gold will begin its next leg up toward the lofty $3,000 level by late-year.
Takeaway on Gold Prices
Support is valid until proven otherwise.
Support for gold currently exists in a zone of $2,518 – $2,550; the zone will be rising as the year progresses.
Only a break below this support zone would alert us of a potential top in the gold market.
Barring such, the market should consolidate through the first half of 2025, and prepare for a breakout to new all-time highs above $2,789 as the year culminates.
At www.iGoldAdvisor.com, we update this analysis for our premium subscribers on a weekly basis, so that when key technical levels are exceeded, investors can be aware in sufficient time to act. We invest in physical gold bullion and also gold mining companies, often via private placements, which allow higher net-worth investors to accumulate free warrants in addition to mining shares for the highest upside possible in the gold mining world.
*********


