 Intense Recession Vibes
In recent days, I’ve been getting strong recession vibes from markets. Whether it’s the news sources I’m monitoring or a surge in negative reports, it appears that we are approaching a critical juncture in the economy.
Contrary to my expectations, the Federal Reserve managed to raise rates above 5% without destabilizing the economy. The year-to-date performance of the S&P 500 is a staggering 15%, and many who predicted a recession last year have now become optimistic, advocating for a soft landing or no landing at all.
So, what caused this unexpected turn of events? Fiscal stimulus and the lingering impacts of COVID relief programs kept the economic engine revving. Despite the Fed’s attempts to slow it down with rate hikes and quantitative tightening, the economy remained robust even when rates surpassed 5.00%. The FOMC (Powell) has both feet on the brake while the economy has continued to accelerate. With growth slowing, there’s concern that the economy could skid off course before year-end.
Commercial Loan Delinquencies
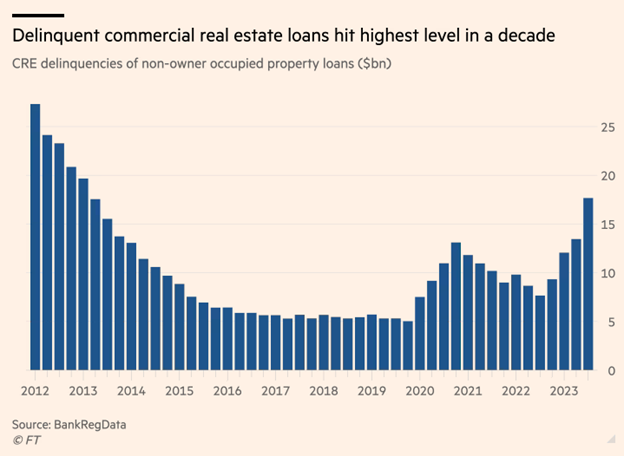
Commercial real estate loan delinquencies have surged to a 10-year high, and this trend is just beginning, potentially reaching unprecedented levels in the years to come. In my morning update for Premium members, I highlighted the bankruptcy of Wework, which is abandoning 40 leases in New York City.
US Debt Payments
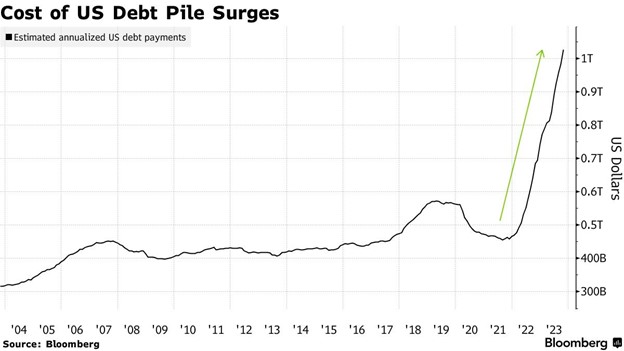
The interest paid on US debt has surpassed $1 trillion annually, posing an ongoing challenge for the foreseeable future. The recent 30-year bond auction was disappointing, with dealers having to absorb 25% of unsold leftovers.
Escalating Unemployment
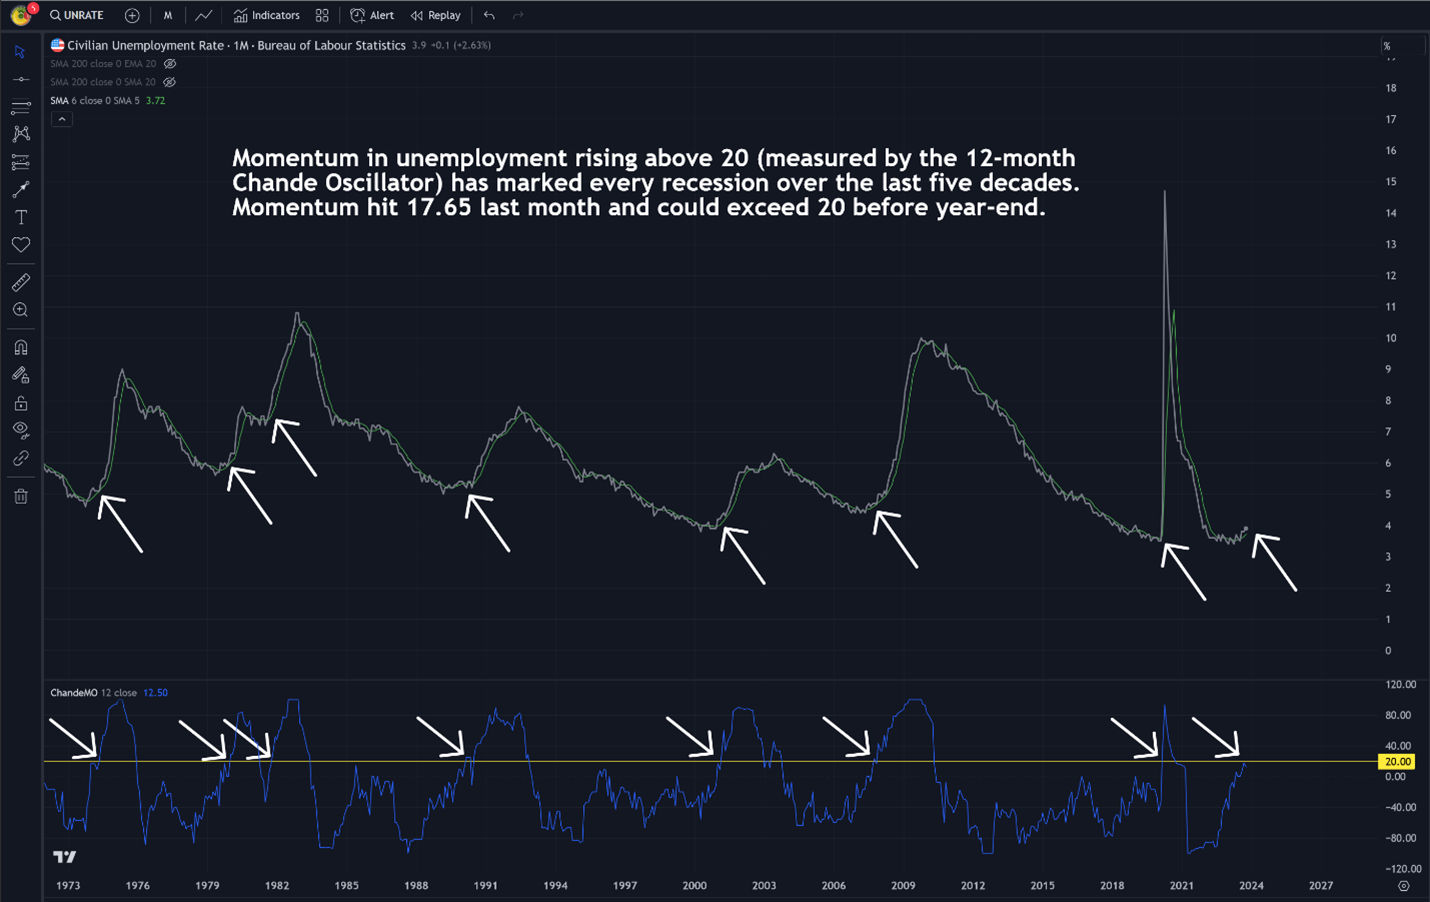
The momentum in unemployment, measured by the 12-month Chande Oscillator, has historically signaled recessions over the last five decades. Last month, the momentum reached 17.65 and could surpass 20 by the end of the year.
S&P 500 Analysis
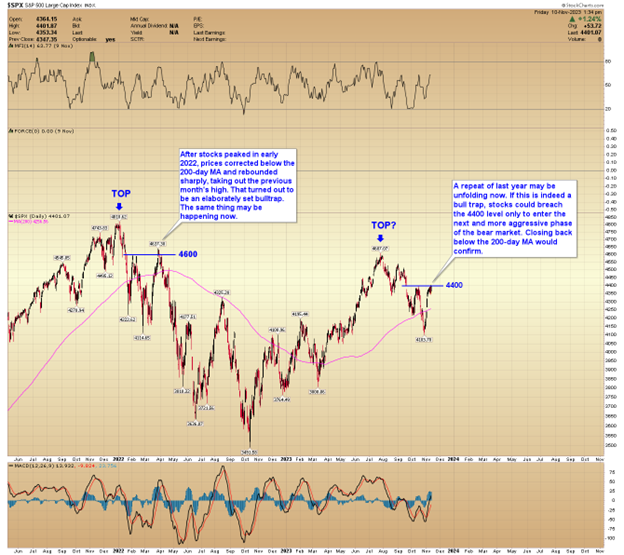
Following the peak in early 2022, stock prices corrected below the 200-day moving average before rebounding sharply, creating a deceptive bull trap. A repeat of last year may be unfolding now. If this is indeed a bull trap, stocks could breach the 4400 level only to enter the next and more aggressive phase of the bear market. Closing back below the 200-day MA would confirm.
GOLD WEEKLY CHART
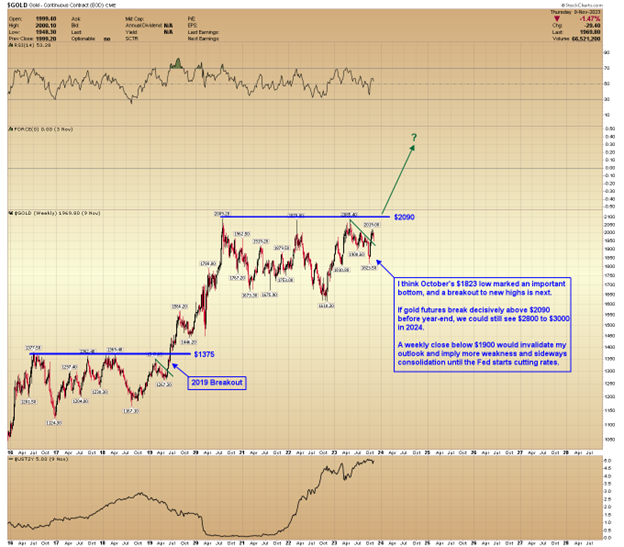
I think October’s $1823 low marked an important bottom, and a breakout to new highs is next.
If gold futures break decisively above $2090 before year-end, we could still see $2800 to $3000 in 2024.
A weekly close below $1900 would invalidate my outlook and imply more weakness and sideways consolidation until the Fed starts cutting rates.
GOLD DAILY CHART
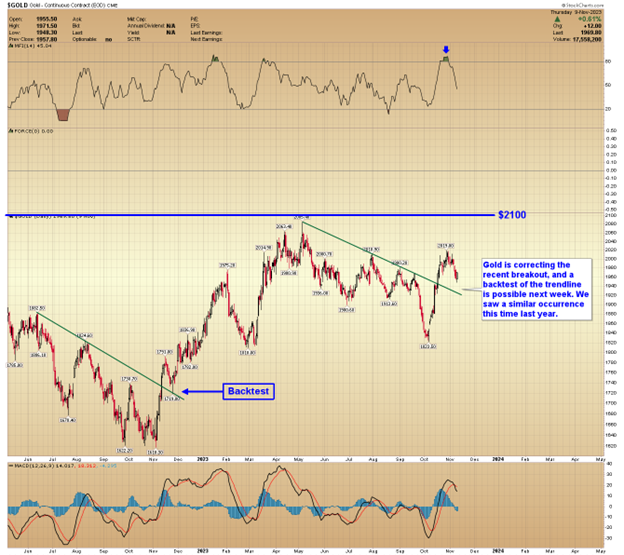
Gold is correcting the recent breakout, and a backtest of the trendline is possible next week. We saw a similar occurrence this time last year.
GDX GOLD MINERS
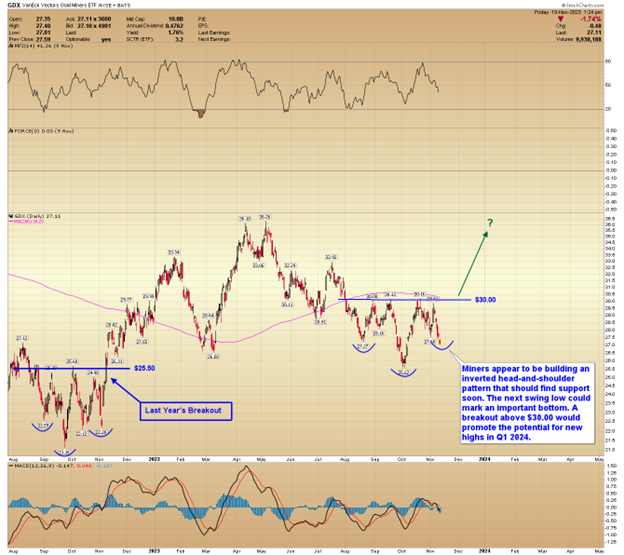
Miners appear to be building an inverted head-and-shoulder pattern that should find support soon. The next swing low could mark an important bottom. A breakout above $30.00 would promote the potential for new highs in Q1 2024.
Conclusion
Gold prices are correcting the initial breakout and should find support in the coming days. A daily close above $2000 later this month would open the door for new highs by year-end or early 2024.
Click here to read our article on $10,000 gold and $300 silver.
AG Thorson is a registered CMT and an expert in technical analysis. For regular updates, please visit www.GoldPredict.com.
********

