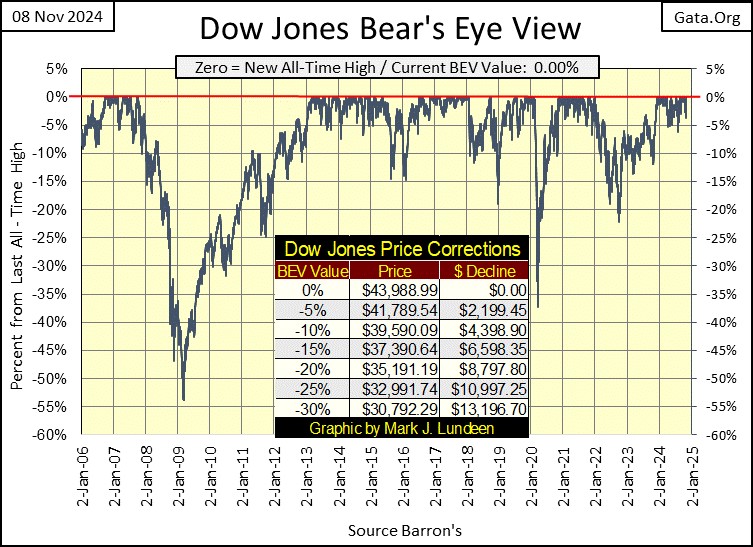
What a week for the Dow Jones, and gold. Though looking at their Bear’s Eye View charts, nothing dramatic happened this week, as seen in the Dow Jones BEV chart below.
That is to be expected with a BEV plot, where every new all-time high registers as a 0.0%, and never more, whether that advance to a new all-time high was by a penny, or a one-day advance of $1,508 for the Dow Jones, as we saw on Wednesday this week. To Mr Bear, each new all-time high is the same; a Big Fat Zero / 0.0%.
As usual, as far as I’m concerned, the most important consideration for the stock-market bulls this week is; did the Dow Jones close in scoring position, between its 0.0% and -5% lines in the chart above. Closing the week with a BEV value of 0.0%, at a new all-time high; the Dow Jones has been advancing into record territory since November of last year, and we should assume this advance will continue until the Dow Jones declines below its BEV -10% line. But it would be advisable to begin reducing one’s exposure to the stock market when the Dow Jones declines to a BEV value of -6% to -8%.
It’s important to keep in mind, the Dow Jones has been advancing since August 1982. How much more can the bulls count on the stock market before it comes to its Terminal Zero (TZ = last all-time high of a bull market seen on a BEV chart) of a forty-two-year advance?
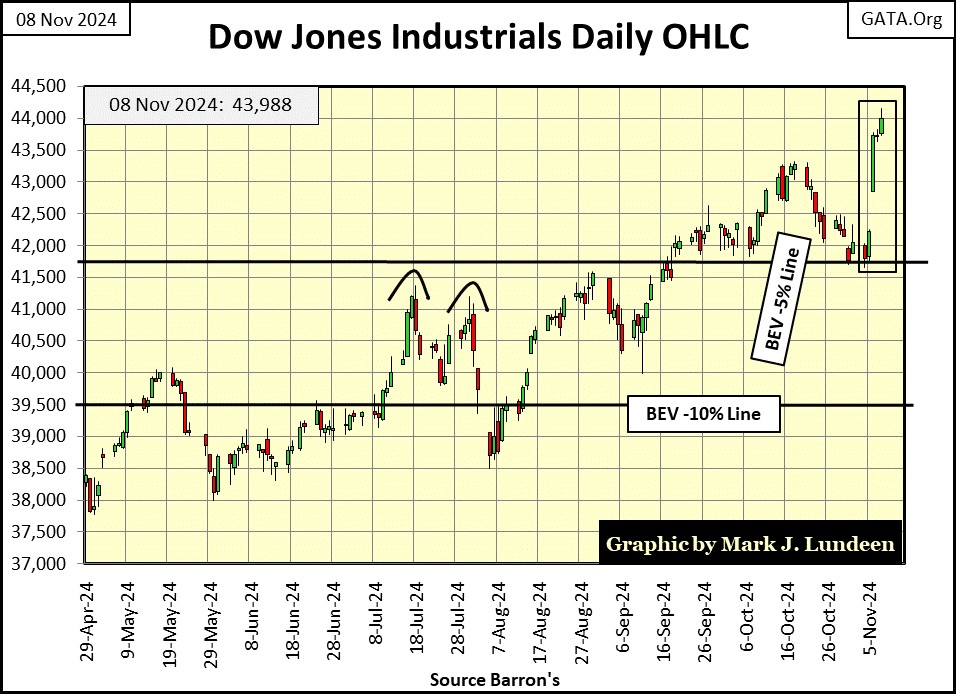
Here is the Dow Jones in daily bars, where the excitement following Tuesday’s presidential election victory of Donald Trump, is on full display. Trump’s election day victory inspired the bulls to push the Dow Jones up by 3.57% above its previous day’s close. That is a huge move, making Wednesday, a day of extreme-market volatility, a Dow Jones 2% day.
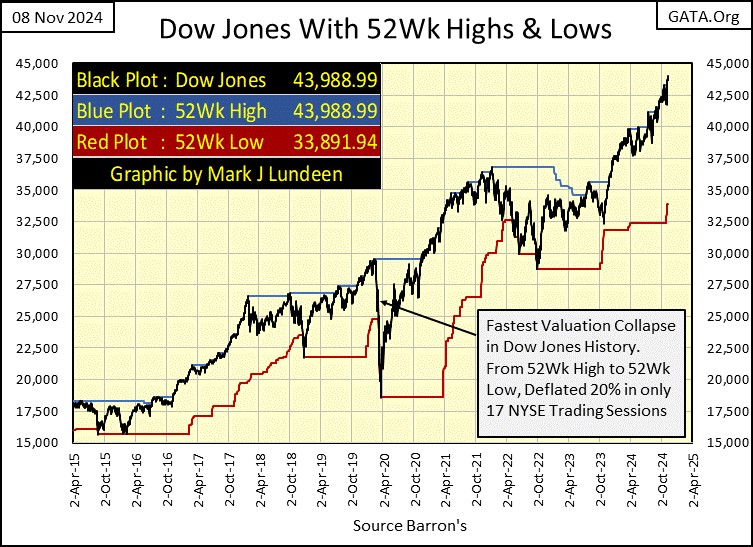
Another view of the advance the Dow Jones has seen for the past year is offered below, where the Dow Jones is plotted with its 52Wk High and Low lines. From November of last year, except for a brief period last summer, the Dow Jones has continuously pushed up on its 52Wk line for the past year.
How long can this advance go on? I don’t know, but if you look at the chart below, from October 2016, to March 2018, when Donald Trump was first elected as President, the Dow Jones was pushing up on its 52Wk High line for over a year and a half.
Should we expect a repeat of this performance with Trump now winning his second term? I’m not the guy to answer that question. Nope, I’m the guy who has been saying for over a year; as long as the Dow Jones is closing in scoring position, between its BEV 0.0% and BEV -5% lines, one is justified being bullish on the stock market. How long this could go on, is something completely beyond my understanding.
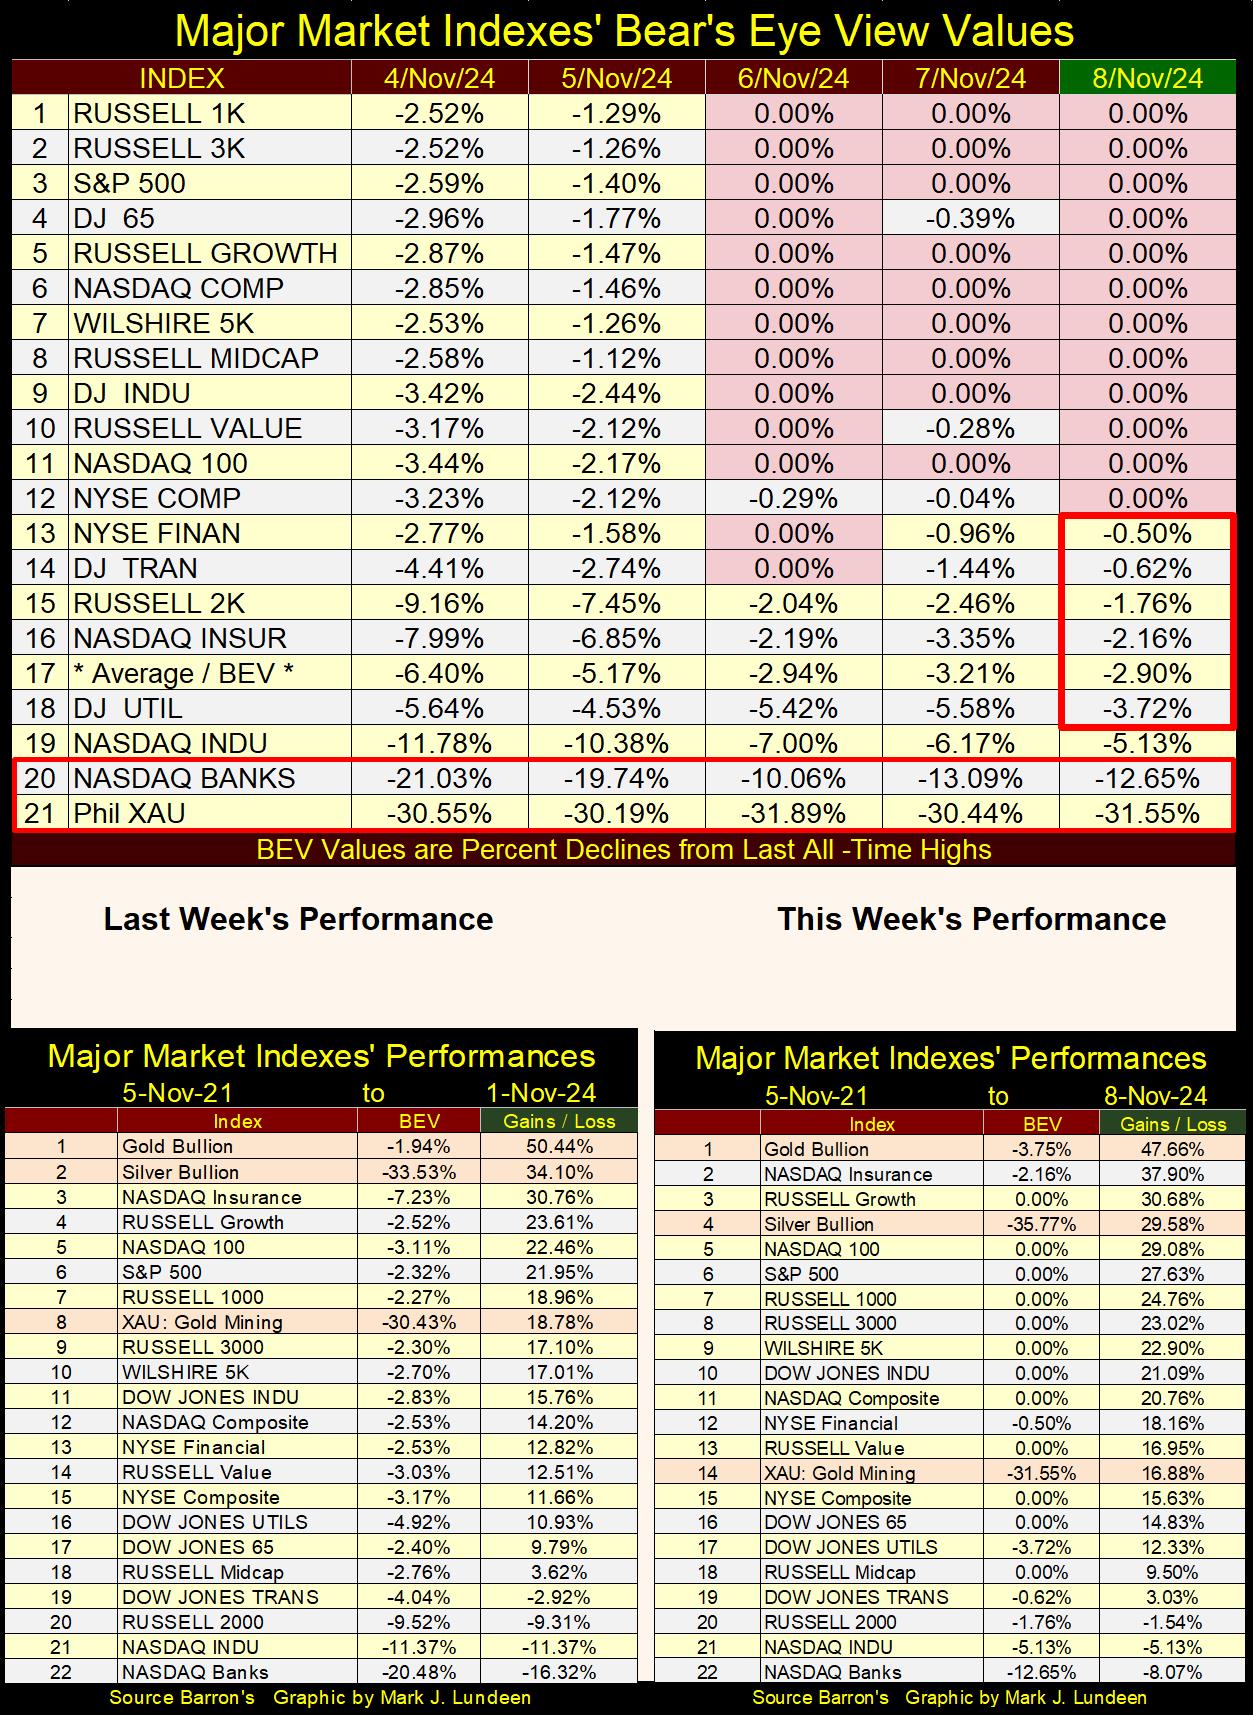
It wasn’t only the Dow Jones making new all-time highs this week; BEV Zeros = 0.00%, in the table below for the major-market indexes’ Bear’s Eye View values. The week closed with twelve of these indexes closing at a new all-time high, and the next five indexes closing in scoring position; between BEV -0.01% to -4.99%.
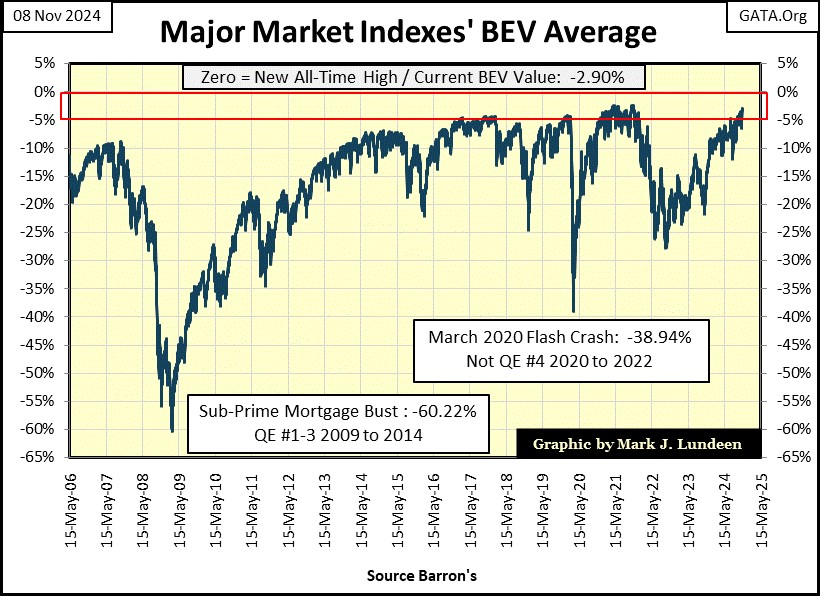
Here is the chart for the average BEV value for these indexes, #17 in the table below. This week, this average of twenty-major market indexes’ BEV values, closed at -2.90%, above the BEV -5% line. Seeing this, what should we be thinking about this? The first thing that comes to my mind is; this market is approaching a major market top, making this; * NOT A GOOD TIME TO BUY *. At times like this, investors should be thinking of reasons to sell, not reasons to buy.
When would this data, plotted above, suggest it’s a good time to buy? The deeper this average declined in the Bear’s Eye View, the better the bargains to be had in the stock market. This makes the BEV -60% seen in March 2009, at the bottom of the sub-prime mortgage bear market, the best time to have purchased stocks since the end of WWII.
Thought be warned; buying when this average is far below its BEV -40% line, may be the smart thing to do; but for Pete’s sake, don’t tell anyone you’re a buyer in the stock market. Because most people like buying at times like this; at a market top.
Looking at the BEV chart above, and the Major-Market Indexes BEV values below, it’s evident we’re approaching a major market top, which is never a good time to be buying stocks. This major top may not come until next November, a year from now, then it may come before this Christmas. So, this is a market one must have an exit plan, a trip wire, where once crossed, its best to exit the market, and take your profits with you.
As I’ve stated before, I’m out of this market, and have been for a long time. I’m in precious metals investments, and I’ve done okay with them. But if I were currently in the broad stock market, my exit plan would be as follows.
My trip wires are;
- as long as the Dow Jones daily closes in scoring position; do nothing but enjoy the bull market.
- But once the Dow Jones closes below its BEV -5% line, say like a BEV of -6% or more, begin reducing your exposure to the market.
- Once the Dow Jones closes below its BEV -10% line; get out, and stay out.
I can’t make it any simpler than that. Geeze Louise, look at all those new all-time highs in the table below following Trump’s victory on Tuesday. This can’t go on forever, but for as long as it does, I recommend investors enjoy themselves.
In the performance tables above, silver bullion (#4) and the XAU (#14) saw a fall from grace this week, following Trump’s victory on Tuesday. Note that gold is keeping an iron hand on the tiller, staying at #1.
So, what about silver bullion and the precious metal miners in the XAU; are they now sells after this week’s declines? Now calm down, silver and the mining companies in the XAU remain compelling market values, as seen by their BEV values given in the tables above. The XAU hasn’t seen a new all-time high since April 2011, and silver’s last all-time high was in January 1980.
If you were thinking of buying silver, or the miners last week, the only thing that has changed this week is; silver and its miners are even better bargains.
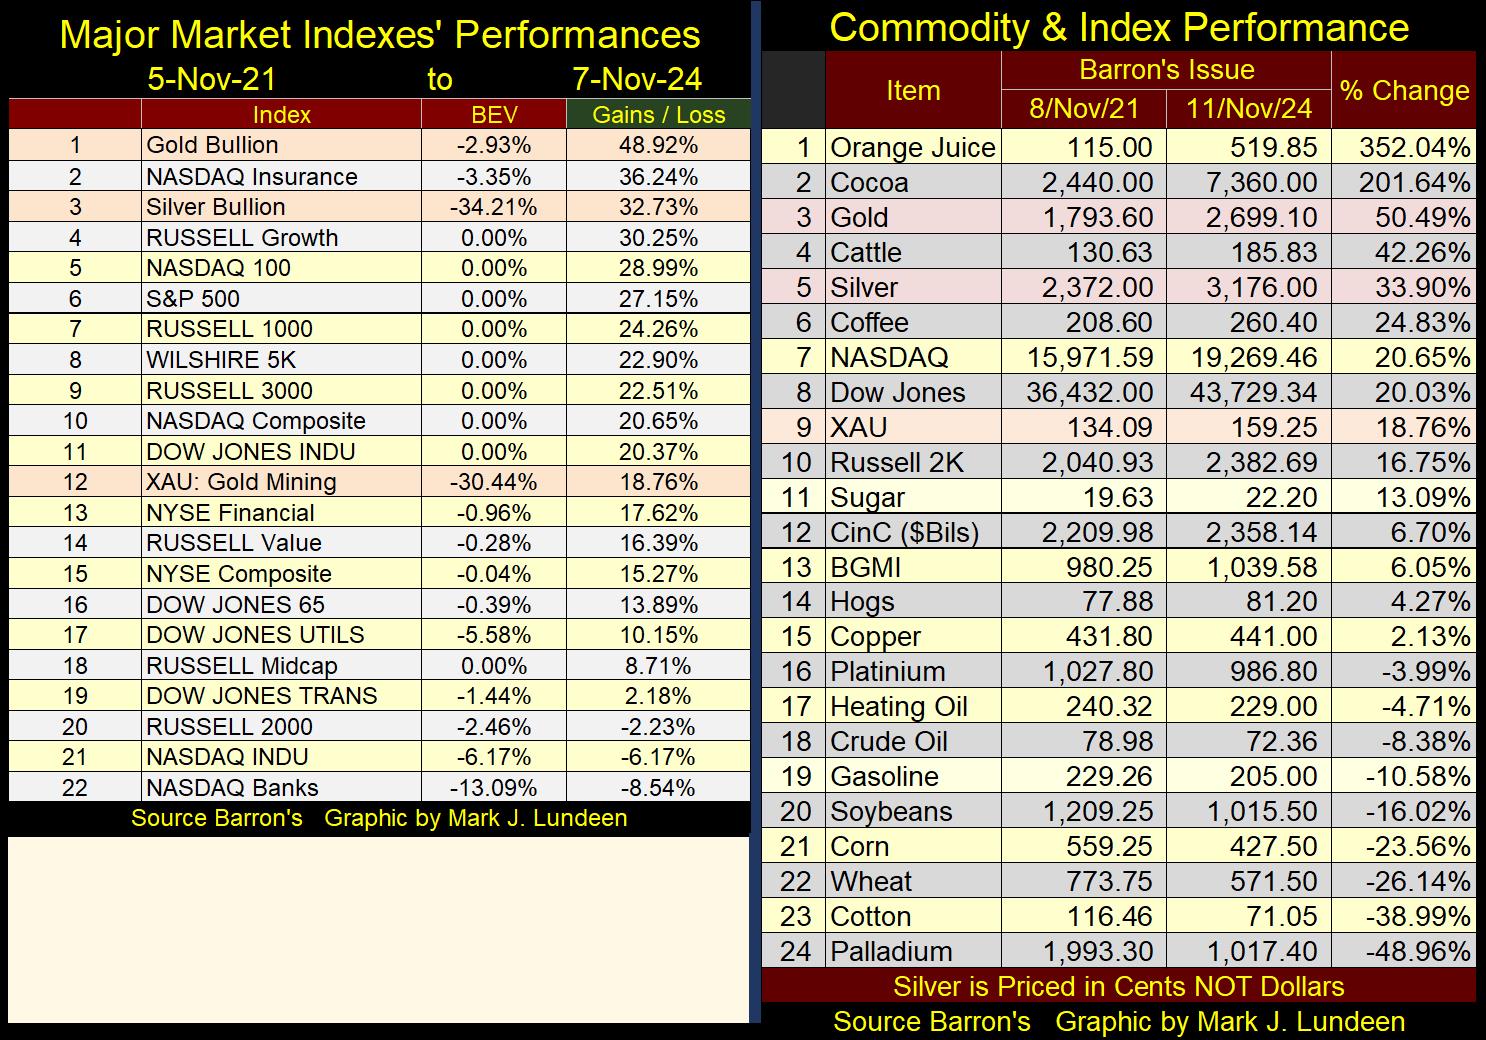
Here is a graphic I haven’t published since last July, a comparison between the performance in the stock market, and in the futures markets for commodities, from the first week of November 2021, to this week. The data for the Major Market Indexes is daily, for the Commodity its weekly, Thursday’s closing prices. I point that out as gold and silver prices are a tad off from one table to the other.
In the commodity table (right table below), I’ve included some stock indexes for comparison purposes, as well as CinC for an inflation index. I’m a bit surprised how well some commodities have done in the past three years; orange juice and cocoa are up by triple digit percentages. But gold (#3) and silver (#5) have earned honorable mention in the list, seen superior gains when compared to any stock index included in the table.
Energy and basic food commodities in the table above are down from three years ago. So, why is CPI inflation so bad? With crude oil prices down by 8.38% (#18), and soybean, corn and wheat prices (#20,21,22) down by big percentages since November 2021, rising CPI inflation is a mystery to me.
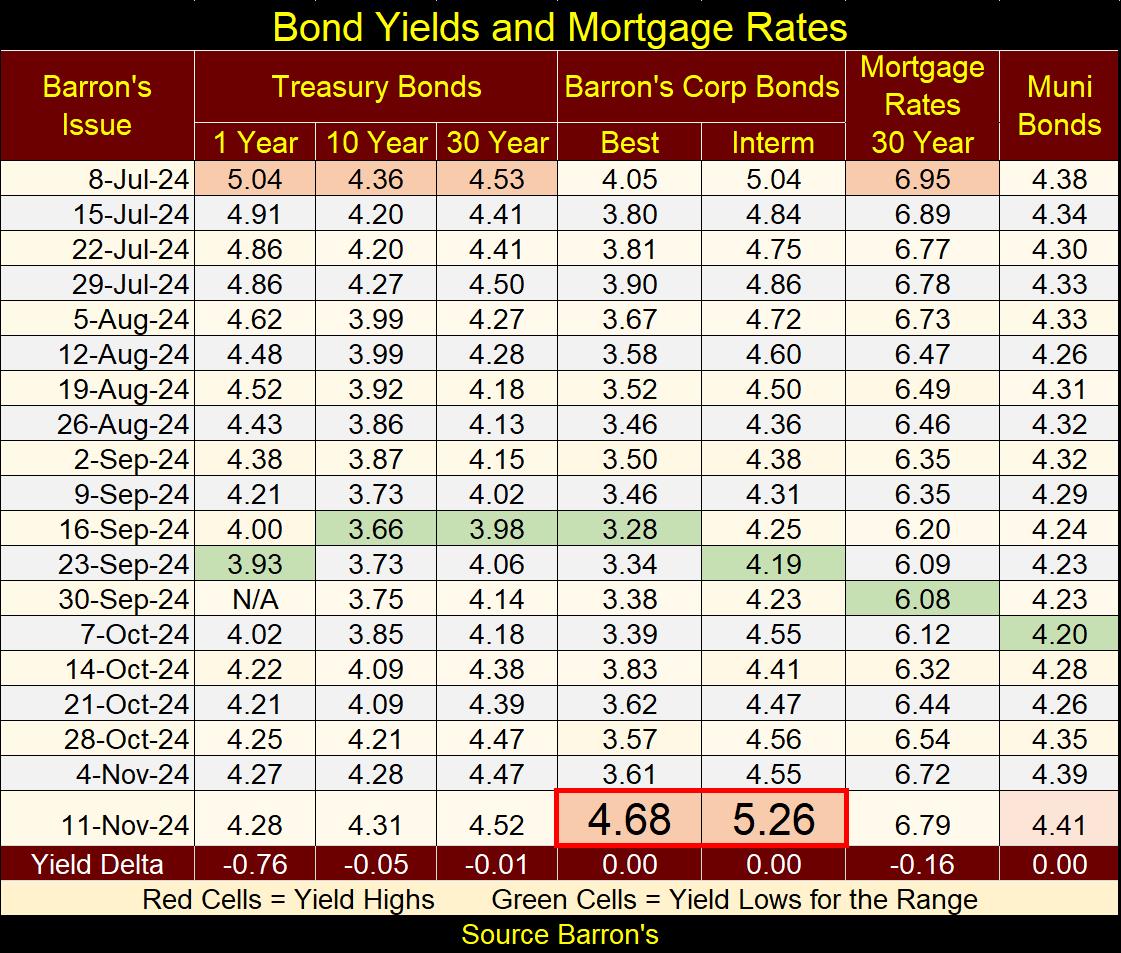
This week, Barron’s Corp Bond Yields (table below) were up BIG! Barron’s Best Grade Bond Yields were up by 1.07% from the week before – Wow! So, the stock market may have performed great this week, but the bonds issued by some of these same companies, took it on the nose when Trump won this week.
Is this data a mistake? Maybe, but looking at the yields for Treasury Bonds, since mid-September they have been creeping up too. Ditto for mortgage rates and muni-bonds.
If these bond yields continue rising, at some point rising yields will impact the stock market, and not in a pleasant way for the bulls.
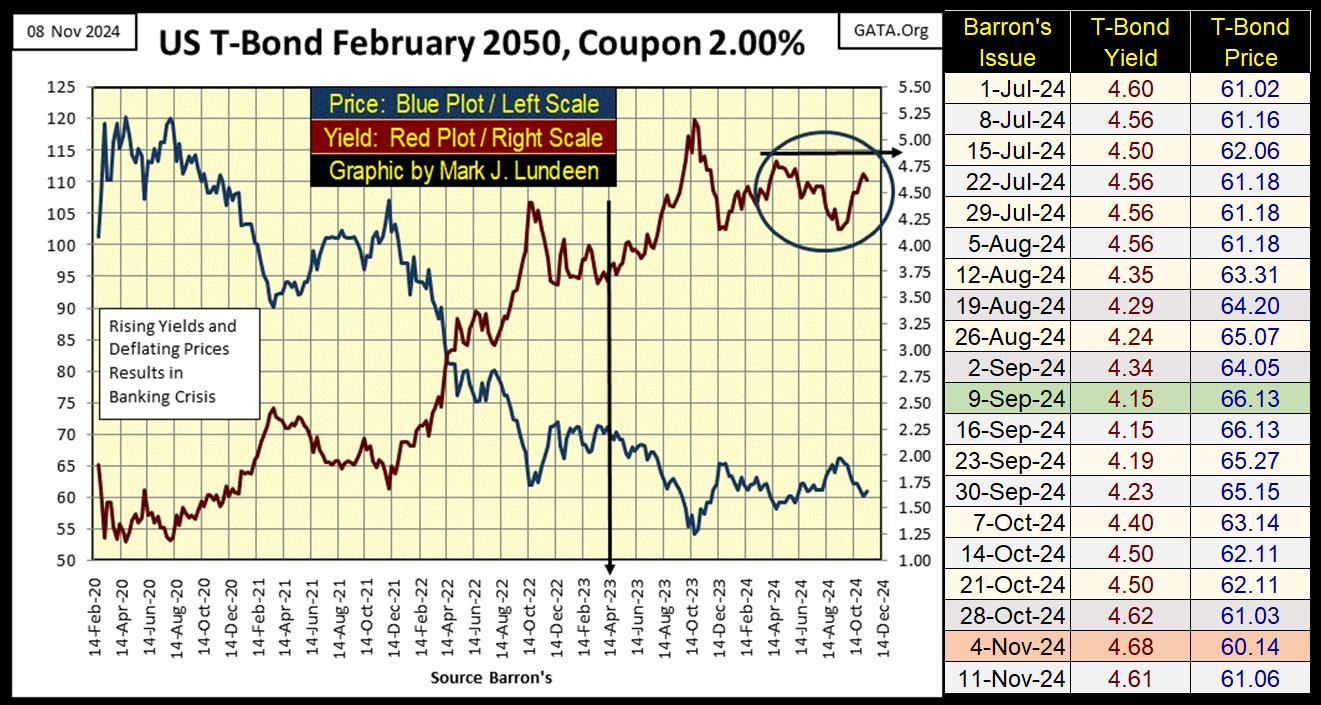
We can see what the impact of rising yields can be on the stock market in the chart below, of a 30Yr T-Bond issued in February 2020. Since T-Bond Yields bottomed in August 2020, they’ve been rising. The arrow pointing down marks April 2023, when various banks in Silicon Valley failed, after their reserves proved to be inadequate.
What was their problem? It can be seen below; T-bond yields increased from 1.19% in August 2020, to 3.75% in April 2023. These yield increases, resulted in this bond’s valuation to deflate from 120, to 70, a loss of 41% from what this bond could be traded for just three years earlier.
And these banks purchased these T-bonds, with the deposits their depositors deposited in them, for liquid banking reserves. The day came, when the word went out some banks in Silicon Valley had some problem, and a run on deposits developed. These banks failed because T-bond yields had increased, and T-bond valuations had deflated significantly since August 2020.
Currently, I’m interested in the circled portion of the chart above; will this T-Bond’s Yield break above its highs of last April, when it was yielding 4.75%. Last week, this bond’s yield closed at 4.68%, up from Barron’s 09 September 2024 issue when it yielded 4.15%, or up by about ½ a percentage point in the past two months. But look at what that ½ of a percentage point increase in its yield, do to this bond’s valuation, it deflated this bond’s market value by almost 10%.
Think of that. Someone purchased this bond in September when it was yielding 4.15% for annual income, income that will be taxed. Now two months later, Mr Bear took 10% off this bond’s valuation. Question; what kind of market does something like that? I’ll tell you, a bear market in bonds would do that, and I believe that is what we have in the bond market, a bear market.
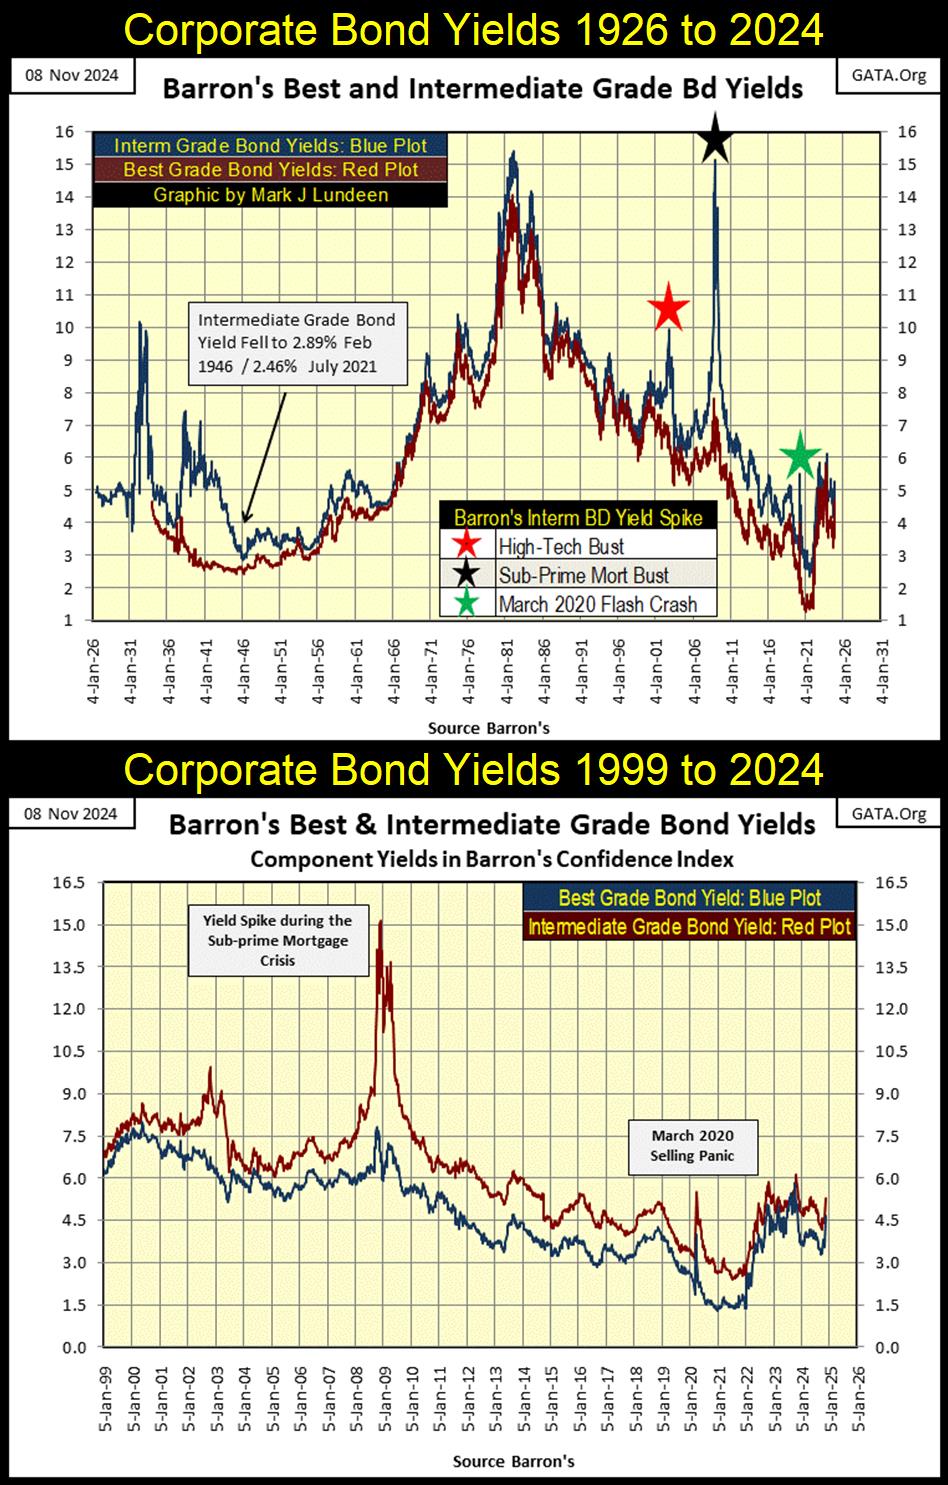
Below are two charts for Barron’s Best and Intermediate Grade Bond Yields going back to 1926, and 1999. Bond bull markets occur when bond yields decline (bond prices rise). Bond bear markets occur when bond yields rise (bond prices decline).
In the top chart, it’s easy discerning when the bond market was in a bull or bear market, by noting if bond yields were declining or rising. But are corporate bond yields rising of falling now?
To see if we are currently in an era of rising or falling bond yields, I included the lower chart in the above graphic. To my eyes, I believe since January 2022, the corporate bond market began a bear market. A bear market in bonds that will take many years, possibly decades before it is completed.
Based on the market history seen in the top chart, this bear market in corporate bonds could last for a long time, taking bond yields far above where they are now. That will not be good for the stock market, but it would be for gold, silver and the mining companies in the XAU.
Okay, what is the first thing to note about gold at the close of this week? Did it, or did it not close in scoring position? In fact, as bad as Wednesday was for gold and silver, a day many tell us the Earth opened, and almost swallowed whole the gold market, even then, gold closes inside of scoring position, with a BEV of -4.72%.
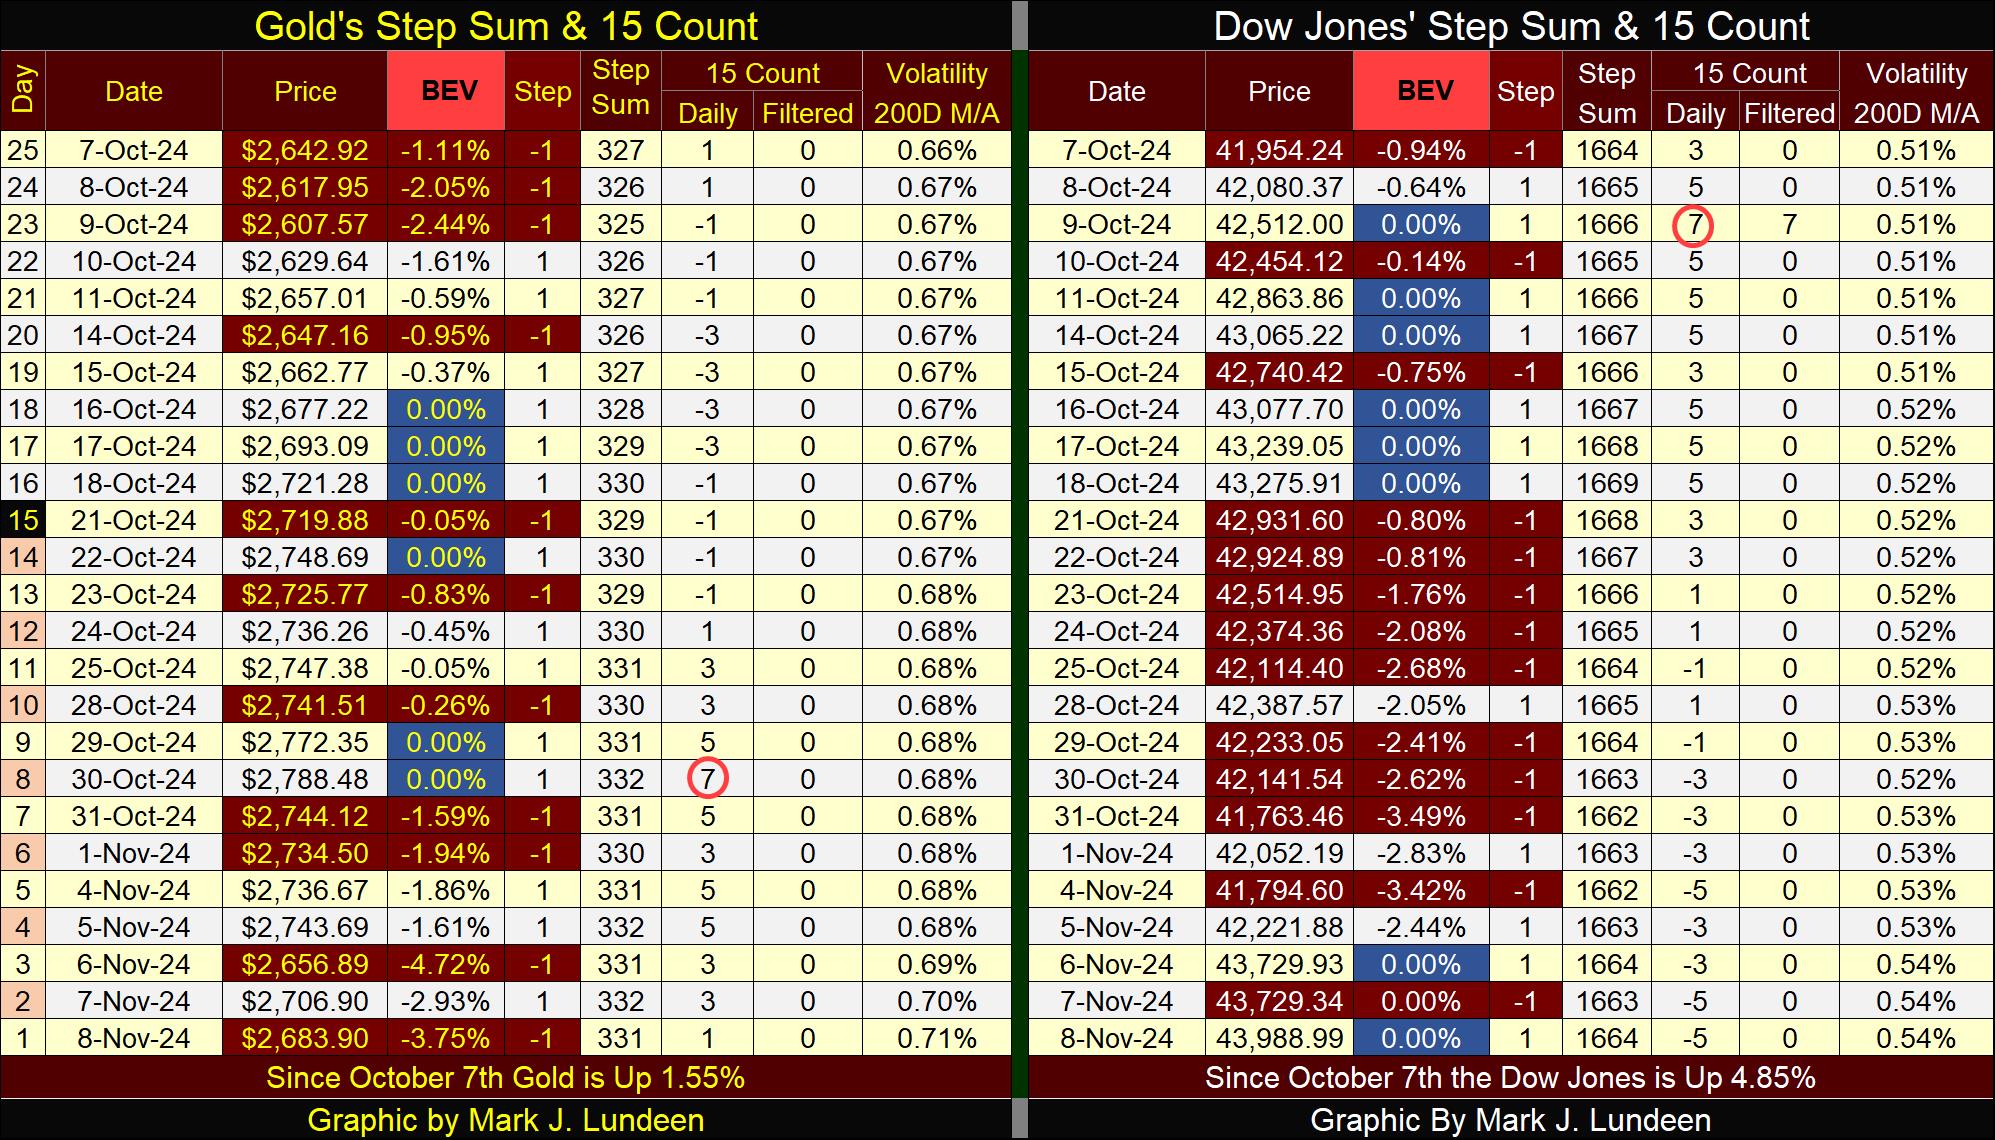
The bloody details for this week’s daily BEV values can be seen below in gold’s Step Sum Table. At the close of this week, it’s important to know gold had not closed below its BEV -5% line since last June, and so I remain bullish on the gold and silver markets.
But in fact, I can’t imagine myself becoming bearish on gold and silver, assets with no counter-party risks, because the world is wallowing in debt that has become a real burden to service, be it for “consumers,” corporations or governments.
I like having Trump as president at a time like this. But when Mr Bear returns to stress-test the banking system, and its over-extended retail and corporate clients, there is no way for Trump to make the pain go away when trillions of dollars of bank-credit is defaulted on.
Being a human being, I too seek pleasure and avoid pain. But I don’t see how anyone will be able to protect the world’s economy from the consequences of decades of reckless credit creation by the global-central-banking cartel. How large are the dollar totals for;
- school loans,
- mortgages,
- credit card debt,
- auto loans?
These debts must be in the trillions, and they are just for American consumers. What about the debt burdens on domestic corporations and local government, as well as the Federal Government, including its “unfunded liabilities.” Then there is the debt burdens of the world at large, values I haven’t a clue of the size of.
Credit creation in the booming 1920s, by the then newly established Federal Reserve, is what made that decade one hundred years ago Roar. It was the defaulting on that boom-time credit that made the 1930s so depressing.
Since 2000, Mr Bear has attempted to stress test the economy’s ability to service its debts during a down turn in the economy;
- 2000-2002 NASDAQ High Tech Bust,
- 2007-2009 Sub-Prime Mortgage Bust,
- March 2020 Flash Crash.
These episodes of financial crisis can be seen in my chart of the Barron’s Best and Intermediate Grade Bond Yields above (colored stars on the top chart), when Intermediate Bond Yields spiked in reaction to a financial crisis.
But for each of the above massive busts in the financial markets, The Federal Reserve System stepped in, and “stabilized market valuations” via massive “injections” of “liquidity.” So, unviable debt is never cleared from the economy. Instead, it is rolled over, thanks to the FOMC “injecting liquidity,” into the financial system.
For years now, the economy has zombies, the living dead wandering aimlessly about in it. Economic entities, individuals, and corporations, who can only service their debts, by taking on ever more debt. Which is exactly what those “injections of liquidity” are supposed to do for overextended corporations and consumers who can’t service their debt, and other expenses with their regular income.
None of this changed this week with Trump’s victory in Tuesday’s election, so I remain bullish on gold, and silver; assets with zero counterparty risk, and their miners.
For the step-sum tables below, I’m going to assume last week saw nothing special, or historic happen. Last week was just another dull, first week in November. So, with gold’s 15-count increasing to an overbought +7 on October 30th, I’m not surprised gold saw a sell off, as the gold market doesn’t like being overbought.
The week closed with gold’s 15-count at a neutral +1. We may see additional selling in the weeks to come, taking gold’s 15-count into negative territory, and then we may not. But at the close of this week, I remain bullish on the gold and silver markets, as nothing consequential has changed in the market with Trump now America’s President Elect.
The Dow Jones in its step sum table on the right side above looks good. The Dow was overbought, with a +7, 15-count on October 9th. In the past month the market corrected for this overbought condition, and even managed to see two new all-time highs this week, with the Dow Jones’ 15-count at a -5! Things like this happen when the Dow Jones advances by over 1500 in single day, as it did last Wednesday.
Next week, the thing to watch for is; will gold continue going down, or will it bounce back, and go on to additional new all-time highs in the weeks to come. You know what I have to say about this; if gold’s daily BEV values can stay above -5%, that is good. If not, I don’t care as I see gold as a long-term hold. I’m not going to be forced out of my position in gold, because as things are in the world today, gold has more going for it than against it.
What will the Dow Jones do? Will it continue advancing towards 45,000? Or will the bulls once again look down, developing acrophobia when they realize just how high the market is in November 2024? Nope, that isn’t going to happen, not just yet anyways.
I’m going to keep it simple; as long as the Dow Jones daily closes in scoring position in its BEV chart (BEV’s of -0.01% to -4.99%), I’m bullish. When the Dow Jones closes below its BEV -10% line, I’m out, and staying out.
Mark J. Lundeen
*********

