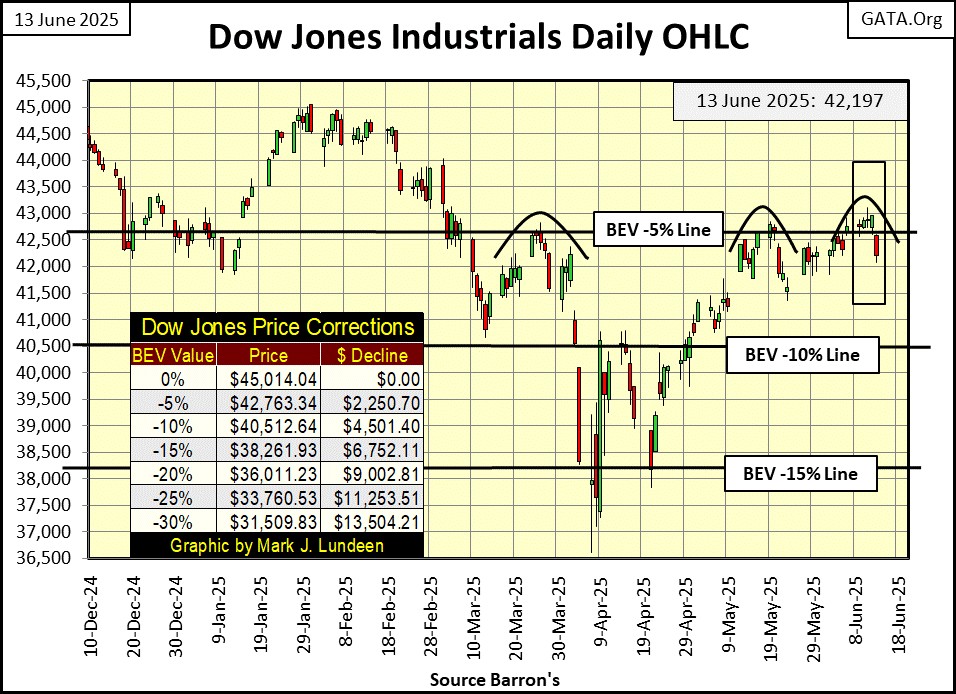
This week, the Dow Jones was once again offered an opportunity to display some market strength, and once again it failed to rise to the occasion. For three days, Tuesday to Thursday, the Dow Jones closed in scoring position (BEVs spanning -0.01% to -4.99%). Then on Friday’s close, it fell from the red-box seen below, closing the week with a BEV of -6.26%, or 6.26% from its last all-time high of last December 4th: 45,014.04.
I should note that it was on Thursday night when Israel began bombing Iran, an event that put a damper on most financial assets’ valuation, though the price of gold spiked on the news, closing the week at a new all-time high. So, should I place the blame for the Dow Jones’ latest display of market weakness on geopolitics?
Maybe, and then maybe not. It would be best for us to wait a few weeks to see what happens from now. Does the Dow Jones once again enter scoring position in its BEV chart below, then go on to new all-time highs? Or does it continue breaking down towards its BEV -10% line, and then towards its BEV -15% line?
In the past six months, time after time the Dow Jones has failed to display any enthusiasm for making market history with a new all-time high, when given an opportunity to do so. So understandably, I’m inclined to be bearish on the stock market. But should the Dow Jones grow a backbone, and once again make a new all-time high, I can change my mind quick enough.
However, keep in mind I’m out of this market, sitting in the markets’ peanut gallery, where bullish banter is only cheap talk. What is cheap talk? For example, me talking bullish nonsense about the Dow Jones, after a forty-three-year advance, that took the Dow Jones from below 800 in August 1982, to over 45,000 in December 2024. This is a market that offers very little in the way of possible rewards for buying, while offering risks to invested funds that are off the charts.
Up here in the peanut gallery, the only things we’d risk on this market is a few hotdogs, or maybe a beer or two. Good Golly Miss Molly, I wouldn’t actually buy anything that trades in the stock market at these grotesquely overvalued valuations. That is, except for the gold and silver miners, which are priced at very low, historical valuations.

To better compare the Dow Jones with the price of gold, I stacked their BEV charts above. The Dow Jones is struggling in its BEV chart above, and has been since February, while gold this week made its sixty-sixth new all-time high since it entered scoring position in November 2023.
In the Dow Jones’ chart below, looking at its daily bars, for the third time since February, its BEV -5% line (42,700) repelled the bulls’ advance. This is really becoming a bad habit for the Dow Jones. But then there is always next week.
Next is my table for the Bear’s Eye View (BEV) values for the major market indexes I follow. What are BEV values? The dollar data these indexes are published in, are converted into percentage values, spanning only 100 possible percentage points; from 0.00% for a new all-time high, to -100% for a total wipeout in valuation.
In the Bear’s Eye View; new all-time highs register as 0.00%, and never more. All daily closes not at a new all-time high, are percentage claw-backs from their last all-time high. When attempting to make sense of many market indexes, whose published valuations have no actual connection with each other, looking at their daily BEV values provides an insight into the market that is remarkable, as seen below.
It’s been a month since the NYSE Financial Index (#2 in the table) closed at a new all-time high (BEV Zero = 0.00%). It’s been months since we’ve seen two or more of these indexes close with multiple BEV Zeros. Yet, week after week, the market sees plenty of these indexes close in scoring position (BEV values less than -5%), that for reasons I don’t understand, somehow never develop into BEV Zeros. It’s like in bootcamp, where they have everyone marching in place at double time, everyone is going nowhere fast.
But there is one troublemaker seen below, someone who isn’t listening to their Drill Instructor, and actually advancing when everyone else is marching in place. I’m talking about #17 below; the gold and silver miners in the XAU.
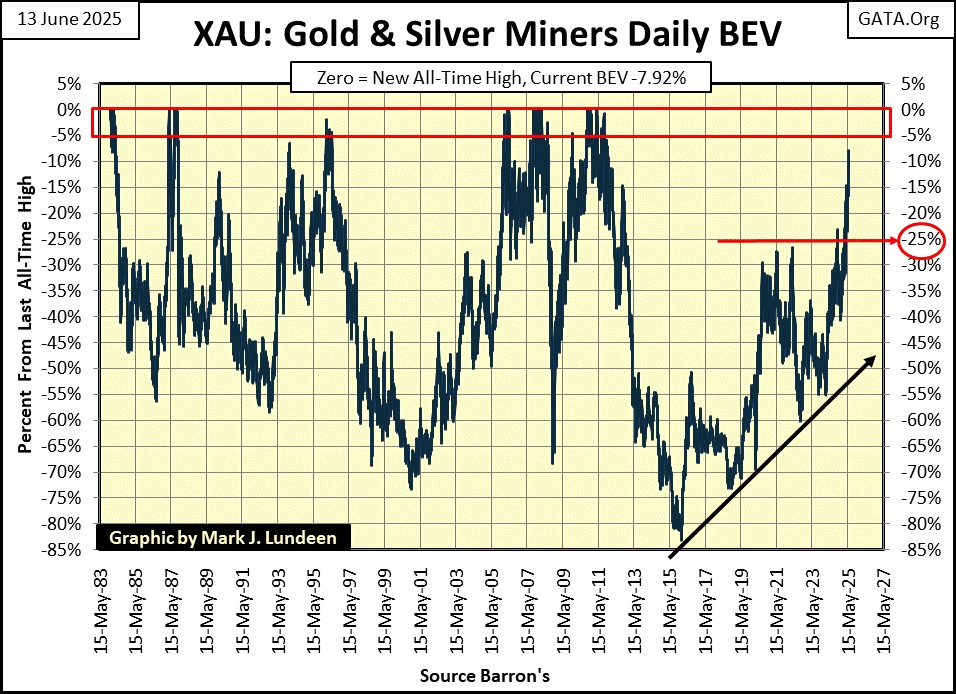
I’ve been talking about it for years, that a day would come where the XAU’s BEV value would be in single digits, and here it is in the chart & table below; with the XAU’s BEV value closing the week at -7.92%. This is something not seen since 2012, something we should take seriously.
Especially since the XAU is coming off an 83% bear-market bottom in January 2016. A greater than 80% market decline from an all-time high, is one heck of a HARD BOTTOM for a market, a bottom where everyone hates the asset they once loved.
Keep the following in mind about bull and bear markets;
- At market tops, the potential for gains are minimal, while the risks to invested funds are maximum, at a time when everyone wants in, and paying top prices for the privilege of owning shares,
- At market bottoms, the potential for gains are maximum, while the risks to invested funds are minimal, at a time when everyone wants to sell, and only a few want to buy at greatly discounted prices.
It’s from such hard bottoms, in this case where gold and silver mining companies were trading for $0.20 on the dollar in January 2016, for the same companies the market was willing to pay the full $1.00 for, five years earlier in April 2011, that a great bull market will spring from. In time, I’m sure the gold mining sector will become a historic bull market.
There is power in this move seen below. What can I say? I really like the gold and silver miners, if little else in this market.
In the table below listing my market indexes’ BEV values, the week closed with no BEV Zeros, with ten indexes closing in scoring position. The Dow Jones below (#12), shows its daily BEV values for this week. At Friday’s close, it failed to remain in scoring position.
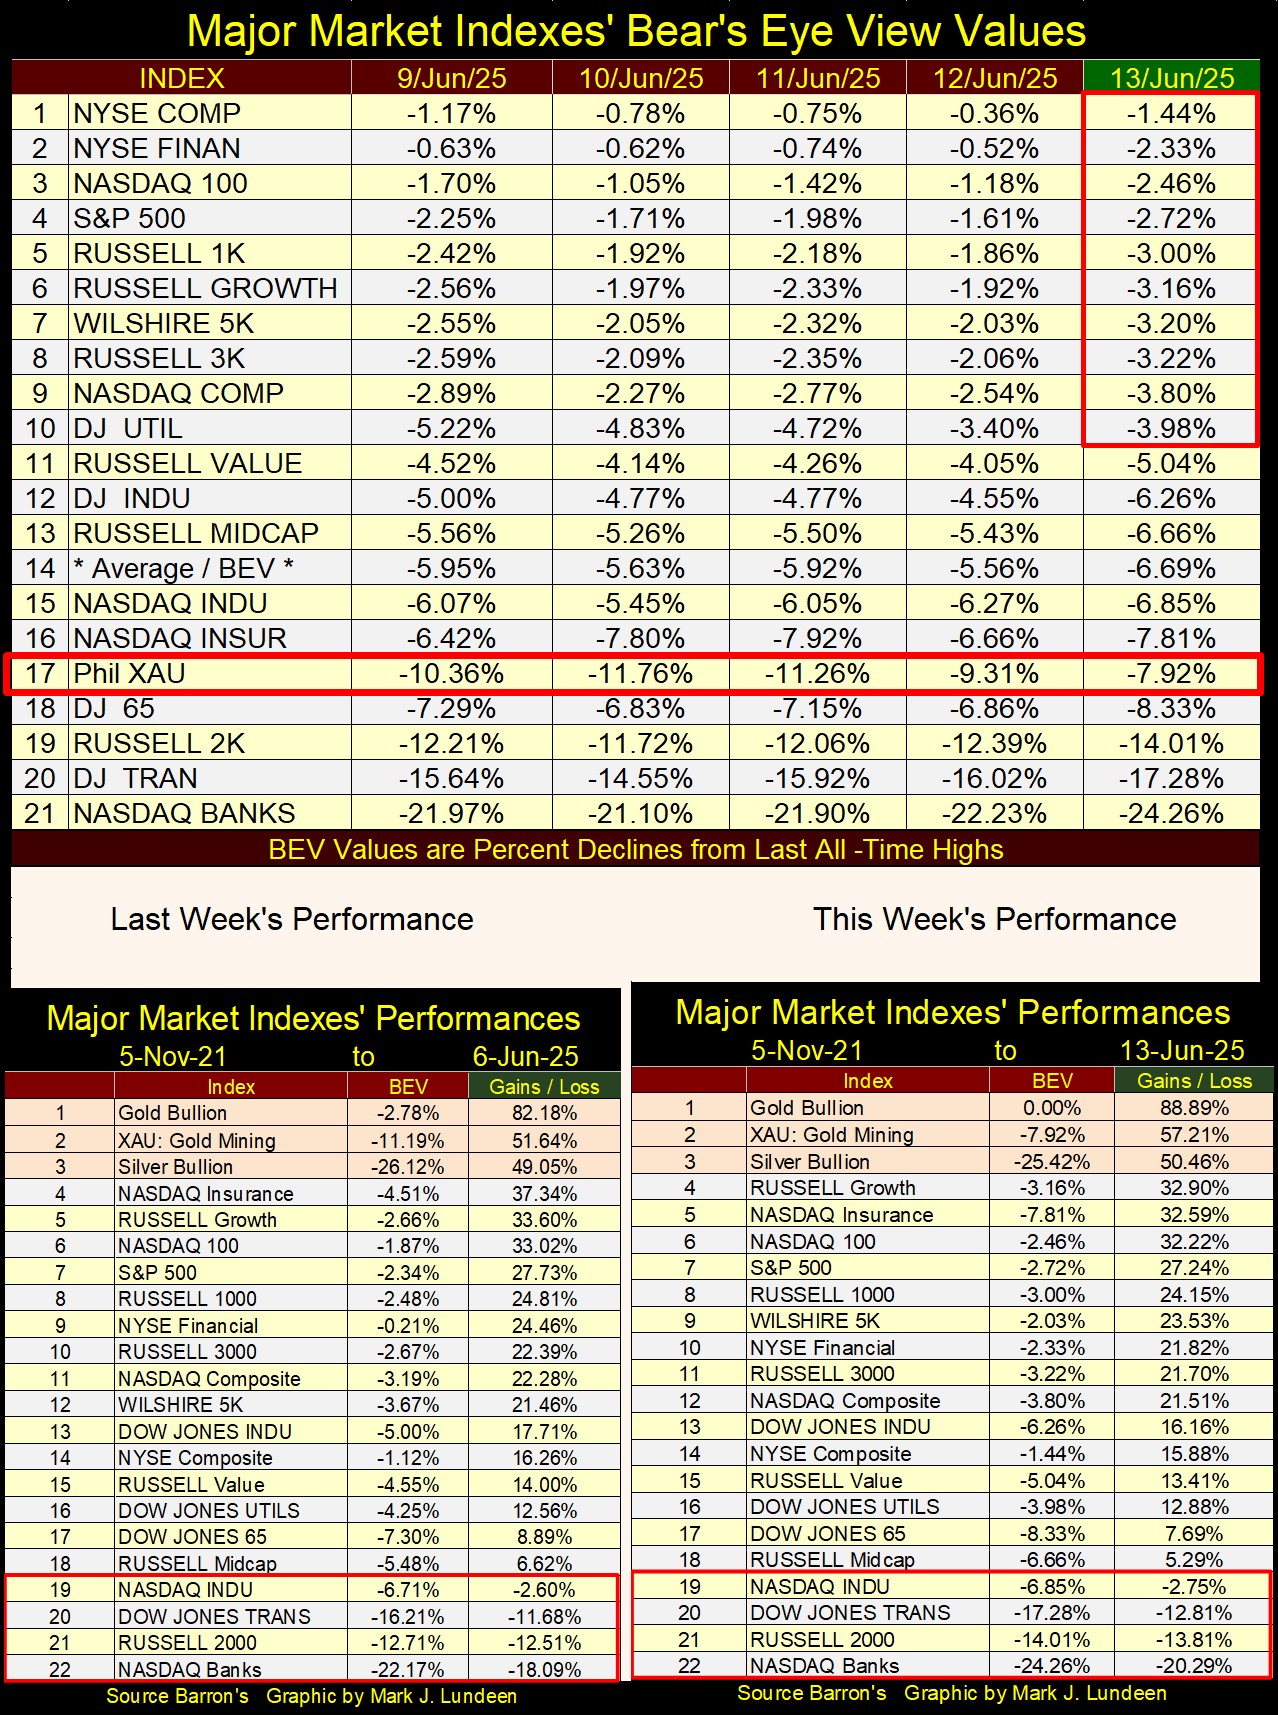
In this week’s performance table above, as usual gold, the XAU and silver closed the week at #1-3, and continue adding distance between them, and everything else below them. The NASDAQ Banking index is at #22, and down 20.29% from where it was in early November 2021. That is a bad omen for the future of this market.
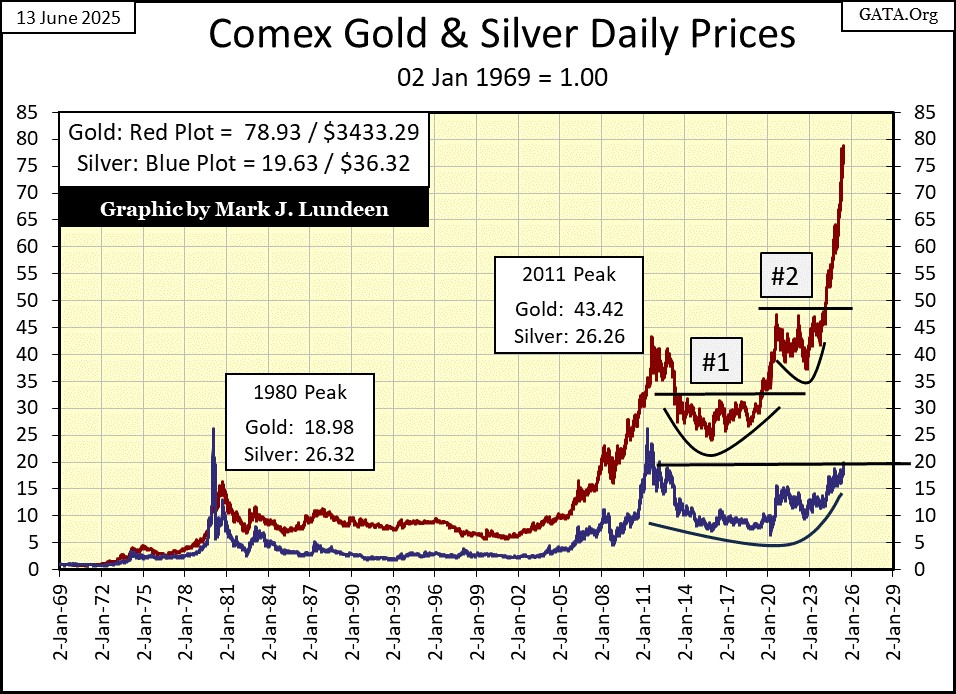
Gold in its Red Indexed plot, chart below, continues surging ahead, as silver (Blue Plot) continues struggling with its indexed 20 line. I’m looking at gold’s plot below, and I’m wondering when is gold going to see a price correction? It has been going vertical since February 2024, with no significant pullbacks in price for sixteen months now. That is NOT normal market behavior.
So, what is happening? I’m just a market enthusiast, no “market expert” am I. But this isn’t my first rodeo, so I know something big is happening, outside the public’s view in the gold and silver bullion markets. Something like the big guys in the gold market (central banks and their minions), who were formerly short gold and silver, have been shifting their former bearish positions to bullish ones. It takes time for these big players in the bullion markets to shift from one position to the other, as we are seeing in the chart below.
Silver is behaving very oddly, as if rising silver prices is the unstoppable force, while its indexed 20 line, is the immovable object. What happens when they meet, when silver’s indexed value rises to 20 ($37.00), or more? I don’t know.
But I can’t wait to see what does happen when silver in the chart below, finally sees an indexed value of 21 ($38.86) or more! As silver closed this week at $36.32, $37.00 silver isn’t far away, maybe next week. Could the price of silver spike upwards, as gold’s has for the past year? I’m thinking it will, as in terms of gold, silver has never been this cheap since 1969.
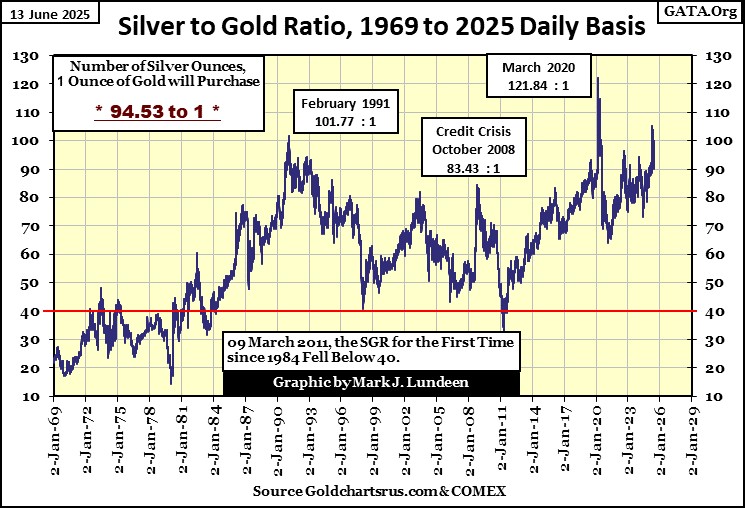
Another way of looking at the data above, is to see how many ounces of silver, one ounce of gold can purchase (Silver to Gold Ratio, or SGR), in the chart below. This week closed with a SGR of 94.53 ounces of silver, to one ounce of gold. While a SGR of something over 90 isn’t historic, it is historically high, when compared to SGR values going back to 1969.
During the 1969 to 1980 gold bull market, the SGR never increased to something over 50. At the peak of this precious-metals bull market in late December 1979, the SGR declined to 15.47 ounces of silver, for one ounce of gold. So what?
Well, I’m thinking as with the 1969 to 1980 precious metals bull market, our current bull market in gold and silver, will also see a SGR falling inline to what the market saw fifty years ago. Far below where it is now.
If so, silver will outperform gold by many multiples. So, if you’re thinking of buying some gold sometime soon, maybe you should consider buying some silver too, as in terms of gold, silver is really cheap. And cheap is good, when one is buying.
What is that in gold’s step sum table below? Do I see a BEV Zero, highlighted in blue and gold? Why yes I do, gold’s sixty-sixth BEV Zero (0.00% = new all-time high) since gold entered scoring position in November 2023.
I also note gold’s 15-count closed the week at a neural +1. So, gold is far from being an overbought market, indicating gold’s current advance into market history has plenty of head-room for it to advance to much higher prices. But will it? I’m thinking it will, because I can’t think of any reasons why it wouldn’t.
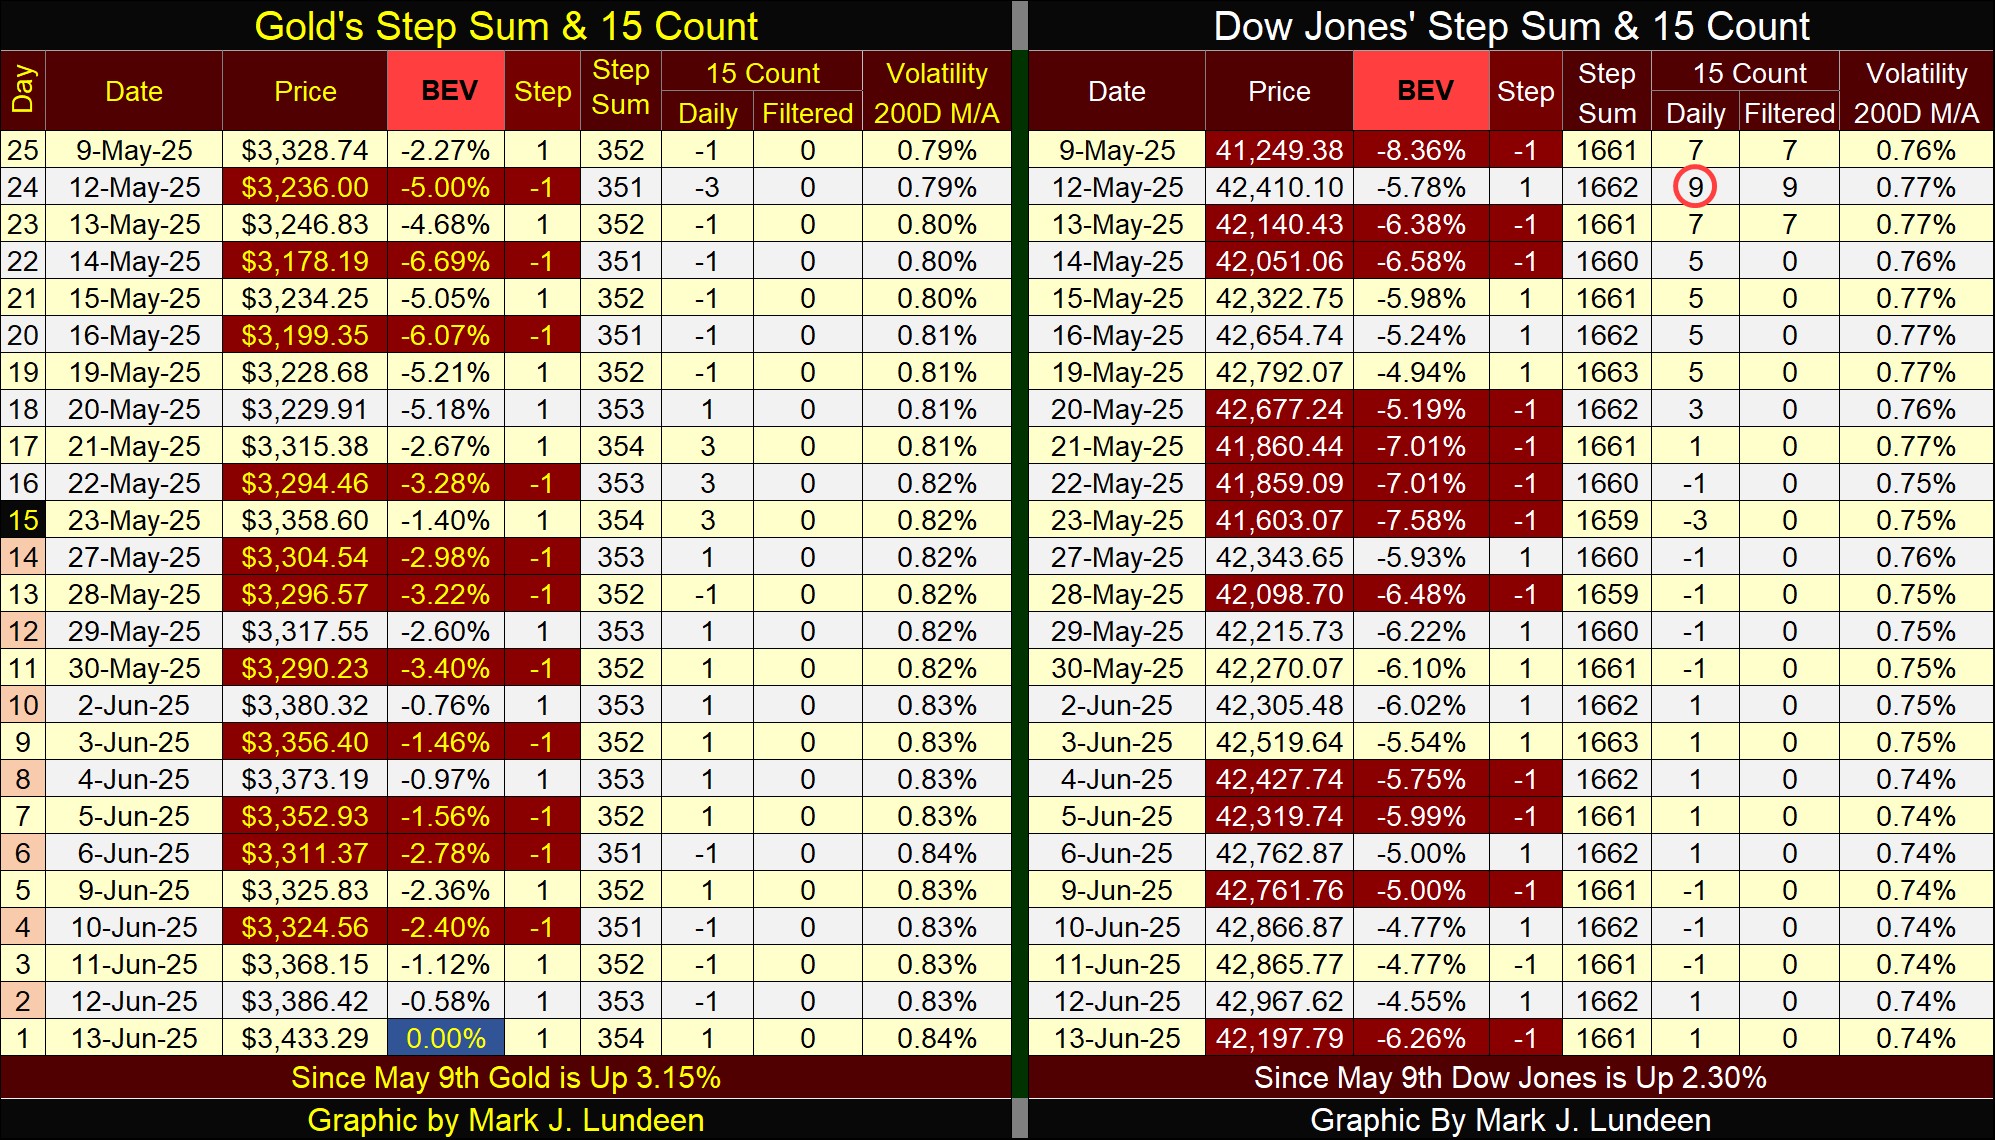
On the Dow Jones’ side of the step sum table above; the Dow Jones continues to see as many advancing days as does gold. They both closed the week with a 15-count of +1, a very neutral 15-count. But where gold closed the week with a new all-time high, the Dow Jones closed the week outside of scoring position. What is the problem with the Dow Jones?
Let’s look at these two markets’ daily volatility’s 200D M/A; they have both gone up in the past year. But rising daily volatility means something different for these two markets.
For gold, rising volatility is something that happens during both bull and bear markets. As the price of gold falls during a bear market in gold, its daily volatility rises, exactly as what happens during a bull market in gold, as the price of gold rises. So, seeing gold’s daily volatility’s 200D M/A increase to 0.84%, as this week gold saw a new all-time high, is something to be expected, and welcomed.
But for the Dow Jones, rising daily volatility is ALWAYS BEARISH, and it has been that way since Charles Dow first created his Dow Jones Average in February 1885.
Look at the chart below, plotting daily volatility for the Dow Jones since 1960, big bear market bottoms occur, when the Dow Jones daily volatility’s 200D M/A peaks, as seen in the five major market declines since 1960 below.
To make the big money in the stock market, buy at a bear-market bottom, buy when daily volatility peaks somewhere above 1.25%, and hold on until daily volatility once again declines to 0.50%, which for the Dow Jones, happened in July 2024, a year ago (Red Circle).
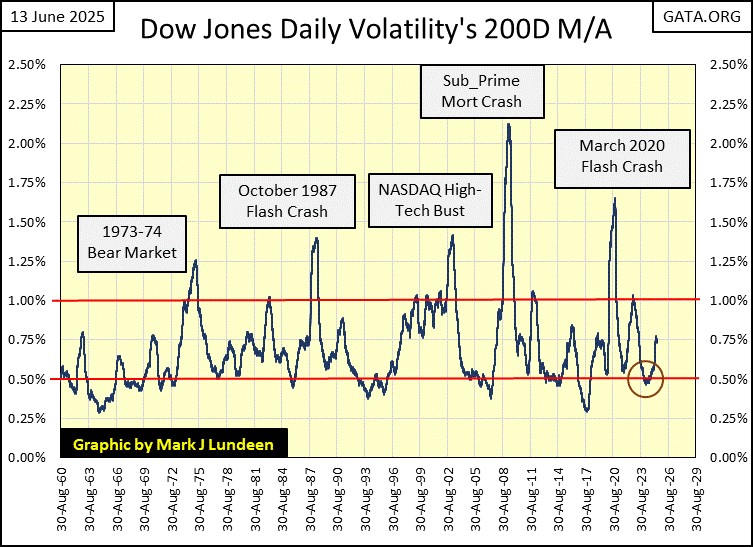
Since last July, daily volatility for the Dow Jones has once again begun to rise, and now it is something above 0.70%. This rise in daily volatility hasn’t been a positive development for the stock market in the past year. So, what happens now?
Anything can happen in the market. As seen above, there have been times when daily volatility has peaked at 0.75%, or even 1.00%, to then come back down to the 0.50% line in the chart above, most likely to the profit of a bull who bought stocks during a time when daily volatility was rising. But with the gold and silver miners doing so well, why take a chance on the Dow Jones, my proxy for the broad stock market?
I’ve remained silent on the Ukraine Russia war, but I do have strong opinions on this conflict.
Both Ukraine and Russia have been miserable places to have lived in for these past thousand years. If it wasn’t the Swedish-Vikings in the 9th and 10th centuries raiding your village to murder you, then kidnapping your blond hair, blue eyed children, to be sold in Constantinople’s slave markets, it was the Mongol Horde of the 13th to 14th centuries, that made life miserable for everyone for hundreds of years in Ukraine and Russia.
Russia had leaders like Tsar Ivan IV, aka Ivan the Terrible in the 16th century, a contemporary of Elizabeth, the queen of England. Queen Elizabeth sent an ambassador to Ivan. Wishing to impress the Queen’s representative, Ivan ordered one of his servants to jump out of a window to his death while they were dining, which Ivan’s servant did. Ivan asked Elizabeth’s ambassador’s “can the Queen of England command such loyalty from her subjects?” Her ambassador replied; “I doubt Elizabeth would want to.”
Tsar, Peter the Great was a positive move forward in the 17th century, he broke Russia’s historical links to Asia, as he dragged “all the Russias,” which included Ukraine, forward towards a future with Europe. But this shift from one culture to another was a traumatic one, that left the bulk of the Russian population behind.
This is a huge subject, one I can’t go into detail. But even during the good times in Ukraine and Russia, the vast majority of people were surfs, and a surf’s life in Russia was one of impoverished misery.
Then came the 19th century, when Ukraine was a part of Russia, as it usually was, and the hope of a period of enlightenment, as Western Europe had seen since the 17th century, came to Russia. In 1917; World War I, and Lenin’s Bolsheviks dashed that dream into pieces.
Stalin began his collectivization of Soviet-agriculture in the 1920s & 30s, to increase the Soviet Union’s agriculture production. To accomplish this revolution in agriculture, first Stalin’s NKVD (secret police) murdered, or exiled Russia’s farmers to Siberia’s labor camps, and consolidated their fields into massive collectives. These “collectives” were then populated by people imported from cities, kidnapped from factories and off cities’ streets, against their wills, to work the land using “scientific Marxist-Leninist principles.” What could go wrong?
The 20th century saw history’s largest famines, where millions died from starvation, exclusively because socialists, using “any means necessary” to obtain power over a nation’s state, and its people, made feeding their populations impossible.
This is a pattern that began in the Soviet Union, then China, as the CCP began to manage agriculture output. Cambodia saw a third of its population starve to death during the time that Pol Pot’s Khmer Rouge applied Marxist principles to its agriculture in the 1970s.
I see these kids protesting capitalism in the news, as they demand socialism to take over the United States. One has to go to college to get that stupid!
Back to Russia and the Ukraine. The Ukraine, as Russia’s bread basket, experienced the brunt of Stalin’s revolution in agriculture. Millions of Ukrainians died of starvation. Apparently in the 2020s, for many Ukrainians, Stalin’s agricultural reforms haven’t been forgotten, or forgiven. But to have a better future, it’s best to bury the past along with its dead, something the current leadership in Ukraine isn’t willing to do, just yet.
So, I see this as the core problem for the current conflict between Ukraine and Russia; Ukraine, the former “breadbasket of Russia,” took the brunt of most of Stalin’s brutal collectivization of agriculture. For those Ukrainians who were not murdered, or exiled to Siberia, their hatred of Russians still burns brightly. That significant areas of eastern Ukraine are now populated by ethnic Russians, people forced to immigrate to Ukraine against their will by Stalin ninety years ago, is a bitter point Ukrainians still greatly resent to this day.
It’s good that Trump has given his best effort in attempting to end this war between Ukraine and Russia. That so far he has failed, isn’t a surprise to me, as there is no way for him to mitigate Ukraine’s hatred for Russia. So, why does NATO now want to get involved in this epic family feud? Not for any purpose of world peace I’m sure.
It’s important to note it isn’t just Ukraine that hates Russia. The West’s Leftist Elite also hate Russia, especially Putin, as they see Russia as selling out the Left, abandoning their communal effort of forming a one-world government.
Politics today in Russia isn’t like those in Nebraska, but they aren’t communist either. Putin, to the shock of the West’s Leftist Elite, proudly supports the Russian Orthodox Church, and he attends its services weekly. They hate that.
Solzhenitsyn’s Gulag Archipelago, a detailed history of the brutality and murder the Bolsheviks inflicted on the Soviet people, is taught today in Russian high-schools. No doubt pointing to the socialism in the EU, saying we aren’t going to make that mistake again!
I doubt Putin forced the Russian people to take the Covid vaccine, a mRNA gene therapy that had zero effect on the actual covid virus, that Bill Gates and the World Health Organization (WHO) attempted to force the global population to accept. How many millions of vaccinated people died from that jab, and who is going to jail for it?
The West’s elites in government, education, journalism, and entertainment are opposing Russia as it currently is. They much prefer the socialist principles of the old Soviet Union, where an “educated elite” rules over the “ignorant masses” with an iron rod. Europe, and America’s elites also hate America’s revolutionary ideas of the late 1770s, where small government is a virtue, and individuals are left alone to pursue their own best interests.
The actual leadership of the EU are all unelected leftists functionaries (the Bullies in Brussels). Faceless bureaucrats who do all they can to impede the free exchange of thought within Europe, for fear of what independent thought could do to them, and the World Economic Forum’s (WEF) hare-brain schemes for the global future. The same is true for Canada, Australia, and New Zealand, and would be true too in the United States, had Donald Trump not been reelected president last November. God bless Donald Trump.
The EU, with its “green revolution” has bankrupted Europe, all because of the leftist’s fiction of “saving the planet from global warming.” They have regulated coal, and nuclear-powered electrical generation out of existence, in favor of solar, and wind driven sources of electrical power. For Europe, green energy has proven to be a disaster. An economic calamity. For lack of affordable electricity, Europe’s economy has become uncompetitive with the rest of the industrial world. And who is to be blamed for all this? Not the EU or WEF, but somehow, someway, Putin and Russia. Who they now must make war on.
The world has become dangerously absurd. Stuck in the quagmire called Ukraine, I’ve seen articles claiming Russia’s next victim will be Sweden. Who writes this hokum? I don’t know. But I do know NATO really does want war with Russia, for no good reason.
So, why is the United States still a member of NATO? We need to get the hell out of Europe, far away from these deranged lunatics, until the old world once again comes to its senses. I pray it doesn’t take a war with Russia to make that happen.
A little humor is called for here. The following is a video from the Jimmy Dore show on Klaus Schwab of the WEF.
Mark J. Lundeen
********

 - CleanTechnica")

