After reaching a new all-time high of USD 2,790 on October 30th, 2024, gold prices experienced a sharp and rapid pullback, hitting a low of USD 2,535 on November 14th. This correction was driven by a combination of speculative profit-taking and broader market dynamics following the U.S. Presidential election. However, geopolitical tensions soon reignited demand for gold as a safe-haven asset, leading to a swift rebound to USD 2,720. From there, another sudden wave of selling pressure emerged, reflecting ongoing volatility in the gold-market.
In the past two weeks, however, gold has demonstrated remarkable resilience, consistently attracting buyers on dips toward the USD 2,610 to USD 2,625 range. This “buy-on-dip” behavior highlights investor optimism amid persistent geopolitical risks, such as conflicts in the Middle East and Ukraine, and expectations of potential interest rate cuts by the Federal Reserve in 2025. Additionally, robust physical demand from Asia, particularly China’s resumed central bank gold purchases in November after a six-month pause, has provided strong support for prices.
As of early December 2024, gold has stabilized around USD 2,640 per ounce and is breaking through the downtrend resistance around USD 2,678. The Federal Reserve’s signals regarding potential rate cuts have bolstered gold’s appeal by reducing the opportunity cost of holding non-yielding assets. Meanwhile, a moderately weakening U.S. Dollar has further supported gold prices. These factors have created an environment where gold remains well-positioned as both a safe-haven asset and an inflation hedge.
Gold in US-Dollar, Weekly chart
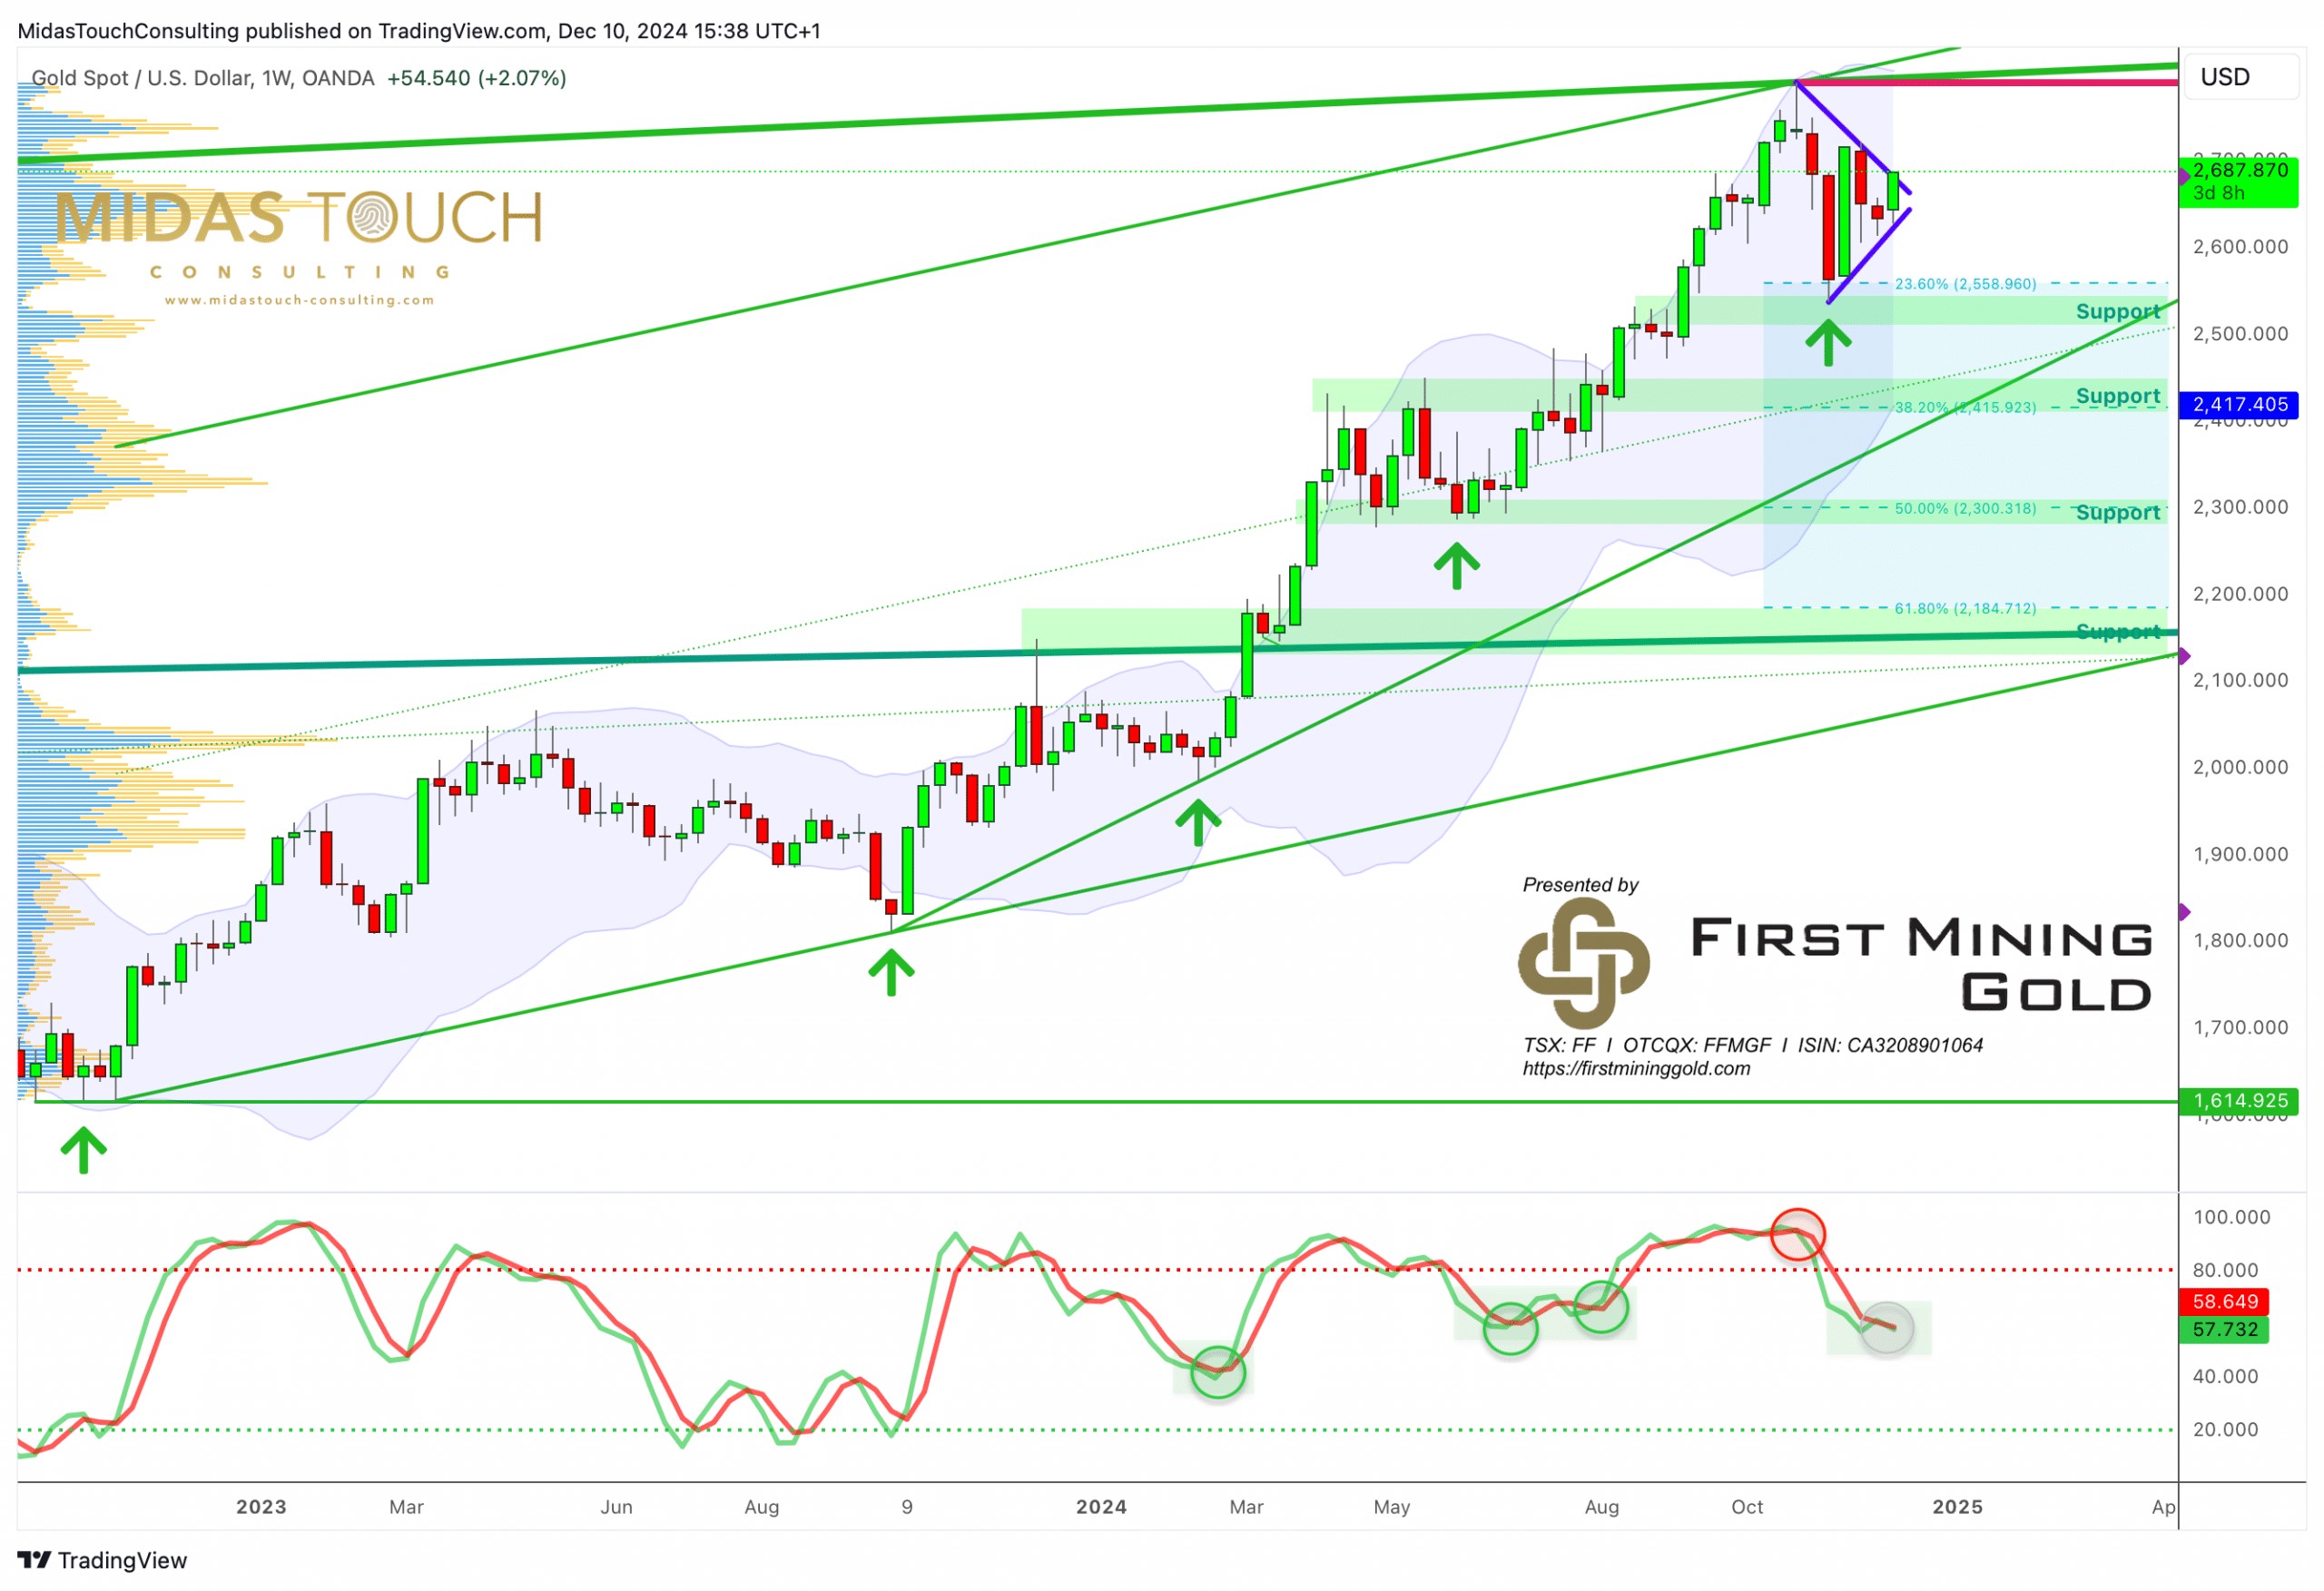
Gold in US-Dollar, weekly chart as of December 10th, 2024. Source: Tradingview
The weekly chart for gold reveals a robust uptrend that has been in place since autumn 2022, when gold established a significant triple bottom around USD 1,615. This pattern, characterized by three distinct lows at approximately the same price level, served as a strong foundation for the subsequent bullish movement since then.
Despite experiencing a notable pullback since late October 2024, the overarching uptrend remains firmly intact. The recent correction, while sharp, has not compromised the integrity of the longer-term bullish trajectory. This resilience underscores the strength of the prevailing upward momentum in the gold market, suggesting that the current pullback may just be a temporary retracement within a larger bullish structure rather than a reversal of the primary trend.
Weekly stochastic oscillator with a sell signal
However, the correction has triggered a sell signal on the weekly stochastic oscillator, which remains active and signals the potential for further downside. However, it’s crucial to note the oscillator’s behavior over the past 13 months. During this period, it has consistently avoided reaching its oversold territory. Instead, the oscillator has repeatedly found support and reversed course in the vicinity of its current levels, always initiating a new upward movement.
This pattern of behavior in the stochastic oscillator provides valuable context for interpreting the current market situation. While the active sell signal cannot be ignored, the tendency for the oscillator to find support and turn upward from similar levels suggests caution in anticipating significant further downside. Traders and investors should closely monitor this area for potential signs of a momentum shift, as it has previously served as a launching pad for renewed upward price action in gold.
Overall, it appears that the majority of the pullback has likely run its course. From a price perspective, we do not anticipate new lows to be established. Instead, the strong support zone between USD 2,610 and USD 2,625 has proven to be a reliable floor for gold prices in recent weeks.
However, it’s important to note that market volatility cannot be entirely discounted. While we don’t expect sustained movement below recent levels, a brief and final dip below USD 2,600 remains a small possibility. Such a move could serve to shake out less committed investors or “weak hands” before potentially resuming the broader uptrend. This scenario would align with typical market behavior where a final washout often precedes a more sustained recovery or upward movement.
Gold in US-Dollar, Daily chart
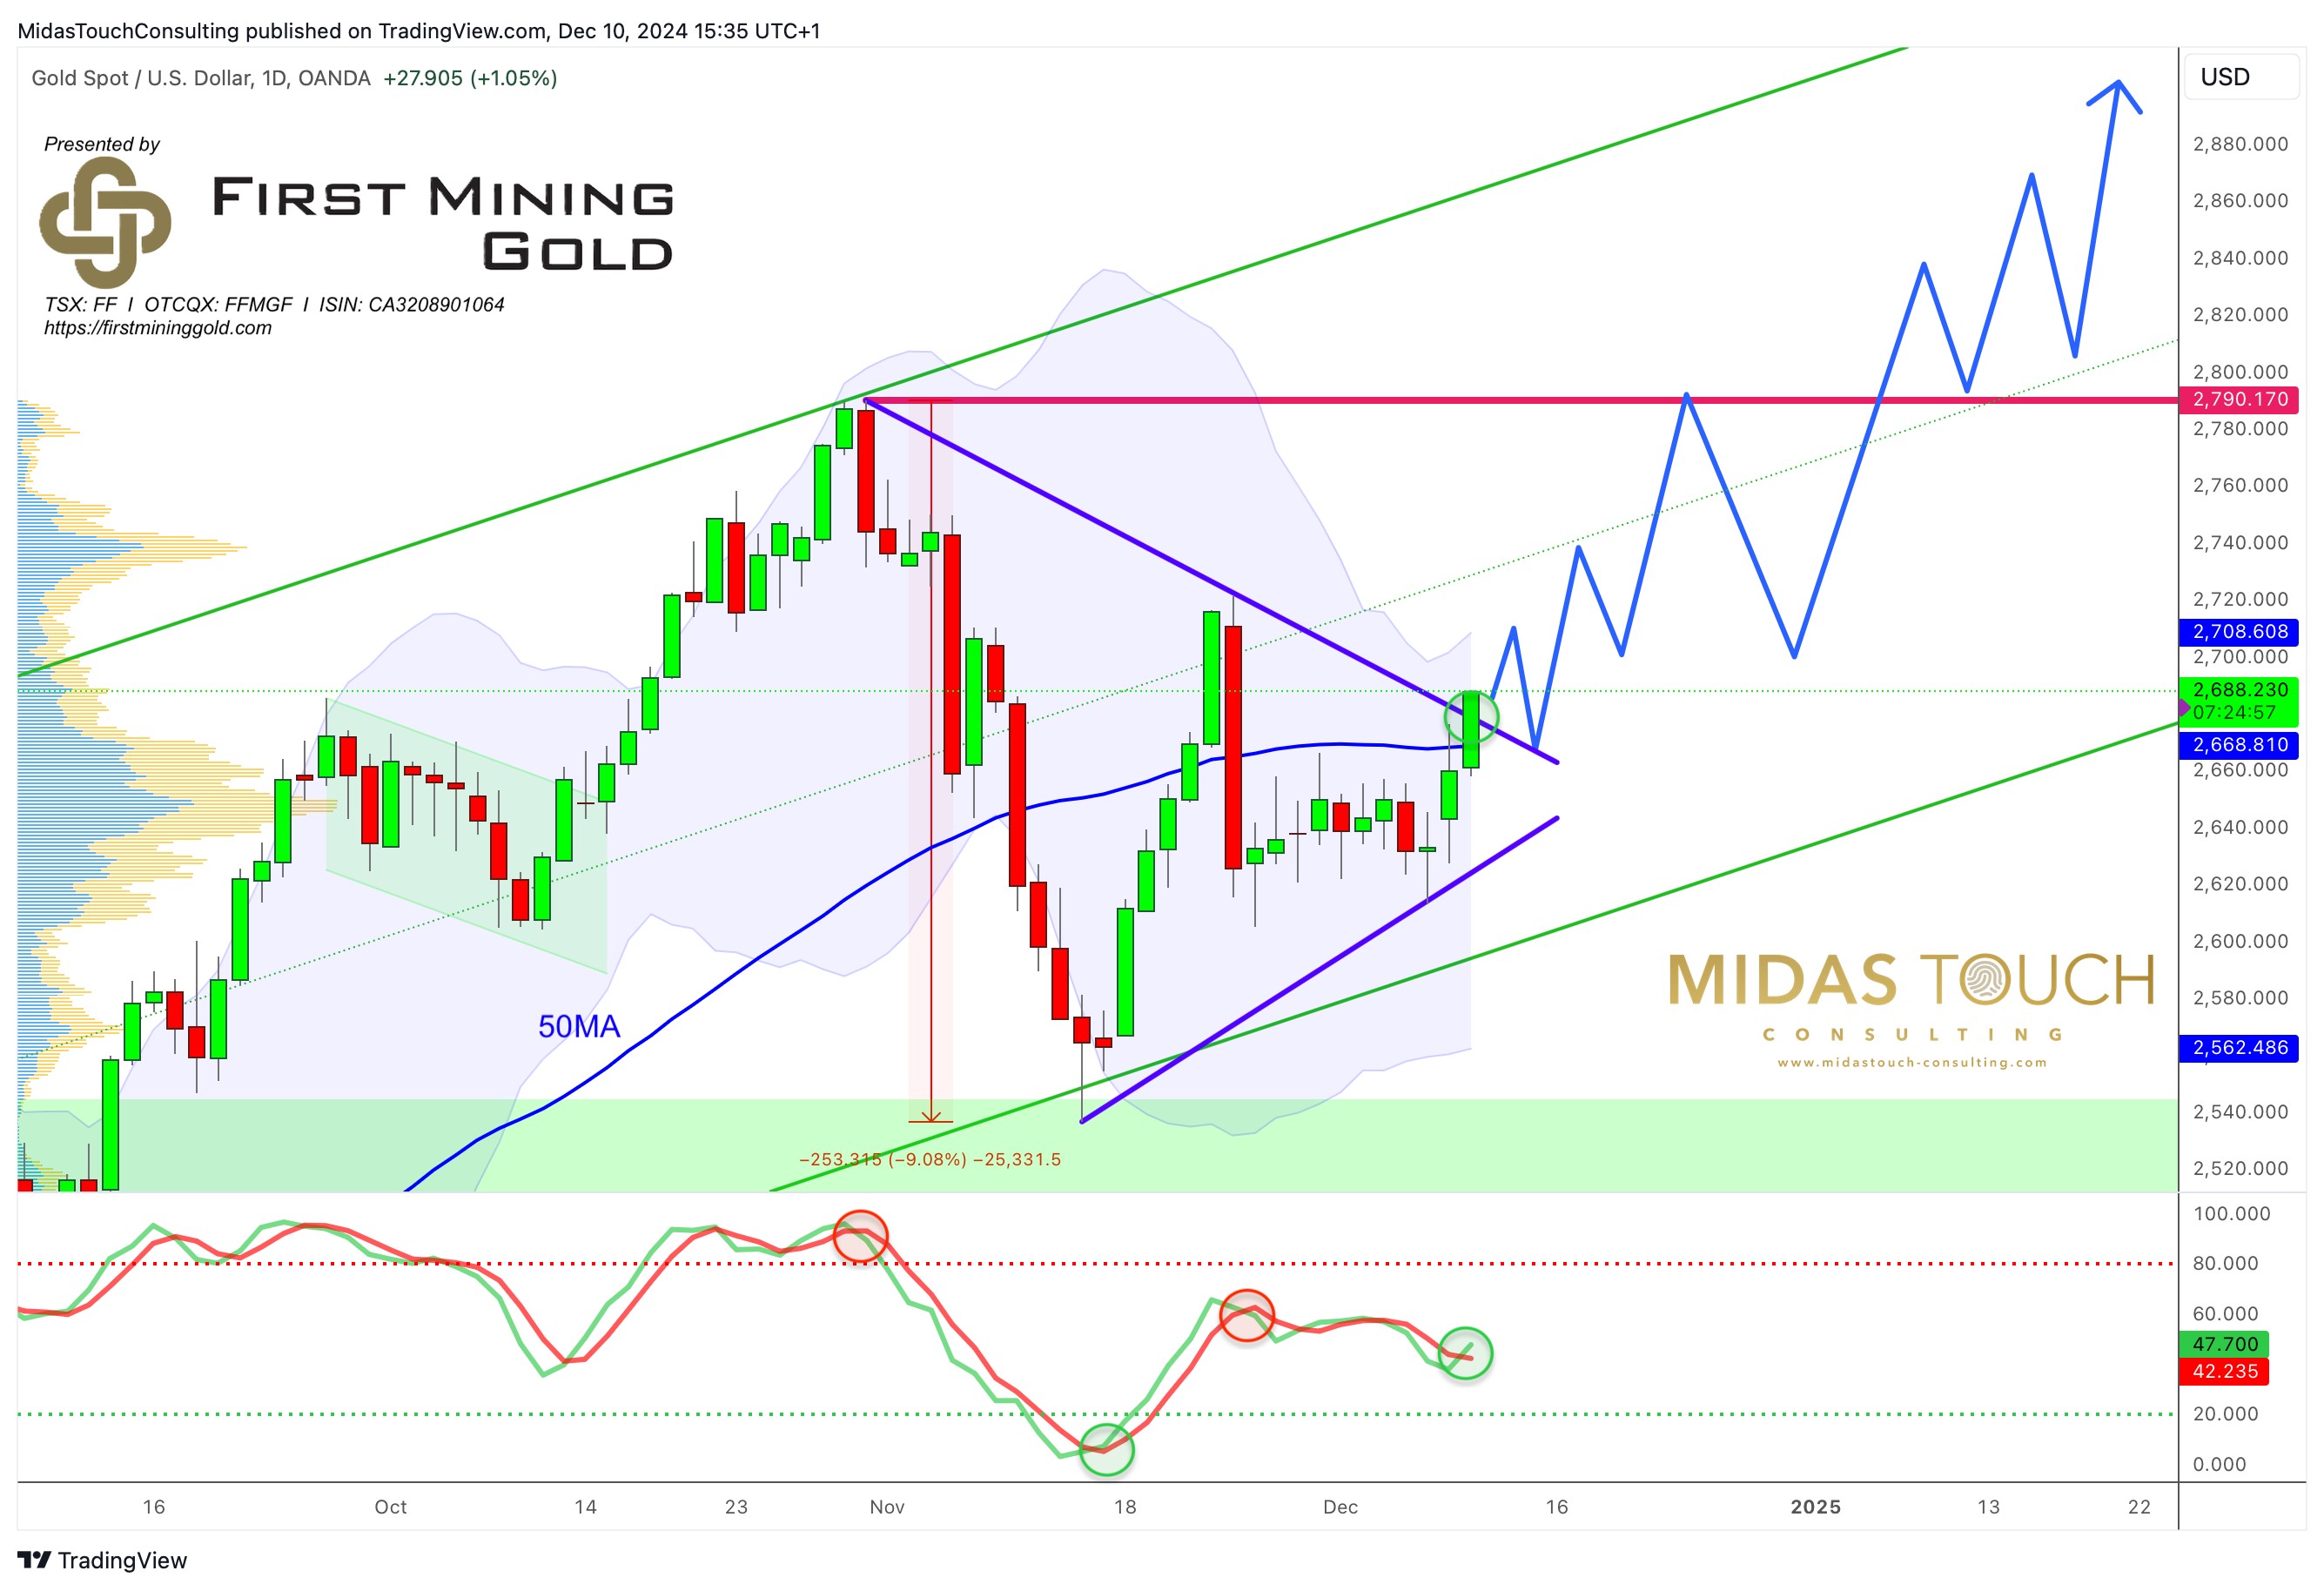
Gold in US-Dollar, daily chart as of December 10th, 2024. Source: Tradingview
On the daily chart, gold has reconquered its 50-day moving average (USD 2,668) while simultaneously approaching the downtrend line that has been in place since the recent new all-time high. The upper Bollinger Band (USD 2,708) already provides potential room for prices to exceed USD 2,700.
Over the last few weeks, our analysis has consistently pointed towards this pullback manifesting as a triangle pattern, which appears to be unfolding as anticipated. This triangle formation, coupled with the ongoing Bollinger Band squeeze, suggests an impending burst over the following one to three weeks.
Hence, as gold has been breaking through USD 2,680 as of today, we expect this consolidation to culminate in a powerful breakout, with momentum likely favoring an upward trajectory given the established bullish trend. This potential upside burst should mark the end of the current corrective phase and possibly signal the resumption of the broader uptrend in gold prices.
Conclusion: Pullback almost complete
Gold prices have demonstrated remarkable resilience and volatility in recent weeks. The turbulent roller-coaster that ensued after reaching the new all-time high appears to have subsided. Instead, price action has calmed down in the last two weeks. However, geopolitical tensions and reignited safe haven continue to support gold.
In the worst case, we could imagine one more pullback towards and maybe slightly below USD 2,600 around or before the last FOMC meeting for 2024 (Dec 17-18). Otherwise, and that seems to be much more probable, gold has broken through the downtrend line and is already on the way to USD 2,700 – 2,720. Once this next resistance is cleared the all-time high at USD 2,790 should quickly become the next target.
********


