We directly start with this as culled from the second paragraph penned herein a week ago:
“…But in seeing the Dollar take flight to start this year … along with the Bond’s fresh demise as yields rise, might renewed inflation be taking first prize? In other words: what if the Fed instead tightens … surprise!…”
And in that vein, true to form, this past Thursday’s release of the StateSide Consumer Price Index for December posted a +0.3% rise in retail inflation over that recorded for November, in turn increasing the 12-month summation from +3.1% to +3.3%; and should you neither eat nor drive, that for the “Core” rate is now +3.9%. As we’ve previously mused with respect to the Federal Reserve’s Open Market Committee, perhaps +4% is the new +2%.
Yet fortunately come Friday, the Bureau of Labor Statistics’ ringside timekeeper rang the bell to save the academically forward-looking Producer Price Index. That registered wholesale inflation as -0.1% December deflation, a number far more in line with November’s “Fed-favoured” Personal Consumption Expenditures Indices; (December’s are due 26 January).
But wait, there’s more: should we be deflating, evidenced by prices actually falling…
“C’mon, mmb, that never happens…”
…Squire you weren’t around in the early 30s. But to your point, at the retail level we cannot recall prices in general receding, save for there being a “SALE!” Why, even the cost here of our preferred Bordeaux is +23% from just a year ago. No deflation there.
And yet if deflation indeed rears its depressive head, ought the Fed cut rates right now? Why wait whatsoever for the FOMC’s 31 January Policy Statement? The Great Greenspan didn’t wait back in January 2001; he exceptionally slashed the FedFunds rate -0.5% astride an earnings-less DotComBomb in freefall. Might we today similarly see Prescient Powell do same should the earnings-lacking Casino 500 slip into an icy, glacial crevasse? Our “live” price/earnings ratio for that S&P 500 is now 46.5x, and you ad nauseum know, there ain’t the dough to cover that show, (S&P Market Cap now $41.8T vs. “M2” Money Supply $20.9T).
Further, from the “Oh by the Way Dept.” the 12-month CPI summation for the year 2000 was +3.3% as ’twas just recorded for 2023. Then following into 2001, the S&P was down as much as -28.4%. Might we thus see 2001 all over again? What with so-so earnings, plus a safer and better yield by far in the debt market, ’tis just one of those “stars-are-aligned” things that make us go “hmmm…”
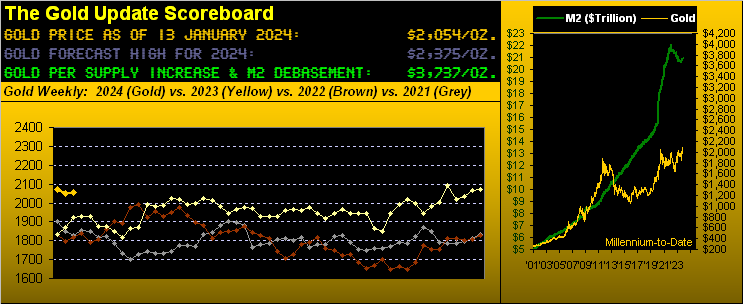
However, “hmmm…” also expresses this past week for Gold. Upon all the inflationary/deflationary dust settling, Gold itself settled the week yesterday (Friday) at 2054, a sleepy net point gain for the five days of +1. Biding its time, here are Gold’s weekly bars from a year ago-to-date:
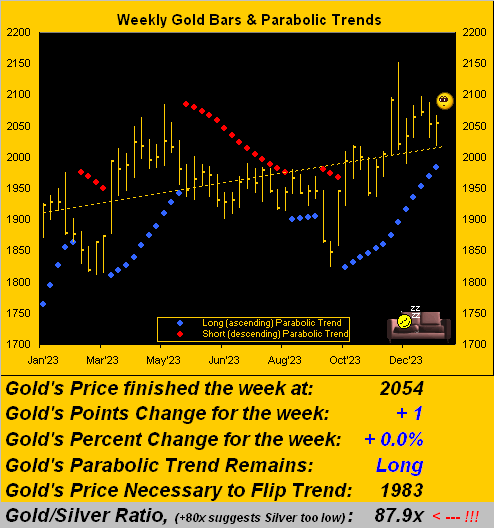
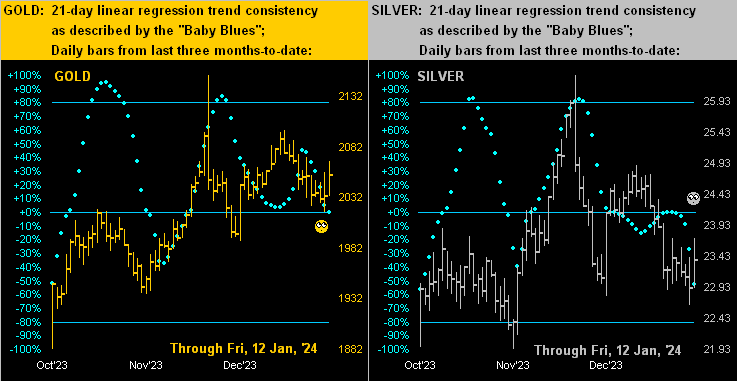
Therein, the good news is Gold’s resilience off the week’s low (2017) from the CPI blow, again saved by the bell per the PPI sub-zero. Still by a whole host of daily mainstream technicals, Gold can be couched at present as rather namby-pamby. To be sure per the above chart, both the blue-dotted parabolic trend and overall dashed linear regression trend remain positive. But let’s leap to the less robust daily depiction per our proprietary technicals, notably the last three months-to-date for Gold below left and for Silver below right. For both precious metals, their respective baby blue dots of regression trend consistency continue to drop, (the old adage of course being “Follow the blues instead of the news, else lose your shoes”). Here’s the graphic by the daily bars:
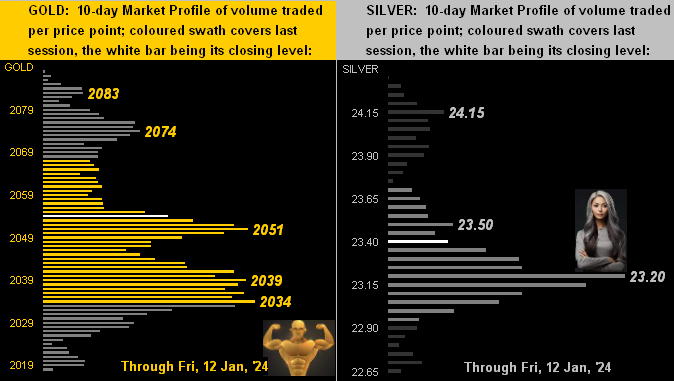
That stated, the 10-day precious metals’ Market Profiles are at present supportive of price. Below for Gold on the left, the 2051-2034 zone looks fairly firm (despite the aforementioned 2017 weekly low), whilst on the right for Sister Silver, that same 23.20 remains her volume-dominant price support.
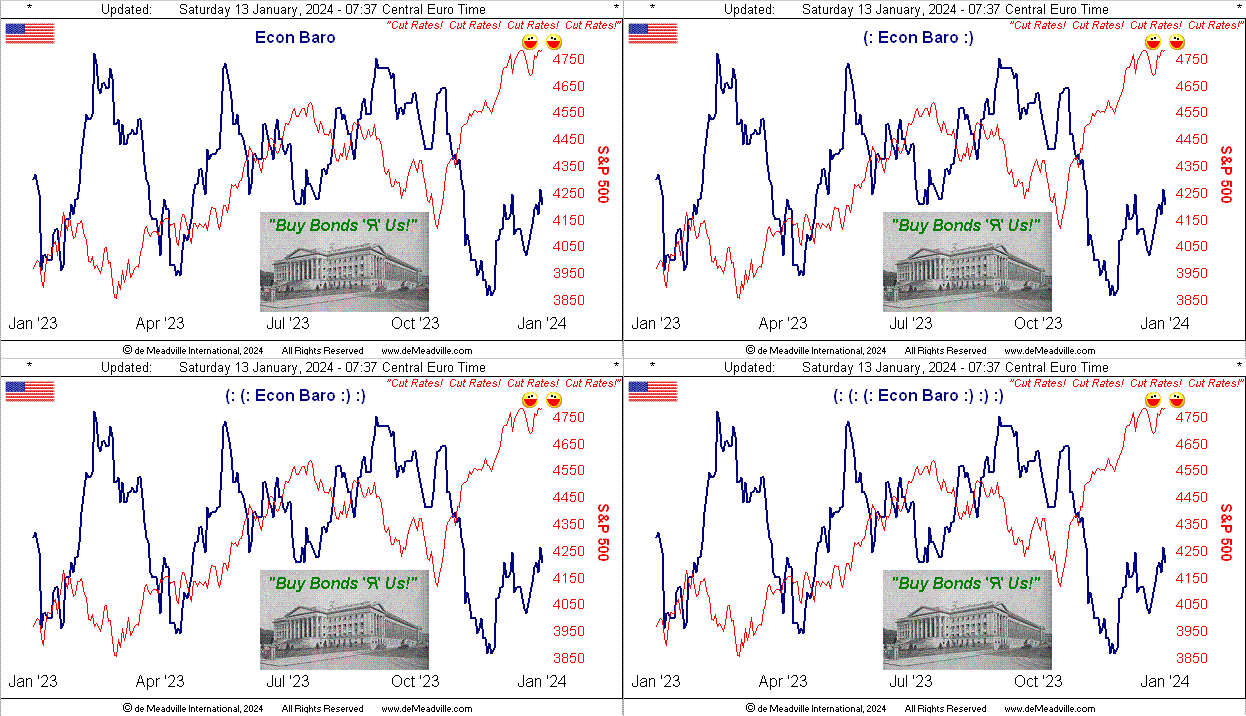
On to the Economic Barometer, which from its 06 December low has been ratcheting up in recovery. Specific to this past week’s array of just nine incoming metrics — December’s zany inflation/deflation notwithstanding — we categorize just one as “worse” period-over-period (and yes ’tis boring): November’s Wholesale Inventories reduced at a slower pace than those for October. Otherwise, everything’s “Great!” (recall the Baro herein a week ago). Why, the Monthly Treasure Deficit for December was better than halved from November … so exciting, non? (Well, maybe not, depending on one’s contextual data source). Here’s the whole year-over-year picture:
“And now for something completely different” –[Monty Python, ’71]. Rarely do we bring up bits**t…
“Now, now, mmb…”
…yes, Squire, ok, “Bitcoin”. But it did take prime time billing this past week in anticipated –and in turn — approval of 11 exchange-traded funds now tradable (including from some high-level names such as Franklin Templeton, Blackrock, and Fidelity). And whereas with both Gold and the Casino 500 we’ve mathematical extremes vis-à-vis price and valuation (the former priced way too low and the latter way too high), with Bitcoin price is valuation given ’tis something based on nothing beyond a fixed supply. Reprise: “The market is never wrong”; ’tis where the traders have placed Bitcoin: thus ’tis priced right at valuation, pure and simple. Through transactional growth should Bitcoin gain further acceptance toward supplementing worthless fiat currencies, the price ought materially rise  “as time goes by…”
 –[Herman Hupfeld ’31].
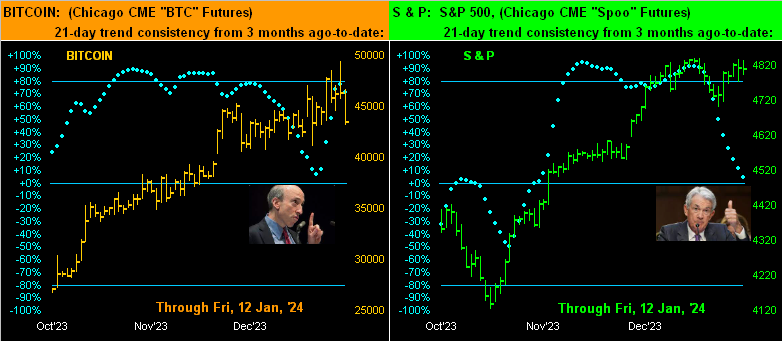
Either way, we decided to take a peek at “The Now” for Bitcoin. Since the SEC’s cautionary “Gensler Granting” of the ETFs this past Thursday, Wall Street treated Bitcoin as essentially it does “all things” anticipated: the rumour having been bought, the news then was sold. ‘Tis depicted here (at left) across the past three months-to-date, the rightmost two days evident of the peak (futs 49,435) and subsequent sell (futs now 43,425). The “Baby Blues” nicely captured the consistency of the recent run up before pipping down on Friday. For the present, the strength of the broader trend across the panel is encouraging, however there’s that unfilled gap from 04 December (39,640 to 40,325); still, because Bitcoin spot trades ’round the clock, such unfilled gap may be mere talk. But not so much mere talk are the S&P futures (at right), the “Baby Blues” therein extending their descent. “Got stock?” Sorry to hear that:
Thus there we are for this week as Gold bided its time whilst Bitcoin saw prime time … at least for a bit. Directionally near-term for Bitcoin, we’re clueless. Broadly for Gold we’ve no concerns. But for the Casino 500, we’re worried the whole roulette wheel could fly right off the spindle (given we do the earnings — or lack thereof — math). Regardless with respect to the latter, the children’s writing pool over at the once-mighty Barron’s ran this past week with “Why S&P 500 Pain Could Turn to Gains”. What pain? There’s been no S&P pain since the January-October “owie” back in 2022. Which in turn (save for the brief COVID crash and dash) pales in comparison to the last real pain from the 2007-2009 FinCrisis. But through generational turnover in today’s “stocks never go down” bubblesphere, this is to where we’ve arrived. And when the fear sets in that upon selling one’s stock, one might not actually receive the proceeds, the stock market rather than crashing might instead simply shutdown … just a passing thought.
GOT GOLD???

Cheers!
…m…
www.TheGoldUpdate.com
www.deMeadville.com
and now on “X”: @deMeadvillePro
********

