Seasoned supporters of Gold well remember the late, great Richard Russell (decd. 2015), who said, (as on occasion herein reprised): “There’s never a bad time to buy Gold.” Surely in his ascended state, his spirit veritably senses vindication of such declaration.
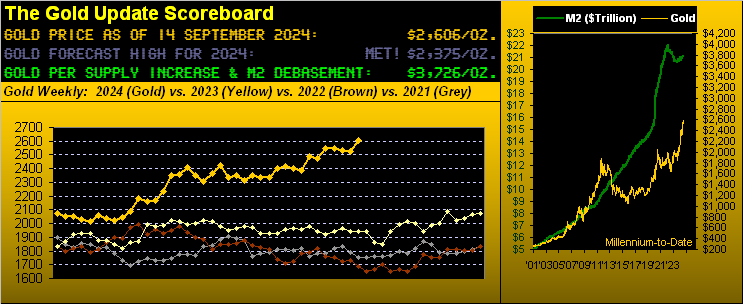
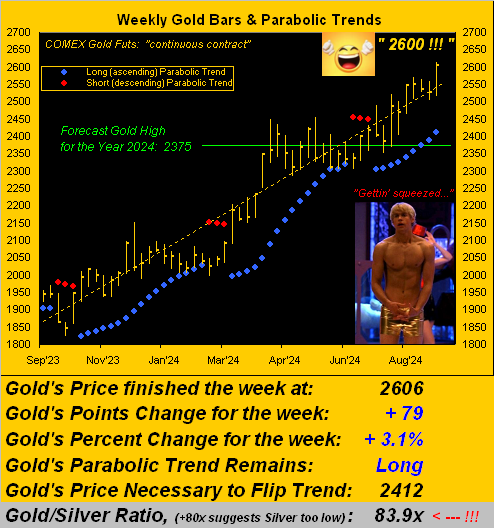
Indeed: Gold per the December contract settled yesterday (Friday) at 2606, its highest-ever closing price, en route having traded up to 2615, +45 points above the prior All-Time High recently recorded on 20 August at 2570. And thus The Gold Update’s nearly 15 years of querying “Got Gold?”, too, is being vindicated.
Since our first edition dated 21 November 2009, the price of Gold is +126% from 1151 to now 2606. Oh to be sure, the Great American Savings Account (aka The S&P 500, “Casino 500”, “Airhead 500” et alia) is across the like stint +415% from 1091 to now 5626, (plus all those dividends en route). Yet as we regularly caution from “The Means Reversion Dept.”, the S&P’s “live” price/earnings ratio today is 41.6x which is +70% above its inception (in 2013) at 25.4x, whereas Gold today at 2606 is -30% below the opening Scoreboard’s debasement level of 3726
“So why are you going on about all this, mmb?
Because simply, Squire, were both Gold and the S&P to revert to such means at this instant, the yellow metal would instead be +224%, ahead of the “Casino 500” +215% (again, before dividends). Still, not much difference there, however means reversion eventually recurs and shakes emotive folks out of stocks, whereas Gold buyers do otherwise. (“Tick tick tick goes the clock clock clock…”)
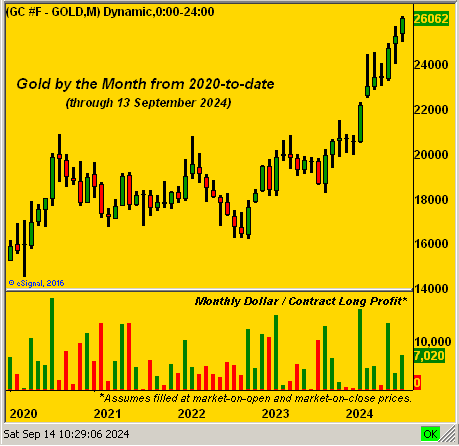
And given the yellow metal’s recent run to these record high skies, Gold buyers clearly have been wise. The following chart is of Gold by the month from the year 2020-to-date. The key here is the region of the lower panel thus far in 2024. Each green bar is the month’s profit per Gold contract purchased. So thus far through the nine trading days of September, the height of the rightmost bar as noted is $7,020/contract, had you bought one at the month’s opening precise price of 2536.0. The gain to the current precise price of 2606.2 is +70.2 points which by the leverage of $100/contract yields that $7,020; (for you home-scorers, that is a nine-day gain of +60.8% given a per contract margin requirement of $11,550). But the point is: the year-to-date buying participation in Gold is the best ’tis been since COVID kicked in back in 2020. In fact, per the barely visible red bars since a year ago, for Gold ’tis been all monetary inflow:
‘Course, beyond the catalyst of currency debasement, ours is not to reason “why” Gold is getting the buy. In a sense, the Federal Reserve’s initial -0.250% FundsRate cut this next Wednesday (18 September) ought by now be “priced-in”. As to some degree, too, is further global instability per the pending StateSide election outcome. Let’s cue it again: “Got Gold?”
We’ve got Gold right here in turning to its weekly bars and dotted-parabolic trends from one year ago-to-date. And are the strings of blue dots ever one’s friend … barring your being one of those Smart Alec Shorts. Welcome to 2600:
Meanwhile, trying to un-squeeze itself is the Economic Barometer, it having received a boost these last few weeks. And given “the rising tide of inflation lifts all boats”, August’s newly reported levels thereto at both the wholesale (Producer Price Index) and retail (Consumer Price Index) levels on balance pipped back up a bit, notably in their “core” readings. This adds to our aforementioned assessment that — come Wednesday — the Fed shall only cut their FundsRate by 25 basis points rather than by 50, albeit the latter curiously is still sought per the FedFundsFutures. But let’s see if that trade unwinds as we work toward Wednesday. Here’s the Baro:
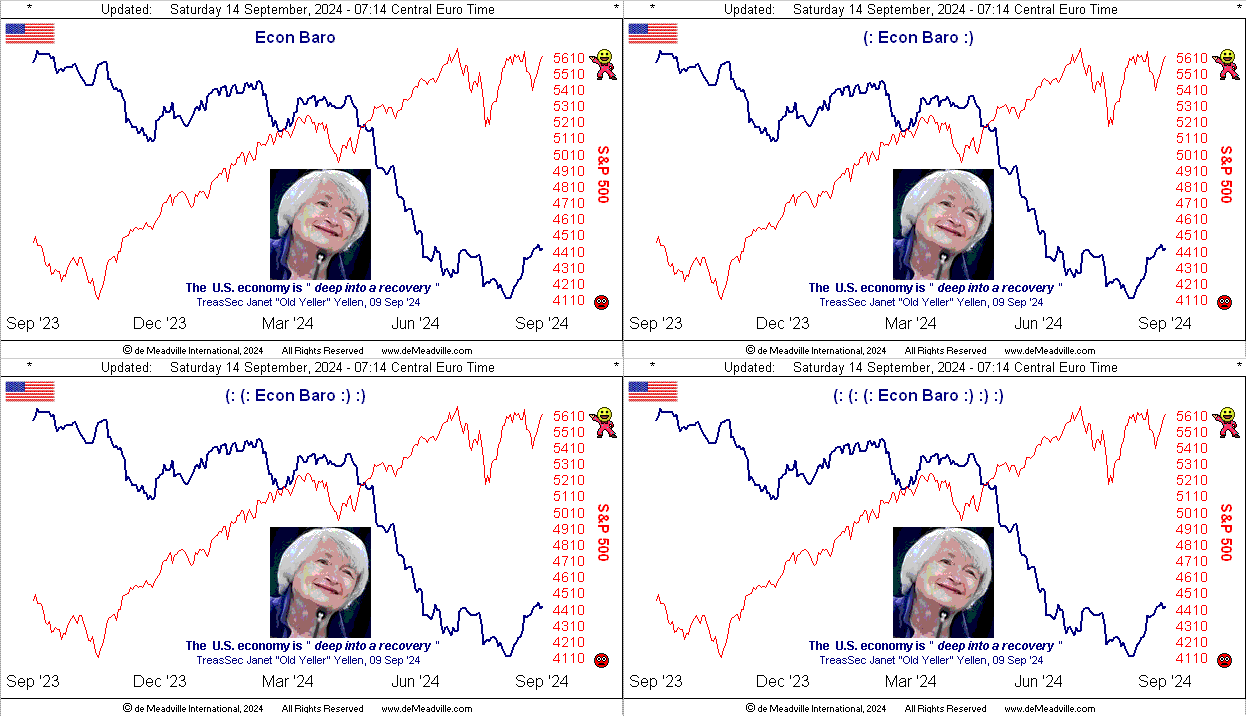
You tell ’em, Yellen; but more aptly by the Baro, it instead appears “deep into a recession”. (Just sayin’, but that’s Washington…)
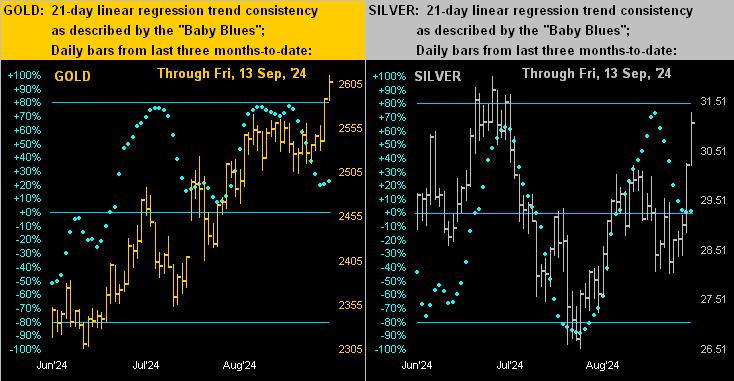
Next we go back to the precious metals, the following two-panel graphic featuring on the left Gold’s daily bars from three months ago-to-date, with same on the right for Silver. For the yellow metal ’tis been “all on go”, whilst for the white metal — despite her recent rightmost up-kick — she’s been more aligned with red metal Copper these recent months. Further, Sister Silver by price continues to lag Gold: the century-to-date average Gold/Silver ratio is 68.4x … but the actual ratio at present is 83.9x. And yes, just as both Gold inevitably reverts to its Dollar debasement value and the S&P 500 to its average P/E ratio, so too does the Gold/Silver ratio revert to its mean: which with Gold today at 2606 in turn prices Silver +23% above her current 31.07 level at 38.08. Thus as we yet again ask “Got Gold?”, we in kind also reprise “Do not forget the Silver!” Here’s the graphic:
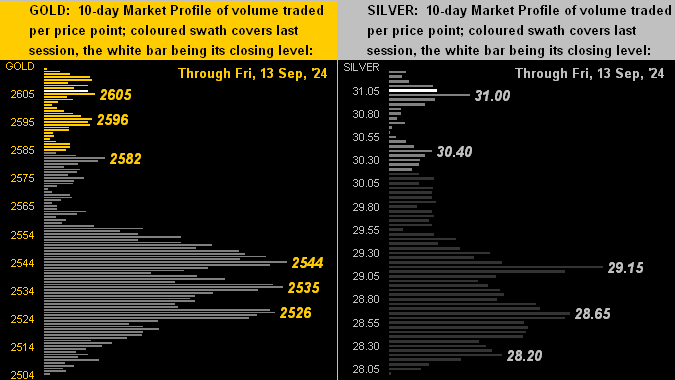
As to the respective 10-day Market Profiles, here they are for Gold (below left) and for Silver (below right). Whilst ’tis nice to see no overhead trading resistors, there are for both metals derths of volume activity below current levels, which for you WestPalmBeachers down there means don’t expect these two markets to keep moving up in a straight line. Too, should you peek at the website’s Gold page, you’ll see that price by the “Market Value” metric is +114 points above its smooth valuation line (as therein described). Either way, these Profiles at present are pretty:
So with respect to fresh highs for Gold, let’s update the stack:
The Gold Stack
Gold’s Value per Dollar Debasement, (from our opening “Scoreboard”): 3726
Gold’s All-Time Intra-Day High: 2615 (13 September 2024)
2024’s High: 2615 (13 September 2024)
10-Session directional range: up to 2615 (from 2504) = +111 points or +4.4%
Gold’s All-Time Closing High: 2606 (13 September 2024)
Trading Resistance: none per the Profile 2341
Gold Currently: 2606, (expected daily trading range [“EDTR”]: 32 points)
Trading Support: nearby per the Profile 2605 / 2596 / 2582, then 2544-2526
10-Session “volume-weighted” average price magnet: 2545
The Weekly Parabolic Price to flip Short: 2415
The 300-Day Moving Average: 2159 and rising
The 2000’s Triple-Top: 2089 (07 Aug ’20); 2079 (08 Mar’22); 2085 (04 May ’23)
2024’s Low: 1996 (14 February)
The Gateway to 2000: 1900+
The Final Frontier: 1800-1900
The Northern Front: 1800-1750
On Maneuvers: 1750-1579
The Floor: 1579-1466
Le Sous-sol: Sub-1466
The Support Shelf: 1454-1434
Base Camp: 1377
The 1360s Double-Top: 1369 in Apr ’18 preceded by 1362 in Sep ’17
Neverland: The Whiny 1290s
The Box: 1280-1240
Thus into the new week we go, with 14 metrics due for the Econ Baro, plus of course the Federal Open Market Committee’s Policy Statement on Wednesday. More broadly, bear in mind that:
- Equities per the S&P 500 remain exceedingly (understatement) expensive given the lack of supportive earnings generation;
- Gold despite new All-Time Highs remains cheap relative to Dollar debasement;
- Silver relative to Gold remains super cheap!
And so to segue from those closing notes:

Indeed be buyer-wise with Gold (and Silver!) as the prize!
Cheers!
…m…
www.TheGoldUpdate.com
www.deMeadville.com
and now on “X”: @deMeadvillePro
********

