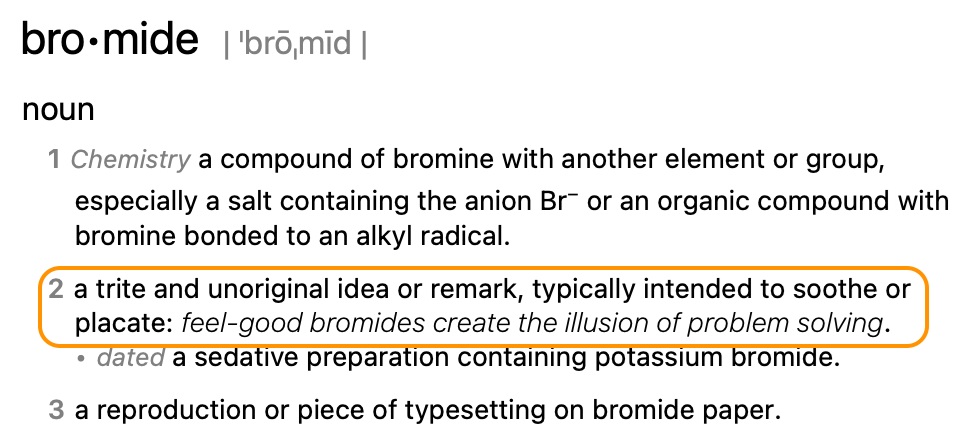
“Don’t Fight the Fed” is a bromide you might want to ignore on this cycle
This article is inspired by a headline I saw in the media while checking out the real-time 10-2yr yield curve. It was a few weeks ago that the “pro” subscribers at CNBC were treated to that sweet nothing, but little has changed since then.
 cnbc.com
Here is the thing; the media were trumpeting bearish during the inversion and they’ve been trumpeting relief and bullishness since the dreaded inversion ended. It was wrong to be bearish during the inversion, and at some point if history holds true, it will be wrong to be bullish during the steepener.
I think that “don’t fight the Fed” works best at market bottoms (e.g. Q1, 2020), when the Fed is in balls-out inflate the money supply mode, as opposed to times like now, with stocks in nosebleed territory and, well, this…

Yeah yeah, I’ve been showing this chart all year to no ill market effect. I’ve also been showing it while anticipating “to or through the election” all year, with respect to the bull market’s timing. A fact of history is that divergences in the 2yr Treasury yield to the 3 month T-bill yield (Fed Funds proxy) preceded the last two real bear markets.
As for 2020 and 2022? One was a flash crash and recovery at the hands of inflationary policies and the other was not a bear market. It was a correction. Handily, one reason we did not call it a bear market (aside from the fact that SPX major trends remained up) was the chart above. Do you see any divergence between the 2yr and the 3mo on the chart in 2022? Me neither. The divergence began during the subsequent bull phase, as implied by the 2000 and especially 2008 occasions.
Bull markets don’t end at the beginning of a Fed tightening cycle (which had only just begun in 2022); they end after the Fed has tightened enough and the media reassure the public with bromides like “don’t fight the [now easing] Fed”.
Back on yield curves, the only reason that the 10yr-3mo curve is still inverted is that the Fed has not caught up to the market’s signals yet. The Fed is tardy, as it was in taking up the inflation fight to begin with. Here is the 10yr-3mo looking poised to un-invert.

When it does so, it will join its fellow, the 10-2yr, in steepening territory and a forward cyclical economic bust signal. The shaded areas are, as I am sure you know, recessions.
 St. Louis Fed
The negative divergence of the 3mo to the 2yr is simply the product of policy to this point. Sadly for Team “Don’t Fight the Fed”, if/as the Fed continues to cut rates, it will very likely drive T-bill yields down in relation to long-term yields. That would steepen the curve out of its inversion and an economic bust signal to join the 2yr curve.
There is an alternative scenario in play as well, however. That would be for a new inflation cycle to begin sooner, rather than later (after an interim deflation scare). Yield curves steepen under deflationary or inflationary pressure. Either way, it will not be a good thing.
If it’s deflationary steepening, most items other than Treasury bonds (short-term much preferred) and USD will probably get hammered and/or enter bear markets. If it’s inflationary, things could really get off the hook with markets holding up reasonably well, but serious out-performance by the traditional “inflation trades” and stagflation eating away at the economic cycle.
I am getting too talky with some complicated stuff. Reflect, and if nothing else, take the mainstream media with a huge chunk of rock salt.
For “best of breed” top down analysis of all major markets, subscribe to NFTRH Premium, which includes an in-depth weekly market report, detailed market updates and NFTRH+ dynamic updates and chart/trade setup ideas. You can easily subscribe by Credit Card or PayPal (see all info and options). Keep up to date with actionable public content at NFTRH.com by using the email form on the right sidebar, or take it to another (intermediate) level with our free eLetter. Follow via Twitter@NFTRHgt.
*********


