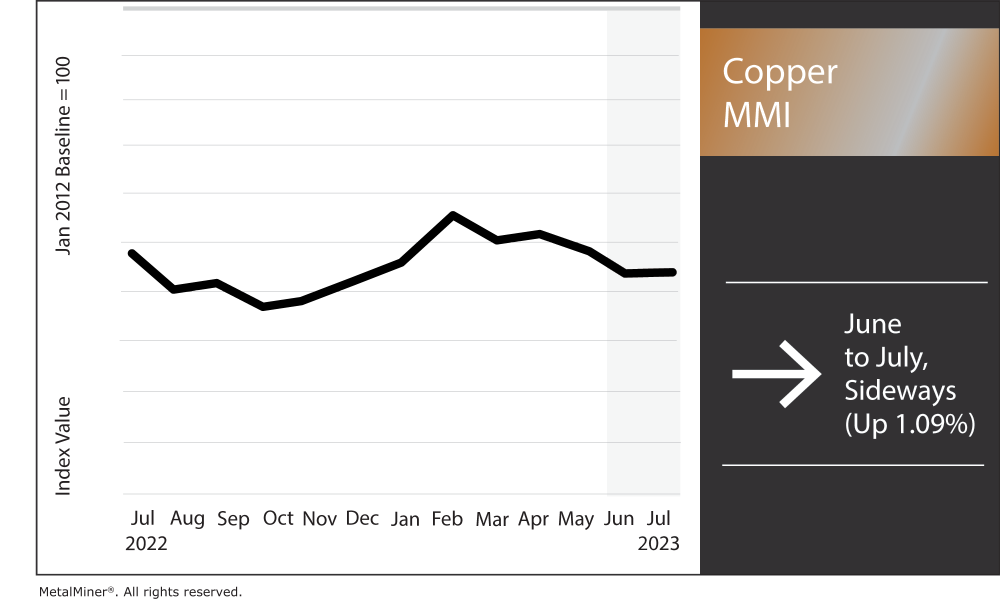
The Copper Monthly Metals Index (MMI) moved sideways, increasing by a modest 1.09% from June to July. Copper prices appear sideways after last month’s rally faltered. After June 22, prices began to retrace, but found a bottom by the end of the month. They then enjoyed a modest rise during the first week of July. The current price direction does not support a strong enough trend to either side, which leaves the market uncertain and prone to volatility in the short term. However, at the start of the month, current copper prices began to form bullish patterns that show the potential for upside reversal. Copper price action would need to continue up and break through resistance levels to establish a meaningful uptrend.
The MetalMiner free weekly newsletter covers current copper prices, market shifts and the macroeconomic factors that impact industrial metal prices.

Copper Prices Fall Amid Lack of Further Chinese Stimulus
After last month’s rally faltered and failed to overtake its mid-April high, copper prices appear directionally uncertain. Stimulus measures from China, which included a sequence of interest rate reductions, proved too little to sustain an upside breakout, as prices began to retrace to their current trading range.
Markets assumed more stimulus would come following Beijing’s initial steps, which were very modest. However, those have yet to materialize despite rhetoric from numerous authorities stoking those expectations. Premier Li Qiang stated in a meeting with economists that “targeted, comprehensive and well-coordinated” stimulus would be announced “in a timely manner.”

However, China’s early July appointment of Pan Gongsheng as the new head of the People’s Bank of China suggests current monetary policy will likely remain unchanged. Pan had previously noted his defense of the PBOC’s choice to “keep a normal monetary policy” with no major adjustments to interest rates. Part of the problem for China is the current spread between the yuan and the U.S. dollar. Indeed, the yuan recently reached an over-15-year low against the dollar. As numerous central banks continue to tighten monetary policy, any major cuts on the part of the PBOC will pose a risk of further decline for the yuan.
See why technical analysis is a superior forecasting methodology over fundamental analysis and why it matters for your copper buy.
China Manufacturing Growth Slows as U.S. Remains in Contraction
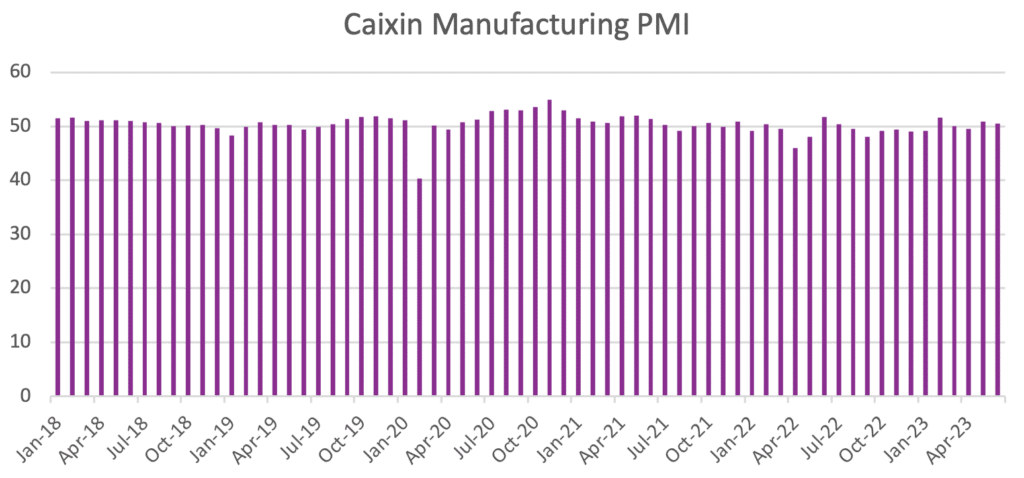
Without any further stimulus, the growth of China’s manufacturing sector slowed in June. Indeed, the China Caixin Manufacturing PMI fell from 50.9 in May to 50.5. However, official statistics paint an even worse picture. Though the official National Bureau of Statistics Manufacturing PMI edged upward from May, it remained in contraction for the third consecutive month at 49.0. Meanwhile, neither index showed any significant jump in new orders, though the Caixin PMI did demonstrate some mild growth.


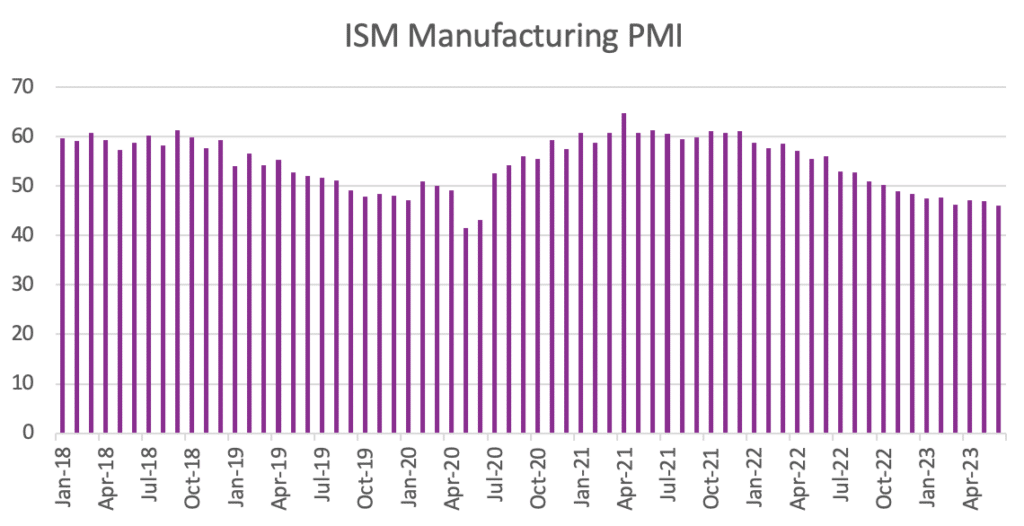
As China’s manufacturing sector offers little upside to copper demand, the U.S. manufacturing sector continued to shrink. This has further hindered any meaningful upside breakout for copper prices. For instance, June saw the eighth consecutive month of contraction for the U.S. ISM Manufacturing PMI. That month, the index dropped from 46.9 in May to 46.0, the lowest reading since June 2020. The Production Index saw the largest decline among its subindexes, dropping 4.4 percentage points to 51.1.
Make sure you are following the 5 Best Practices for Sourcing Copper.
Falling Inventories Add Support, Market Consensus Mixed

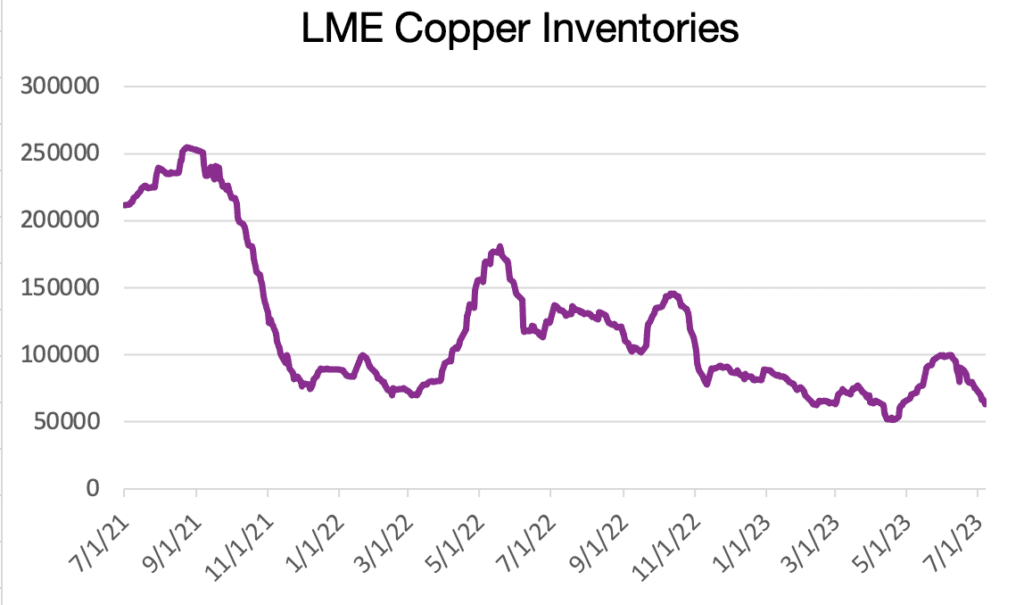
Despite the manufacturing weakness that saw the copper rally peak last month, prices stopped short of resuming the downtrend seen throughout May and April. Meanwhile, falling LME inventory levels helped cap losses enough to pull prices sideways. After they rose to their highest level since November 2022 on June 7, stocks saw sharp declines during the remainder of the month. This led to an over 37% drop in three weeks, bringing inventories back down to their lowest levels since late April.
Generally, inventory levels have an almost negligible correlation with copper prices. However, the tighter supply seemed enough of a catalyst to cause investment funds to return to net long positions after sitting net short at the beginning of the month. Meanwhile, commercial undertakings sat net short at the end of June, suggesting no real market consensus on the fate of copper prices. Ongoing weakness in the West remains a strong drag on copper demand and, thus, prices. As a result, a lot depends on whether or not China can pull itself out of its current slump.
Don’t miss out. Join the MetalMiner LinkedIn group today for news on aluminum, steel, and copper (oh my!).
Biggest Shifts in Current Copper Prices
- Chinese copper wire prices saw the index’s largest increase, with a modest 1.98% rise to $9,384 per metric ton as of July 1.
- Chinese primary cash copper prices increased by 1.84% to $9,351 per metric ton.
- U.S. grade 110 and 122 copper producer prices rose 1.49% to $4.77 per pound.
- U.S. grade 102 copper producer prices saw a 1.42% increase to $4.99 per pound.
- Meanwhile, Korean copper strip prices fell 1.79% to $10.68 per kilogram.


