The Copper Monthly Metals Index (MMI) held sideways, although the upside bias appeared to accelerate. In total, the index rose 1.64% from January to February, supported by rising U.S. copper prices. Keep up with the latest tariff news impacting copper prices. Subscribe to MetalMiner’s free weekly newsletter.

Copper Prices Bullish as Exchange Delta Grows
Traders continue to price the expectation of tariffs in the United States. Meanwhile, Comex copper prices closed February 10 at their highest level since October, reaching $10,163/mt. While LME copper prices are also up since the start of the year, those gains have failed to keep up with their Comex counterparts. With LME prices standing at $9,410/mt, the delta between the two exchanges now sits at a record high of $753/mt.

The Comex premium appears to be almost entirely the result of market concerns, as copper imports have not yet been the subject of duties. Currently, the 25% blanket tariffs on Canada and Mexico remain on pause, and the most recent 25% tariffs only apply to steel and aluminum imports. However, traders have taken Trump’s threats of more comprehensive import duties seriously.
Unlike the aluminum market, which sees most trade concerns expressed in the Midwest Premium futures contract, the copper market has no comparable mechanism.
Copper Demand Strong, Raw Materials Tight
The fact that demand appears strong continues to aid bullish expectations. Meanwhile, the rapid development of data centers has started to impact copper product markets. According to reports from one distributor, copper busbars, which distribute electrical power throughout those facilities, are currently under allocation.
The rapid growth of AI and the electricity needed to power it has added a significant demand driver for the coming years, even as countries increasingly scale back climate and renewable ambitions.

Current demand conditions aside, the raw material market offers little comfort. Treatment and refining charges (TCs/RCs), which miners pay to smelters, remain in search of a new bottom.
In trading circles, low TCs/RCs indicate tightness in the raw material supply. While this is partially the result of rising smelting capacity in China, that fact will do little to assuage markets concerned about deep supply deficit projections in the years ahead.
MetalMiner’s MMI report includes copper and 9 other monthly metal price reports and can be used as an economic indicator for copper contracting, copper price forecasting and predictive analytics. Sign up here.
Other Copper Market Signals Beg Caution
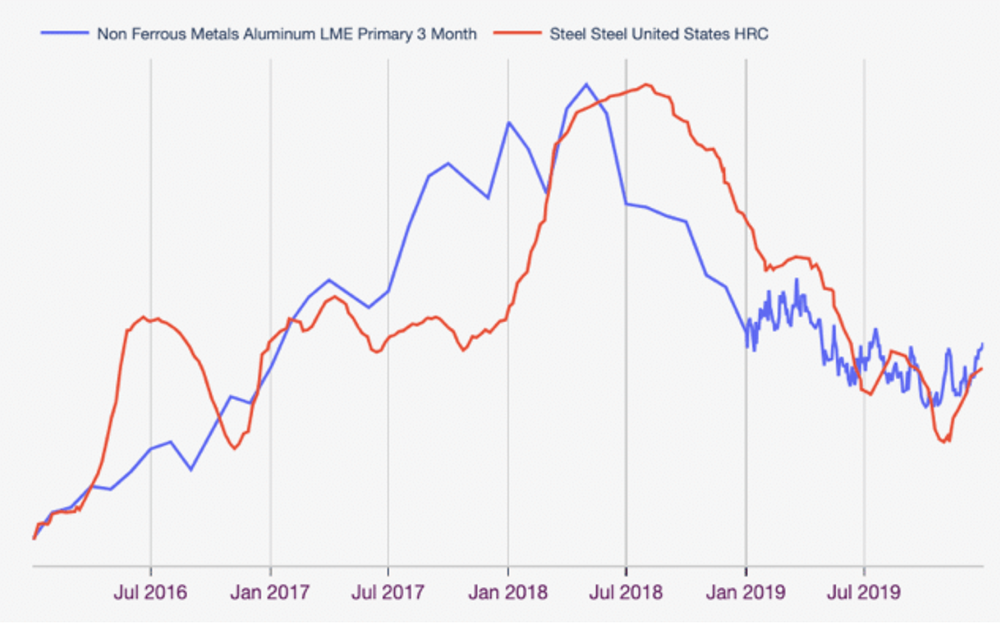
While copper prices may very well continue to trend up in the short term, the market signals are far from exclusively bullish. Historically, tariffs tend to have a short-lived impact on exchange pricing, a fact confirmed by both the U.S. steel and aluminum markets.
Trump’s original Section 232 tariffs, which applied respective 25% and 10% tariffs on steel and aluminum imports, were insufficient to carry the market indefinitely. Applied in March of 2018, the HRC price uptrend found a peak by the start of May before trending lower over the next two years. Meanwhile, aluminum prices continued to rise before their reversal at the close of July 2018.
China Pulls Away From Copper
As copper prices spiked, China seemingly started to pull away from the market. The Yangshan copper premium, a proxy for Chinese copper demand, has fallen over 14% since its peak in mid-January. While copper demand from China’s EV and solar sectors remains steady, the lack of demand from its moribund property sector offers a meaningful counterweight.
Additionally, the considerably lower energy requirements of China’s Deepseek AI relative to others has significantly disrupted the industry. This may once again force markets to reimagine copper demand forecasts as AI developers look to rival Deepseek’s efficiency.
Stop scrambling to react to rapid copper price fluctuations. MetalMiner Insights gives you the foresight to proactively plan your metal spend.
The Copper Market Remains Well-Supplied
Aside from certain product allocation and tightness within the raw material market, there is little evidence to suggest that the refined copper market has meaningfully tightened, at least enough to justify indefinitely higher prices. Although LME inventories have mostly trended lower since August, they remain considerably higher than in recent years and now sit near where they peaked in 2021.
Meanwhile, SHFE stocks are in the middle of a rebuild. The last rebuild during 2024 saw stocks jump to their highest level since 2020. Although it was not enough to prevent the copper price uptrend throughout Q2 2024, it was among several market conditions that served to tame bullish expectations and helped prices reverse after their late May peak.
As with the SHFE, Comex stocks are also on the rise. Likely aided by the widening premium over LME, copper continues to pour into the U.S. market. As of February 10, stocks stood at their highest level since January 2019, hardly a warning of an impending supply crunch.
Contango Could Upset Copper Bulls
It remains worth noting that inventory levels do not meaningfully correlate to prices. While they help add to the tapestry of signals that impact market sentiment, they alone do not determine price direction. They are also not the only indicator suggesting a still well-supplied market. Both the LME and Comex copper contracts remain in contango, which may warrant caution among copper bulls.
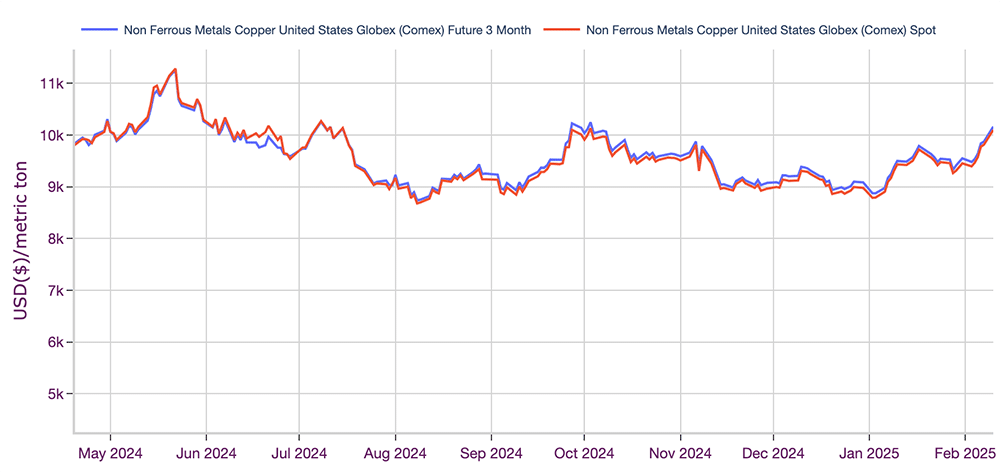
Contango, where a commodity’s future price holds a premium over its spot price, is not abnormal in markets. The cost-of-carry model suggests that futures prices should trend higher than spot due to storage, financing and opportunity costs. However, that premium can indicate that spot demand is not meeting future expectations, especially if it proves atypically wide.
Unlike the last copper price uptrend, which saw the Comex contract flip to backwardation, the current market shows contango. Futures regained their premium over spot prices in July and have managed to hold onto it ever since. While the spread does not appear historically high or show evidence of widening, it indicates relatively normal market conditions.
Stop wasting money on price data that doesn’t apply to your business. Learn how to only purchase the metal price points you need with MetalMiner Select.
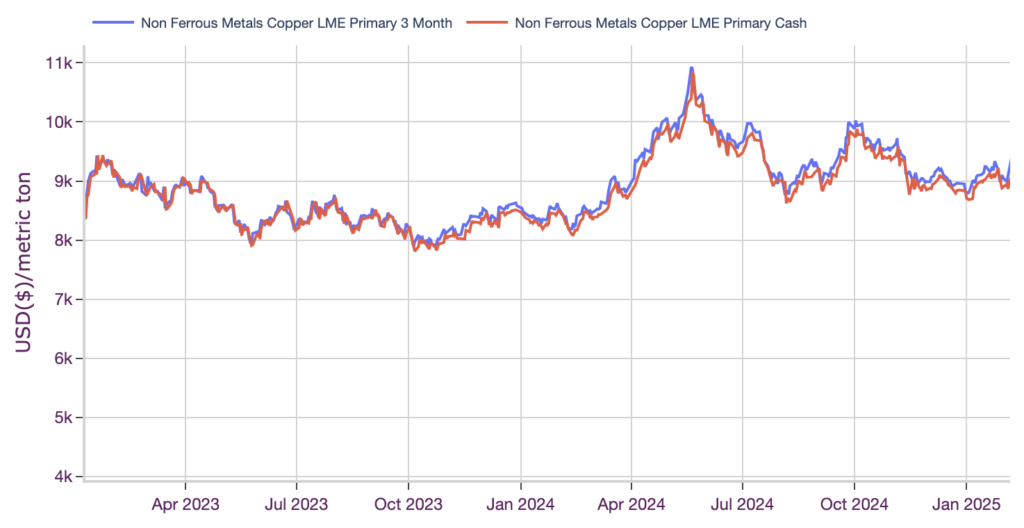
LME Copper Also in Contango
Meanwhile, the LME copper contract also stands in contango. But unlike Comex, futures remain at an atypically wide premium over their spot counterparts. Since 2012, futures have averaged a $26/mt markup over primary cash prices. Currently, that premium stands at $123/mt, enough to show an unmistakable gap between the two prices on a long-term chart.
In the short term, tariff concerns and the threat of their possible application remain an upside risk to copper prices. However, conditions do not yet appear to suggest the copper market fundamentals are enough to maintain a strong uptrend after investor reactions to those trade barriers begin to wear off.
Biggest Copper Price Moves
Read what’s next for copper prices in this month’s Monthly Metals Outlook. The report provides short- and long-term forecasts plus buying strategies, giving you the edge to navigate market volatility and maximize cost savings. See a free sample report and opt into a subscription.
- U.S. copper producer prices for copper grades 110 and 112 witnessed the largest increase of the overall index, with a 5.91% rise to $5.38 per pound as of February 1.
- U.S. copper producer prices for copper grade 102 rose 5.63% to $5.63 per pound.
- Indian primary cash copper prices increased by 2.9% to $9.58 per kilogram.
- Chinese copper wire prices saw a modest 2.71% increase to $10,383 metric ton.
- Meanwhile, Korean copper strip prices saw the only decline of the index, falling by a modest 0.67% to $10.82 per kilogram.


