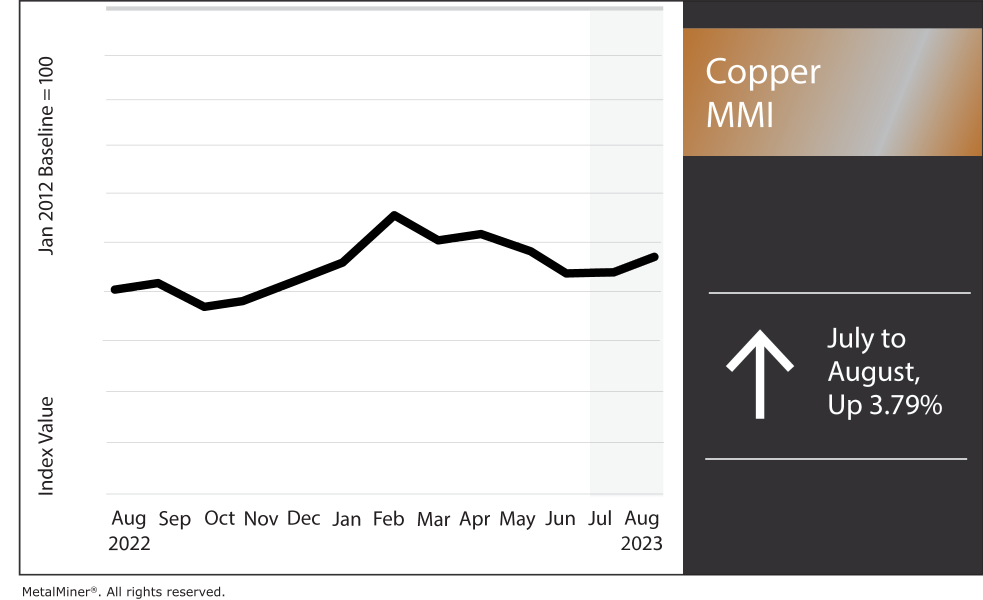
The Copper Monthly Metals Index (MMI) rose 3.79% from July to August. Copper prices started to show uncertainty last month amid an absence of directional strength. A lack of bullish or bearish patterns that would otherwise drive prices translated into minimal momentum to the upside or downside. Copper prices today continue to move in a sideways range.
Subscribe to MetalMiner’s free weekly newsletter now and get the most ROI with in both copper and falling demand markets.
MetalMiner’s free weekly newsletter covers copper developments and the macroeconomic factors that impact industrial metal prices.
Weak Chinese Trade Data Weighs on Copper Prices
Despite a long-term bull narrative and the prospect of a soft landing in the U.S., copper prices remain somewhat hesitant. While prices rose almost 7% since finding a bottom in late May, they lacked enough momentum to break out of monthly ranges that would suggest the beginning of a new bull trend. As it has been for months, Chinese demand continues to disappoint, leading to a limited upside over the last two months.
While China emerged from years of lockdowns with a great deal of market optimism, the Chinese economy has not delivered a robust return. Instead, some have dubbed its current plight “economic long COVID.” July trade data comes as the latest blow to China’s outlook. Both imports and exports fell short of market expectations last month. Imports fell 12.4% year over year, while exports dropped 14.5%. The data appears especially bleak considering 2022 was still riddled with constant pandemic-related disruptions.
July also saw China’s copper imports slide, as customs data indicated a 2.7% decline from 2022. Unfortunately for China, July is hardly a one-off. During the first seven months of the year, copper imports fell 20.7%. The uneven performance of China’s manufacturing sector, which returned to contraction in July, alongside weakness in a property sector plagued by plunging home sales and ongoing defaults among developers continued to limit copper demand.
See why technical analysis is a superior forecasting methodology compares to fundamental analysis (and why it matters for your copper buy).
Chile Cuts Copper Output Forecast
While China’s latest data may weigh on bullish sentiment, mine supply continues to face constraints. Codelco, Chile’s state-owned mining company, recently lowered it’s 2023 copper output forecast. The company now expects annual production to fall from 1.35-1.45 million metric tons to 1.31-1.35 million metric tons. Codelco faced a number of challenges throughout the year, from inclement weather and lower ore grades to a fatal rock explosion at El Teniente, its largest mine. The company expects production will continue to face constraints during the remainder of the year.
Despite Codelco’s challenges, the International Copper Study Group (ICSG) reports that global mine output still increased by roughly 2% during the first five months of the year. Meanwhile, an 8% increase to refined copper production amid a more modest 4% increase in usage led to an apparent surplus during that period.
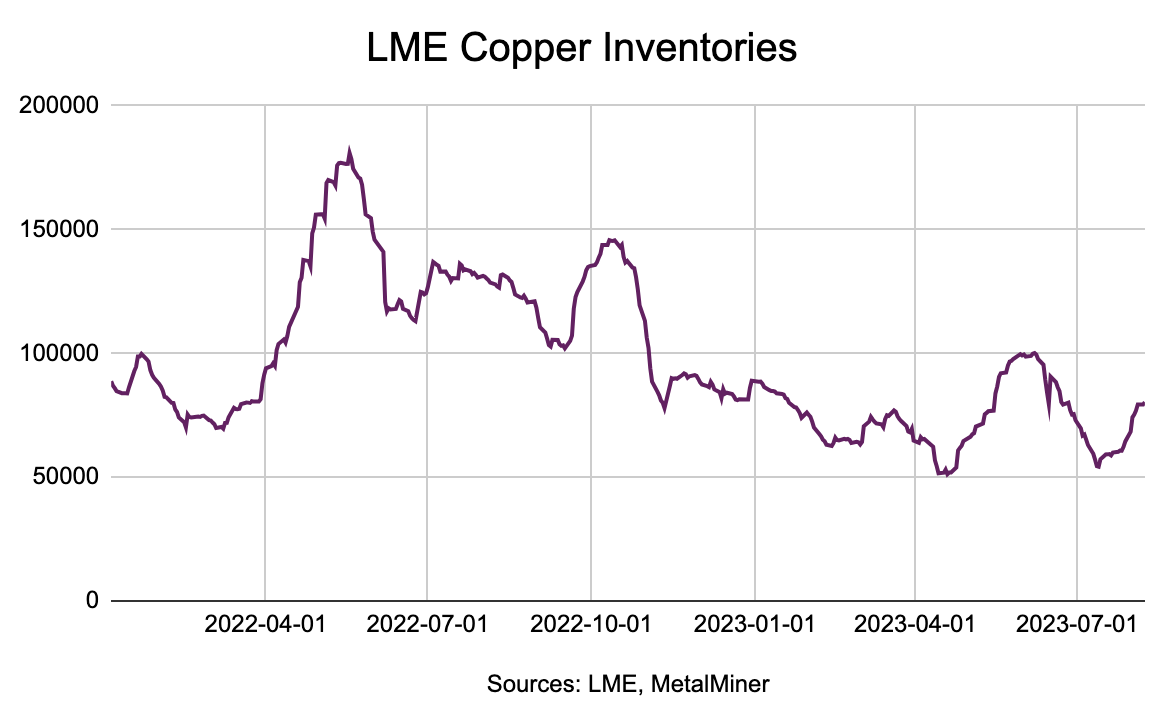
Weakness in global manufacturing continues to limit overall demand for copper, which has continued to weigh on prices throughout the year. While inventories remain historically low, stocks began to rise in July, hitting their highest level since June. This, in addition to China’s economic woes, could limit bullish sentiment.
MetalMiner Insights provides in-depth price forecasts for copper, as well as expert sourcing strategies. Schedule a demo.
Investment Funds Remain Bullish as Participation Picks Up

Nonetheless, China’s weakness has yet to dull sentiment among investment funds, which appear more swayed by projected long-term supply shortages. According to the LME’s most recent Commitment of Traders Report (COTR), funds remained overwhelmingly net long by the end of July. A long position anticipates rising prices, while short positions expect prices to decline. That said, investment funds have rarely fallen net short over the last three years. However, the delta between total short and long positions widened considerably since they shifted briefly net short at the end of May.

Almost more interesting than what appears to be bullish market bias is the recent rise in open positions among funds. By the end of July, total open positions among investment funds hit its highest level since the LME began publishing COTR data. Individually, the number of both long positions also hit their highest level during that period. Funds notably stepped away from the market after copper prices turned bearish in January. Rising participation among investment funds, should it hold and maintain a strong bias, could add the momentum copper prices need to establish a meaningful trend.
Don’t miss out. Join the MetalMiner LinkedIn group today for news on aluminum, steel and copper (oh my!).
Biggest Movements in Copper Prices Today
- Chinese primary cash copper prices rose 6.45% to $9,955 per metric ton as of August 1.
- Chinese copper bar prices rose 6.08% to $9,920 per metric ton.
- LME primary 3 month copper prices rose 6.06% to $8,671 per metric ton.
- Indian primary cash prices rose 5.95% to $9.17 per kilogram.
- Korean copper strip prices saw the only decline of the index, with a modest 2.79% fall to $10.68 per kilogram.


