Overall, the Copper Monthly Metals Index (MMI) retraced to the downside, with a 3.56% decline from October to November.
After outperforming the base metal category last month, Comex (CME) copper prices found a peak on October 3. This was followed by a modest retracement that saw copper prices fall 5.21% from the close of September. Despite copper experiencing significant volatility after the election, does this mean that more market volatility on the way? Get all of the latest copper market updates with MetalMiner’s weekly newsletter.
Copper Prices Show Short-Lived Response To Election
The price of copper’s reaction to the U.S. election proved bumpy but sideways. Prices showed outsized swings following the results, but still failed to break out of their short-term range. While sideways, the bias appeared increasingly to the downside, with prices closing November 12 at $XXX/mt.
Overall, 2024 has proven to be a volatile year for copper prices. Following a largely tame 2023, copper prices quickly embarked upon a frenzied uptrend by the end of Q1. By May 22, prices peaked at a new all-time high. This movement was followed by an equally sharp retracement as the reality of a well-supplied market caught up to speculators.
Midway through Q4, prices appear to have stabilized as the market prices in a new U.S. president. A Trump presidency and likely Republican-controlled legislature will offer a few bullish headwinds for the copper market. While already-funded infrastructure plans from the IRA and Bipartisan Infrastructure Law will remain intact, Trump pledged to rescind other funding, which could impact certain subsidies.
Most prominently, this could include subsidies for copper-hungry EVs, electric appliances, wind towers and solar. While things like the electrification needs of data centers will continue to drive copper demand, investors will need to price in less-than-expected demand from renewables.
China Disappoints Copper Bulls…Again
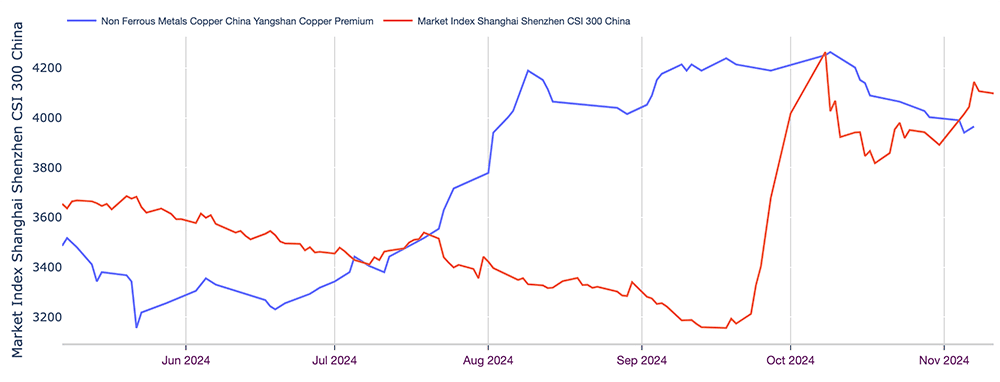
Meanwhile, China disappointed markets with its latest stimulus package, offering no relief to bulls. Ahead of the announcement, markets remained hopeful that China would compensate for the underwhelming size of its last major package in September. That effort directly followed the meeting of China’s top legislative body, the Standing Committee of the National People’s Congress, held from November 4 to 8.
Instead, China unveiled a $1.4 trillion plan that offered no direct stimulus and instead pledged to relieve debt burdens on local governments. Despite the size, the new plans saw the CSI 300 retreat in the days following the announcement, finding a peak short of the one created following September’s stimulus package. Meanwhile, the Yangshan copper premium showed no rebound as it continued to decline from its early October high.
Rate Cuts in China Remain Ineffective
The cadence of China’s recent announcements has echoed the U.S. rate cut cycle, which saw the Federal Reserve issue respective 50 bps and 25 bps cuts in September and November. This strategy aims to reduce the deflationary impact of stimulus measures, as cuts offer a depreciative effect on the dollar, which would expectedly have an appreciative effect on other currencies.

The further unwinding of U.S. interest rates could see China offer more stimulus in the coming months. However, markets would likely interpret China’s inability to put forward a more comprehensive package as a worrying signal to markets. Even with more stimulus, there is little need to build in a country with a declining population, and considering the nation’s weak consumer spending, the copper demand outlook remains in question.
MetalMiner Insights covers price points, price forecasting and sourcing strategies for a full suite of copper forms and semi-finished products. See our full metals catalog.
Investment Funds Pull Back Long Bets
Between the U.S. election and Chinese stimulus, investment funds showed little evidence of bullish conviction during the month. While they remain net long, data from the LME showed funds started to sell off long bets and pick up short bets beginning in early October.
Whether funds will sustain this trend remains to be seen. However, the effect has given copper prices a slight downside bias in the short term. There are still a number of supportive drivers on the horizon for the copper market, which could see funds approach the market cautiously. That said, the takeaway seems to be that investment funds are less bullish than they were at the start of Q4.
Biggest Moves for Copper Prices
Read what’s next for copper prices in this month’s Monthly Metals Outlook. The report provides both short-term and long-term forecasts plus buying strategies, giving you the edge to navigate market volatility. View a free sample report and then opt into a subscription.
- Chinese copper wire prices jumped 10.03% to $11,232 per metric ton as of October 1.
- Chinese copper scrap prices rose 7.94% to $11,219 per metric ton.
- Chinese copper wire scrap prices saw a 7.27% increase to $10,396 per metric ton.
- LME primary three month copper prices rose 6.87% to $9,907 per metric ton.
- Korean copper strip prices witnessed the only decline of the overall index, with a modest 2.53% decrease to $11.32 per kilogram.


