Although some moved sideways with more modest declines, all components within the overall index saw copper prices trade lower during the month. As a result, the Copper Monthly Metals Index (MMI) declined 2.34% from September to October.
Subscribe to MetalMiner’s free weekly newsletter now and generate the most ROI possible within falling copper markets.

Copper Prices Break Below Sideways Range, Create Lower Low

After edging lower throughout September, copper prices appeared increasingly bearish by early October. Indeed, prices fell below the $8,000/mt mark by Oct. 4 for the first time since May. A new lower low followed shortly after on Oct. 5. This saw prices break below their long-term sideways range to their lowest level since November 2022. Although prices saw a modest rebound in the following days, the recent low could suggest the nascent signs of a new downtrend should prices continue to decline.
Copper prices largely held within a sideways trend since May, which makes the recent breakdown in copper prices significant. Many expected the period of consolidation would soon turn into a new bull trend, assuming that global renewable efforts would fuel a “supercycle.” Instead, global economic challenges, lackluster demand from China, and numerous delays within U.S. renewable initiatives have begun to drag on prices.
Tired of copper market uncertainty resulting in loss of revenue? The Monthly Metals Outlook report provides both short-term and long-term forecasts, giving you the edge to navigate market volatility. Secure a free sample report and opt into a subscription.
Copper Surplus Set to Reign Until 2027

Meanwhile, recent market forecasts will offer no support to the currently bearish market. According to the International Copper Study Group (ICSG), supply and demand struck a near balance in 2023. However, by 2024, the market will shift into a considerable surplus.
The October press release by the ICSG comes on the heels of rising LME inventories. Although it comes off of a historically low base number, by Sep. 21, stocks more than tripled after finding a bottom in mid-June. By the end of the first week of October, inventories sat at their highest level since October 2021.
Additionally, the surplus will likely continue for the next few years. According to data from Bernstein Research, the market will remain in surplus until it shifts into an increasingly widening deficit beginning in 2027. By that year, growing demand will encounter underinvestment in the mining sector, which already faces lower ore grades. This will likely delay the global energy transition.
Considering near-shoring as a sourcing alternative, but don’t know where to start? Join MetalMiner’s free October fireside chat: “Don’t Ship Your Pants: Options for Near-shoring” where near-shoring expert, German Dominguez, will discuss all of the key point, pros and cons of near-shoring.
Investment Funds Shift Net Short at the End of September
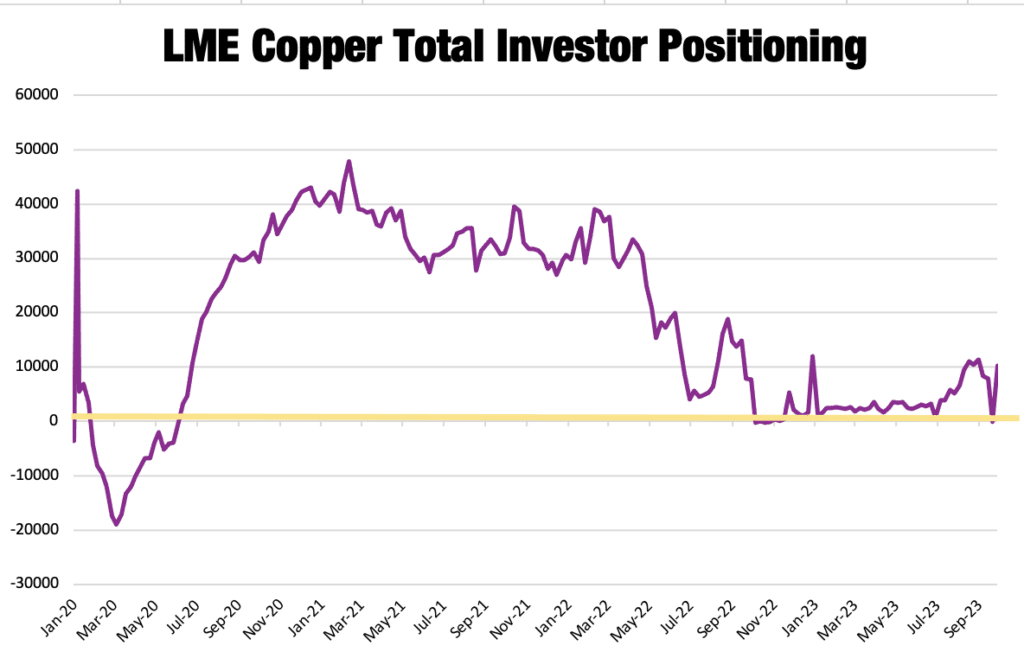
Investors have taken note of the seemingly well-supplied market. According to data from the LME, investment fund positioning shifted narrowly net short for the first time since June at the end of September. Indeed, investment funds boast a considerable share of the overall market, which means their positioning strongly influences price direction.
That said, funds weren’t alone in their bearish market bias, as total investor positioning briefly dipped net short during the third week of September. However, a jump in long positions from other firms and credit institutions pulled total positioning back to net long by the end of the month. While short-lived, the total positions have rarely fallen net short since 2020. This suggests a considerably softer market outlook compared to years past.
At the very least, the lack of a strong bullish market bias seems to indicate that risk remains to the downside for copper prices.
The 5 Golden Rules for Sourcing Copper.
Biggest Copper Price Moves
- Japanese primary cash copper prices saw the largest decline of the index, dropping 4.19% to $8,289 per metric ton as of October 1.
- Chinese copper wire prices fell 4.0% to $9,262 per metric ton.
- Chinese copper bar prices saw a 3.93% drop to $9,277 per metric ton.
- Chinese primary cash copper prices fell 3.75% to $9,277 per metric ton.
- LME primary three month copper prices fell 3.16% to $8,169 per metric ton.


