Sign up for daily news updates from CleanTechnica on email. Or follow us on Google News!
The Northern Hemisphere is slowly approaching the end of the wildfire season for 2023, which normally starts in May and extends into October. In this context, the Copernicus Atmosphere Monitoring Service (CAMS)* data on fire emissions and smoke transport associated with wildfires provides valuable insights to evaluate the most relevant wildfire episodes of the last few months in a comprehensive manner.

CAMS daily mean organic matter aerosol optical depth analyses at 550nm from 1 May – 10 September 2023
During the late spring and summer of 2023, several devastating wildfires have been affecting most of the provinces and territories of Canada. First detected in May, these wildfires have been ongoing in several locations, causing great human and material loss, in addition to severely affecting air quality not only in Canada but across other regions of North America. According to the CAMS global forecasts and analyses, which assimilate satellite observations of atmospheric composition, some of the plumes of smoke produced by these wildfires also reached Europe.
The extent, persistence, and intensity of these wildfires have led to the total estimated emissions of carbon emissions for 2023 to be almost 410 megatonnes, the highest for Canada by a wide margin in the CAMS dataset. The previous record for annual carbon emissions was 2014, with 138 megatonnes of carbon. At the time of this newsflash there are still active wildfires in a number of regions in Canada, and the 2023 annual emissions may keep increasing although the rate of increase seems to be levelling off. At this point Canada wildfire emissions represent 27% of the total global wildfire carbon emissions for 2023.
CAMS Senior Scientist, Mark Parrington, comments: “Wildfires occur in boreal regions every summer with varying locations, intensity, and duration depending on the hydrological, meteorological and climate conditions. As temperatures keep increasing and dry conditions become more long-term, the chances of experiencing devastating wildfires like those in Canada are increasing. The ability we have to monitor wildfire emissions and the smoke transport in CAMS is essential to understanding the scale and potential impacts on air quality.”
Other significant wildfire episodes during this last season include those that took place in Russia, more particularly in Omsk oblast, Novosibirsk oblast, and the Far Eastern Federal District. It is important to highlight that despite Russia experiencing wildfire emissions this year below the 20-year average, the June-August wildfire carbon emissions for the Arctic were the third-highest on record, second only to 2019 and 2020, mainly due to high latitude fires in Canada’s North Western Territories.
Several regions around the Mediterranean also experienced significant wildfire activity as the season progressed. Between July and August, wildfires affected northern and central Greece, with the emissions for this time of the year being the third-highest on record, after 2007 and 2021. The Iberian Peninsula also experienced significant wildfire activity, affecting both Portugal and Spain, including one of the largest fires experienced on Tenerife. The island of Maui in Hawaii also experienced some significant intense wildfires.
CAMS provides up-to-date information on the location, intensity, and estimated emissions of wildfires around the world, including the tracking of their smoke transport and impacts on atmospheric composition. CAMS data is freely available to use and can serve as a vital aid in decision-making processes for citizens, businesses, and stakeholders in related sectors alike.
More information on the general overview of this wildfire season can be found in this article. (Graphs below)
The CAMS Global Fire Monitoring Page can be accessed here.
Find out more about fire monitoring in the CAMS Wildfire Q&As.
Courtesy of the Copernicus Atmosphere Monitoring Service (CAMS).
More here:
Wildfire activity that began in the Northern Hemisphere in May increased in severity over the summer months. Wildfires in Canada have been burning for over four months, in places generating some of the highest wildfire emissions on record for the country. Meanwhile in Europe, the largest wildfire ever recorded in the European Union (EU) impacted northern Greece. Throughout the summer months, the Copernicus Atmosphere Monitoring Service (CAMS*) has been monitoring the locations and intensity of these fires and forecasting the impacts of the resulting smoke on the atmosphere.
Wildfire activity is seasonal, with the Northern Hemisphere typically seeing fires from May to October, peaking in July and August – the hottest and driest months of the year. This year was typical in this regard, with extreme wildfire activity experienced at various locations across the Northern Hemisphere in the summer months.
Canada’s highest emissions on record
After three months of extreme wildfire activity in May-July, Canada saw no respite in August, with wildfires continuing to burn across the country, particularly in the west and northwest, with the Northwest Territories, British Columbia and Alberta experiencing increased wildfire activity last month.
On 12 September, there were 145 active wildfires in Yukon, which has seen almost 224,000 hectares of its territory ravaged by wildfire this year, while on 13 September, there were 118 active wildfires in the Northwest Territories, contributing to a total burned area in the territories this year of over 4 million hectares.

CAMS daily mean organic matter aerosol optical depth (AOD) analysis from 1 May to 10 September. Source: CAMS
CAMS Global Fire Assimilation System (GFAS), which utilises near-real-time satellite observations of fire radiative power (FRP) to estimate pollutant emissions related to burning vegetation, shows wildfire activity in the Northwest Territories in August to be significantly higher than the 20-year average. Estimated wildfire emissions in the Northwest Territories so far this year are already the highest in the past two decades, at over 105 megatonnes. Estimated carbon emissions in British Columbia, Alberta and Quebec are likewise the highest on record, with emissions in Quebec almost four times the previous record, set in 2013.
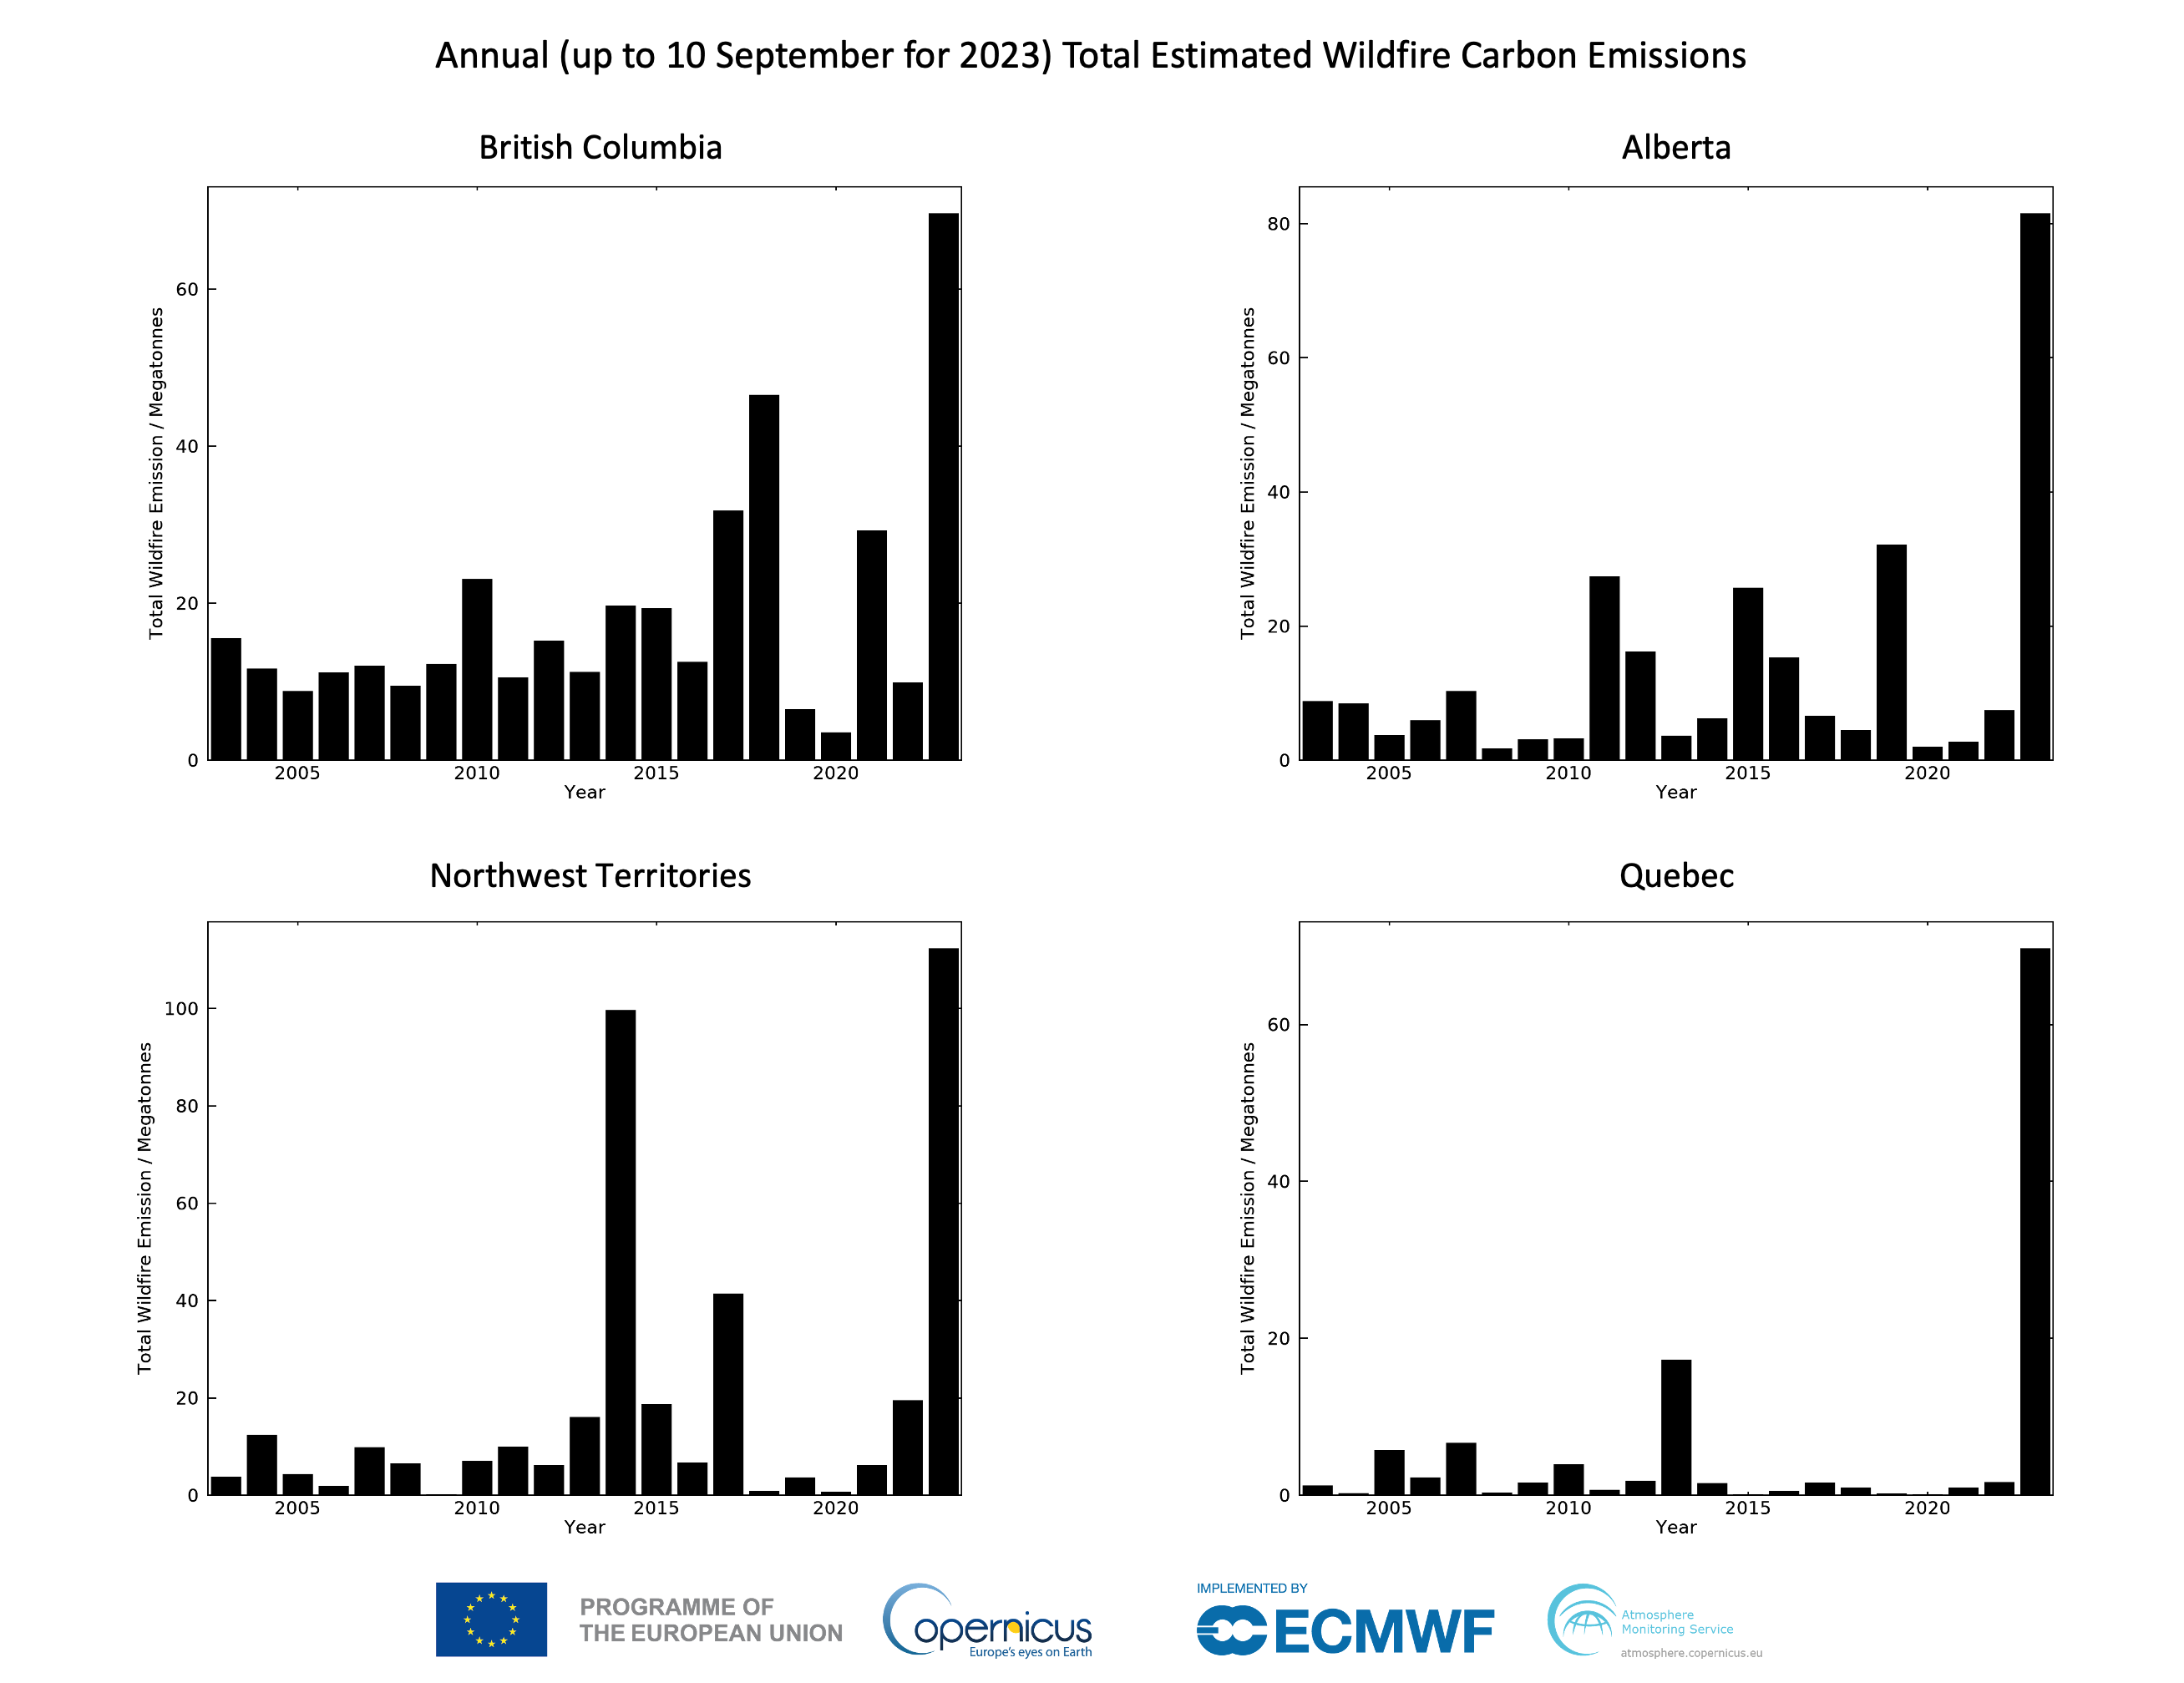
CAMS GFASv1.2 annual (up to 10 September for 2023) total estimated wildfire carbon emissions for British Columbia, Alberta, Northwest Territories and Quebec. Source: CAMS
August’s wildfire activity follows a summer of intense wildfires across Canada. CAMS started to track Canada’s wildfires back in May, when significant activity was noted in the province of Alberta. CAMS daily total FRP and emissions data for May were well above average in the western provinces of Alberta, British Columbia and Saskatchewan, with high daily total values also observed in the Northwest Territories, and further east in Ontario, Quebec and Nova Scotia, particularly at the end of the month.

CAMS GFASv1.2 cumulative daily total fire carbon emissions for Canada in 2023 (left) and annual total wildfire carbon emissions (right). Source: CAMS
The situation intensified over the summer months, with significant long-range smoke transports from the Canadian wildfires reaching Europe in June. In July, large-scale wildfires continued across both western and eastern provinces, with the national total estimated emissions of carbon well above any previous annual total in the GFASv1.2 dataset. This dynamic continued into August and September, when carbon emissions from Canada’s wildfires continued to soar, to reach over 405 megatonnes by 10 September.
In the final days of August and the start of September, there was another long-range transport of smoke from the Canadian wildfires across the Atlantic, with smoke resulting in hazy skies across the British Isles, and northwestern, central and southern Europe.

CAMS forecast carbon monoxide mixing ratio at 500 hPa (~5km) from 30 August 00 UTC valid until 3 September. Source: CAMS
High-latitude fires were also detected within the Arctic Circle in Canada and Russia in July and August, with FRP values in the middle of July and throughout most of August significantly higher than the 20-year average. June-August wildfire carbon emissions for the Arctic were the fifth highest in the CAMS record, which goes back to 2003.

CAMS GFASv1.2 daily total fire radiative power (FRP) for the Arctic in June-August (left) and total estimated wildfire carbon emissions for the same period (right). Source: CAMS
Europe’s summer wildfire season
In the third week of August, we reported on the wildfires that ravaged northern and central Greece. The August wildfires followed a July in which Greece experienced its worst wildfire activity in 20 years. As a result, July’s wildfire carbon emissions in Greece were the highest in the CAMS record and the combined wildfire carbon emissions for July and August were the third highest on record, after 2007 and 2021.

CAMS GFASv1.2 wildfire carbon emissions for Greece in July and August (left) and cumulative total wildfire carbon emissions for Greece (right). Source: CAMS
The wildfires in northern Greece this summer were the largest wildfires ever recorded in the EU. According to data from the European Forest Fire Information Service (EFFIS), Greece’s wildfires have resulted in a cumulative burned area since the start of the year of over 173,000 hectares.
Following a heatwave on the Iberian Peninsula, southwestern Portugal experienced some large wildfires in the first half of August. Reflecting the extreme wildfire activity, CAMS FRP data for 4-9 August show values that are significantly higher than the 20-year average. The wildfires generated thick smoke plumes, which were mostly transported out to the Atlantic on 6-7 August.
Elsewhere, a large wildfire developed on the Spanish island of Tenerife on 16 August and spread quickly. Data from CAMS GFAS show high daily total FRP for the Canary Islands for 16-22 August and wildfire carbon emissions for the Canary Islands in August were the highest since 2003. The wildfire, which destroyed 15,000 hectares of woodland in the national park surrounding the Mount Teide volcano, Spain’s highest peak, has since been brought under control by firefighters.
Hurricane Dora fans flames in Hawai’i
The Hawai’ian island of Maui experienced some extreme wildfires in August, resulting in the deaths of at least 115 people. The scale and intensity of the Hawai’ian wildfires increased due to Hurricane Dora, with high winds whipping up the flames and causing the wildfire to spread more rapidly. Hurricane Dora may also have contributed to igniting the wildfire, with power cables downed by high winds believed to have sparked some of the fires. However, CAMS FRP data from the Hawai’ian wildfires are limited by the masking of fire emissions in GFAS due to interference from volcanoes. Updated spurious signal masks and land cover may help to improve this in future.
Wildfire activity in Russia
CAMS FRP data for May-August show that wildfire intensity for Russia as a whole fluctuated compared with the 20-year average. In May, Russia’s main wildfire activity was noted in Omsk and Novosibirsk oblasts, while in July the most intense wildfire activity was in the Far Eastern Federal District. Total wildfire carbon emissions from wildfires in Russia since the start of the year were below the 20-year average (see below).

CAMS GFASv1.2 cumulative daily total wildfire carbon emissions for Russia (left), and annual total wildfire carbon emissions (right). Source: CAMS
As of 13 September, there were eight forest fires burning over an area of 105 hectares in five Russian regions, with three of these wildfires located in Khabarovsk Krai, where wildfires are currently active in 31 hectares, according to Russia’s Aerial Forest Protection Service.
Quality-assured wildfire emissions data
CAMS provides regular up-to-date information on the location, intensity and estimated emissions of wildfires around the world, as well as tracking smoke transport and composition. To learn more about CAMS monitoring of wildfires and smoke, visit our page on Global fire monitoring.
*CAMS is implemented by the European Centre for Medium-Range Weather Forecasts (ECMWF) on behalf of the European Commission
Have a tip for CleanTechnica? Want to advertise? Want to suggest a guest for our CleanTech Talk podcast? Contact us here.
EV Obsession Daily!
I don’t like paywalls. You don’t like paywalls. Who likes paywalls? Here at CleanTechnica, we implemented a limited paywall for a while, but it always felt wrong — and it was always tough to decide what we should put behind there. In theory, your most exclusive and best content goes behind a paywall. But then fewer people read it!! So, we’ve decided to completely nix paywalls here at CleanTechnica. But…
Thank you!
Tesla Sales in 2023, 2024, and 2030
CleanTechnica uses affiliate links. See our policy here.

