Sign up for daily news updates from CleanTechnica on email. Or follow us on Google News!
The updated Energy Policy Simulators are already helping states access federal funding from the Climate Pollution Reduction Grants program
For tutorial videos on how to use the EPS, scroll to the end of the article.
RMI and Energy Innovation’s free Energy Policy Simulator (EPS) can help states craft the most effective energy and climate plans. We developed EPS models for the 48 states in the continental US that estimate the environmental, economic, and human health impacts of different policies. The EPS is open-access and open-source, which allows for transparent planning and stakeholder engagement.
In the next year, decision makers in nearly every state will lay out their plan for reducing pollution by writing Comprehensive Climate Action Plans (CCAPs) as part of the Climate Pollution Reduction Grants (CPRG) program. The CPRG program, authorized by the Inflation Reduction Act (IRA), supports states, municipalities, and Tribal entities with $5 billion in federal funding for curbing climate pollution. All applicants for CPRG funding must submit CCAPs to the EPA by mid-2025 that identify and quantify proposed measures to reduce climate pollution.
And now, with the launch of the updated EPS, it is easier than ever for states to scope the emissions reduction and co-benefits of energy policies. The refreshed state models, which were made possible with generous support from Bloomberg Philanthropies, include the latest emissions and energy consumption data. They incorporate major programs and incentives from the IRA and Infrastructure Investment and Jobs Act. Other changes include the ability to evaluate hourly dispatch during peak periods and forecast load growth related to the clean energy transition.

What the CCAPs must include and what EPS offers
As part of the first phase of the CPRG program, states have been awarded planning grants to produce and submit key deliverables to the EPA, including CCAPs. The CCAP is an opportunity for governments to build on their Priority Climate Action Plans (PCAPs), which, submitted in March 2024, defined each state’s priority measures for reducing climate pollution across the economy. RMI reviewed the PCAPs and found that, if fully implemented, the plans could result in 7 percent less climate pollution from the United States by 2030.
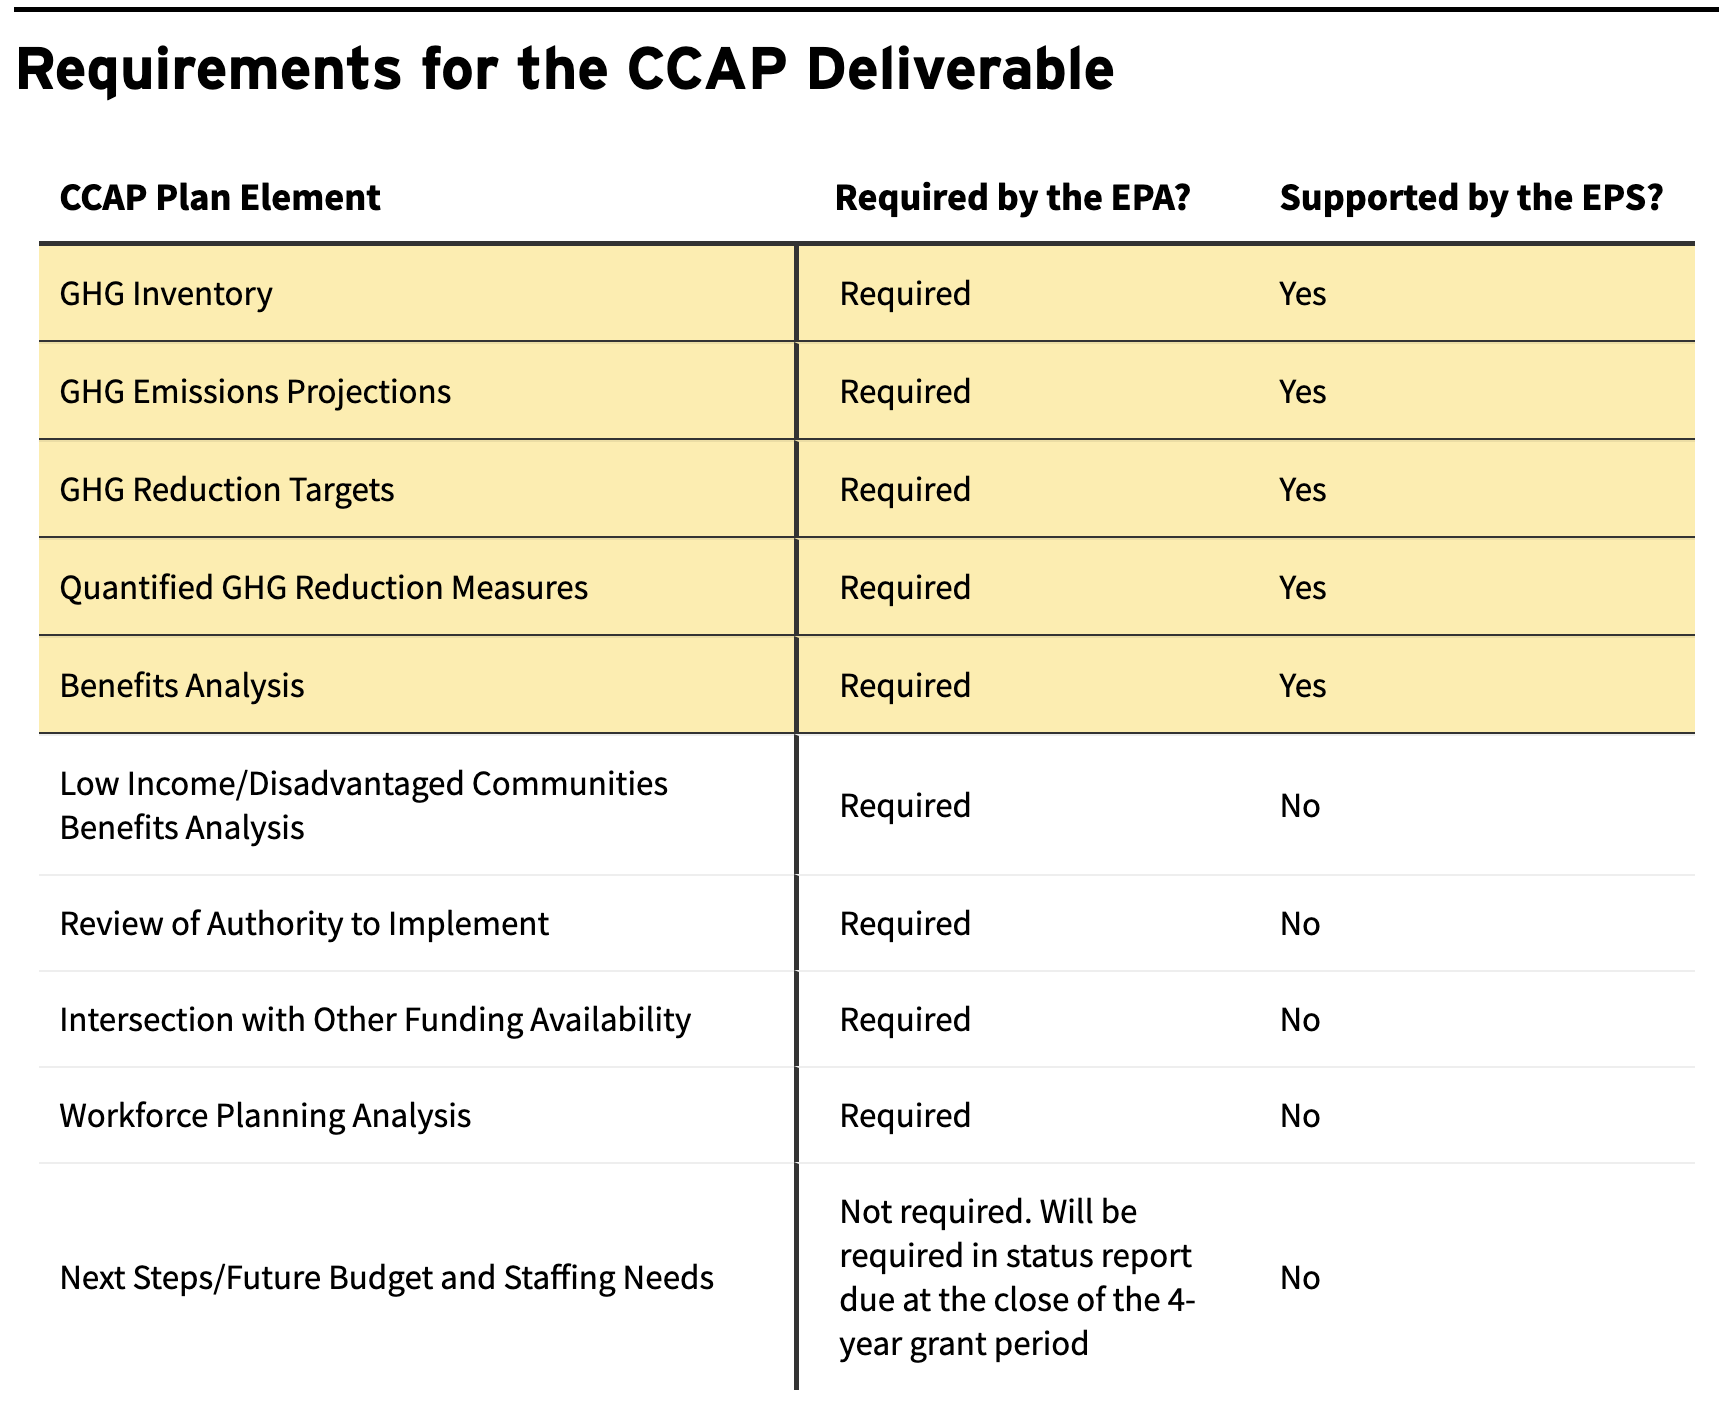
In addition to adding details and addressing gaps in the PCAPs, each CCAP must include specific elements, and that’s where the newly upgraded EPS can help.
The EPS can support 5 of the 9 required CCAP components. Here’s how:
- GHG Inventory: The updated EPS uses the latest data from the EPA, Energy Information Administration, and National Renewable Energy Laboratory to construct the GHG inventory through 2021 for each state and provide sectoral breakdowns. Those numbers can be viewed through EPS-generated graphics and downloaded from the website.
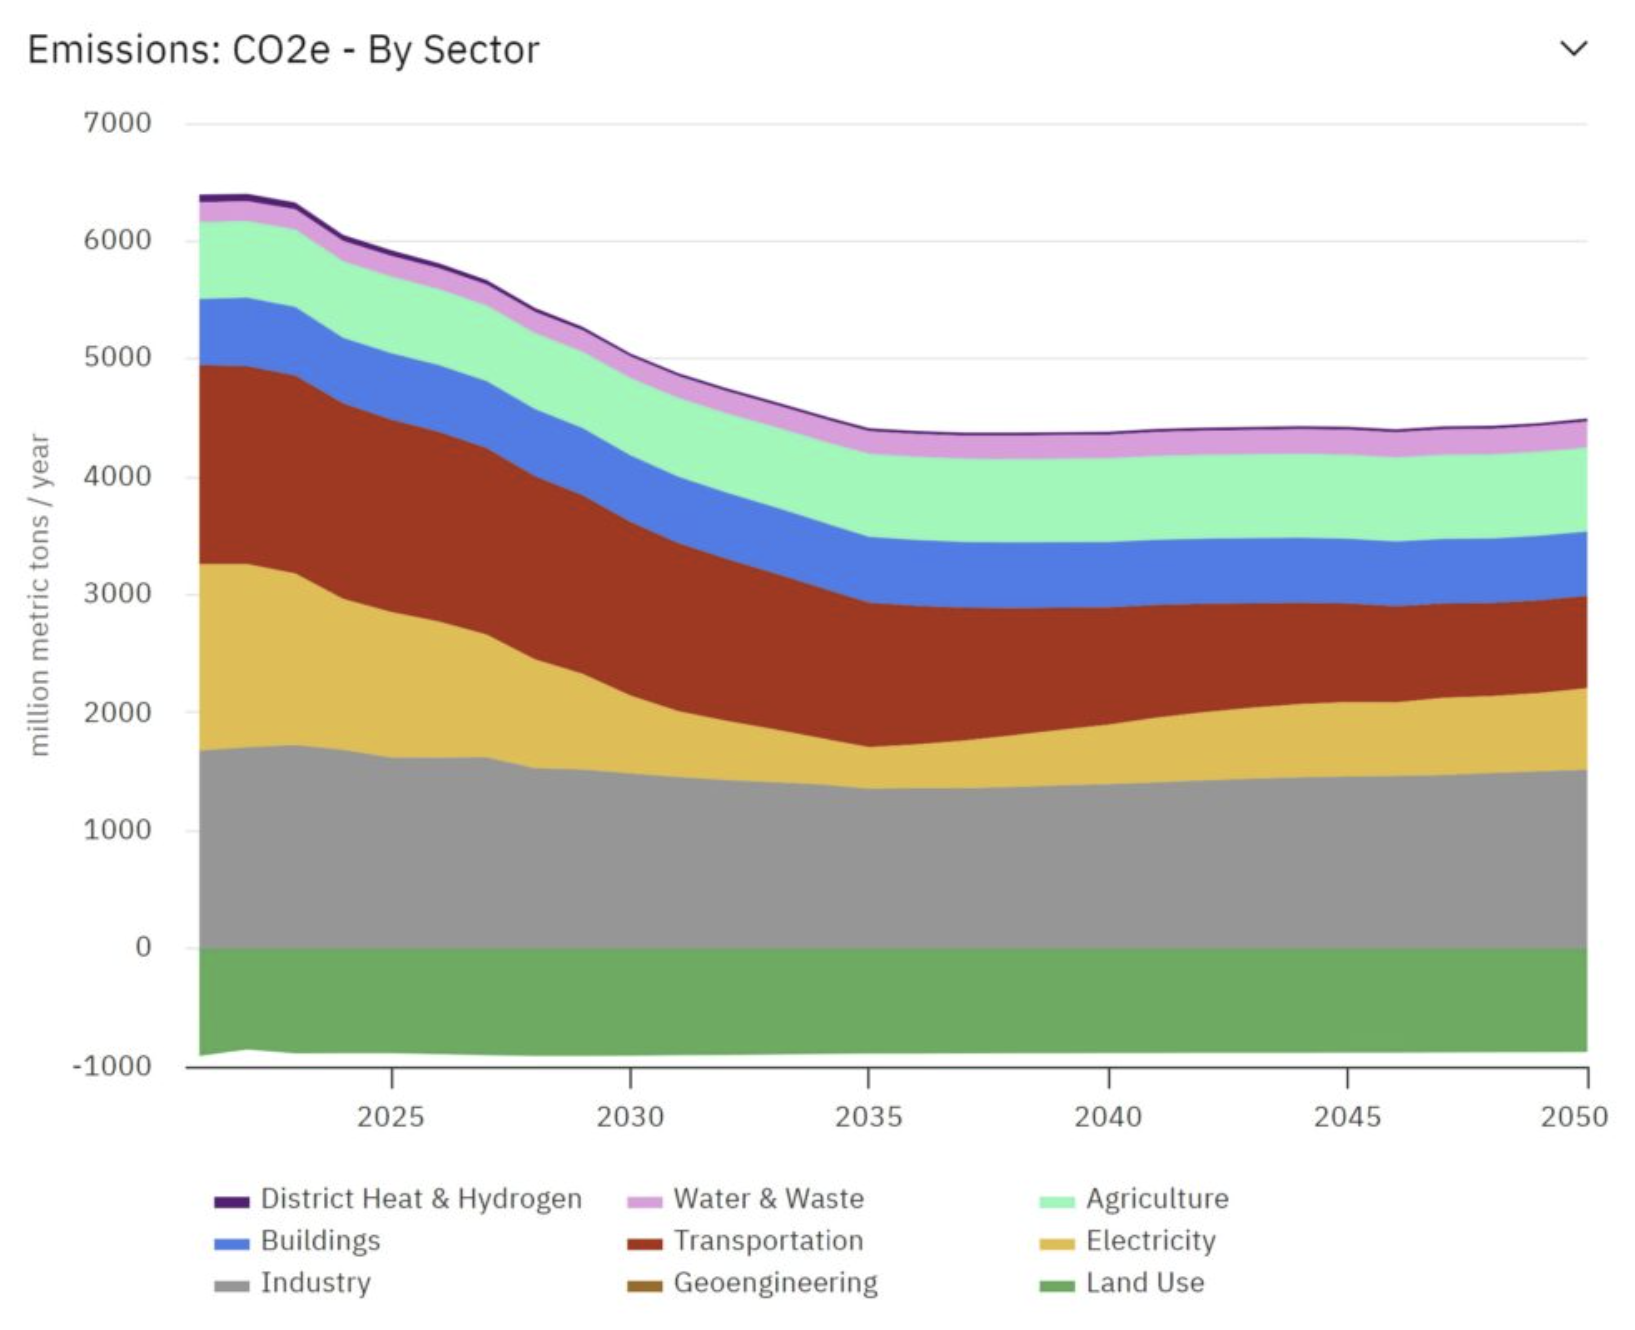
- GHG Emissions Projections: The EPS provides annual and sectoral projections through 2050 based on a business-as-usual scenario. The business-as-usual scenario reflects the latest EPA rules, components of the Inflation Reduction Act, and key state policies, all of which are identified in the Energy Policy Scenario Documentation. Ultimately, the business-as-usual scenario provides a strong baseline against which proposed measures can be compared.
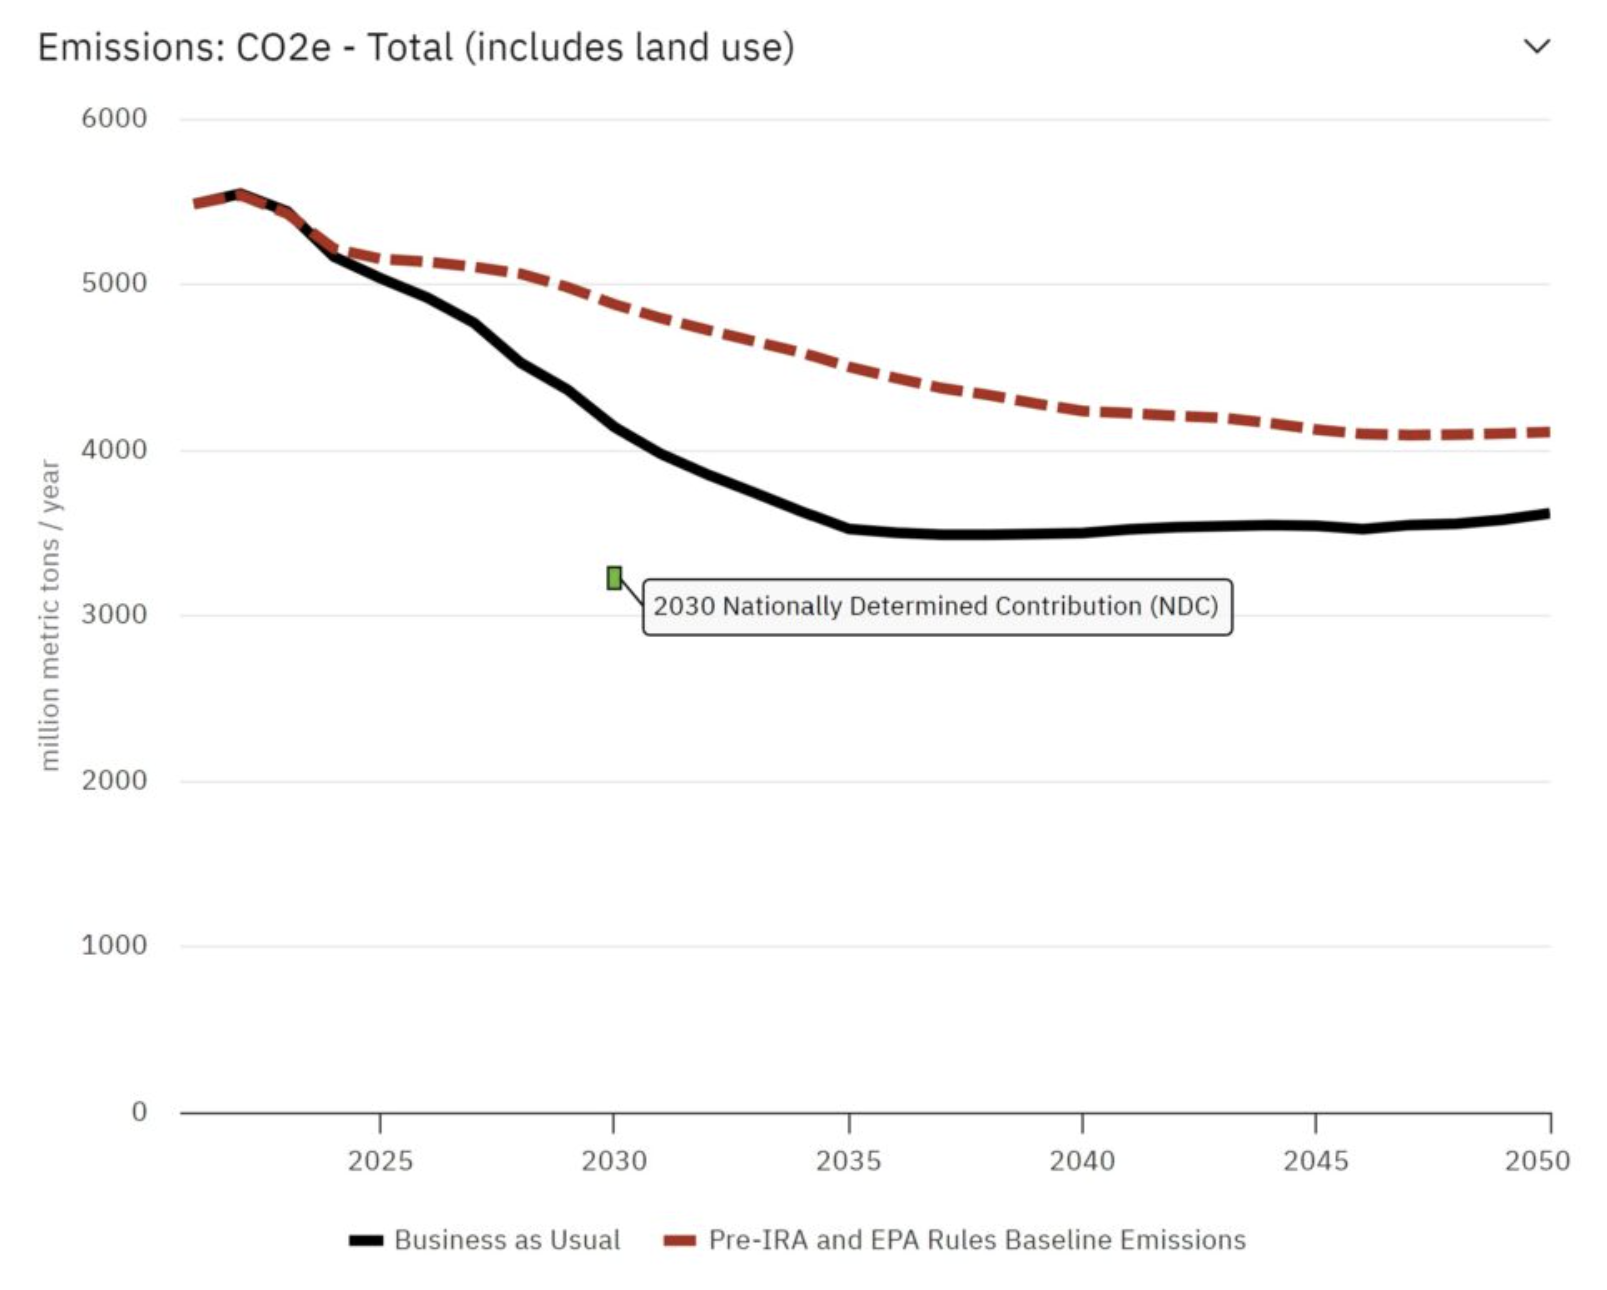
- GHG Reduction Targets: Each state EPS model has a pre-loaded NDC Scenario that visualizes the annual emissions levels compatible with the Nationally Determined Contribution under the Paris Agreement. GHG reduction targets can be adopted from this scenario, or states can devise their own using the information. RMI identified state-specific emissions reduction targets by applying the NDC policy scenario and calculating the resulting economywide emissions reductions in 2030 relative to a 2021 baseline. The resulting targets fit within an ambitious, actionable, and achievable framework.
- Quantified GHG Reduction Measures: The EPS supports modeling of hundreds of energy policies, such as tax credits for clean energy technologies, low-carbon fuel standards, and building retrofits. On the left side of the web tool, broken out by sector, there are levers that can be toggled on and adjusted to simulate policy adoption. The resulting emissions reductions are calculated in real time and visually depicted. For each policy, the implementation schedule can be customized to reflect stringency and covered years. Adjusting the levers, their corresponding values, and the implementation schedule allows for quick testing and iteration of measures to reduce emissions.
Additionally, because the EPS is a systems-dynamic model, it showcases the impact of policy interactions when multiple levers are pulled. This is particularly important because policies may interact with one another to amplify or counteract pollution reductions.
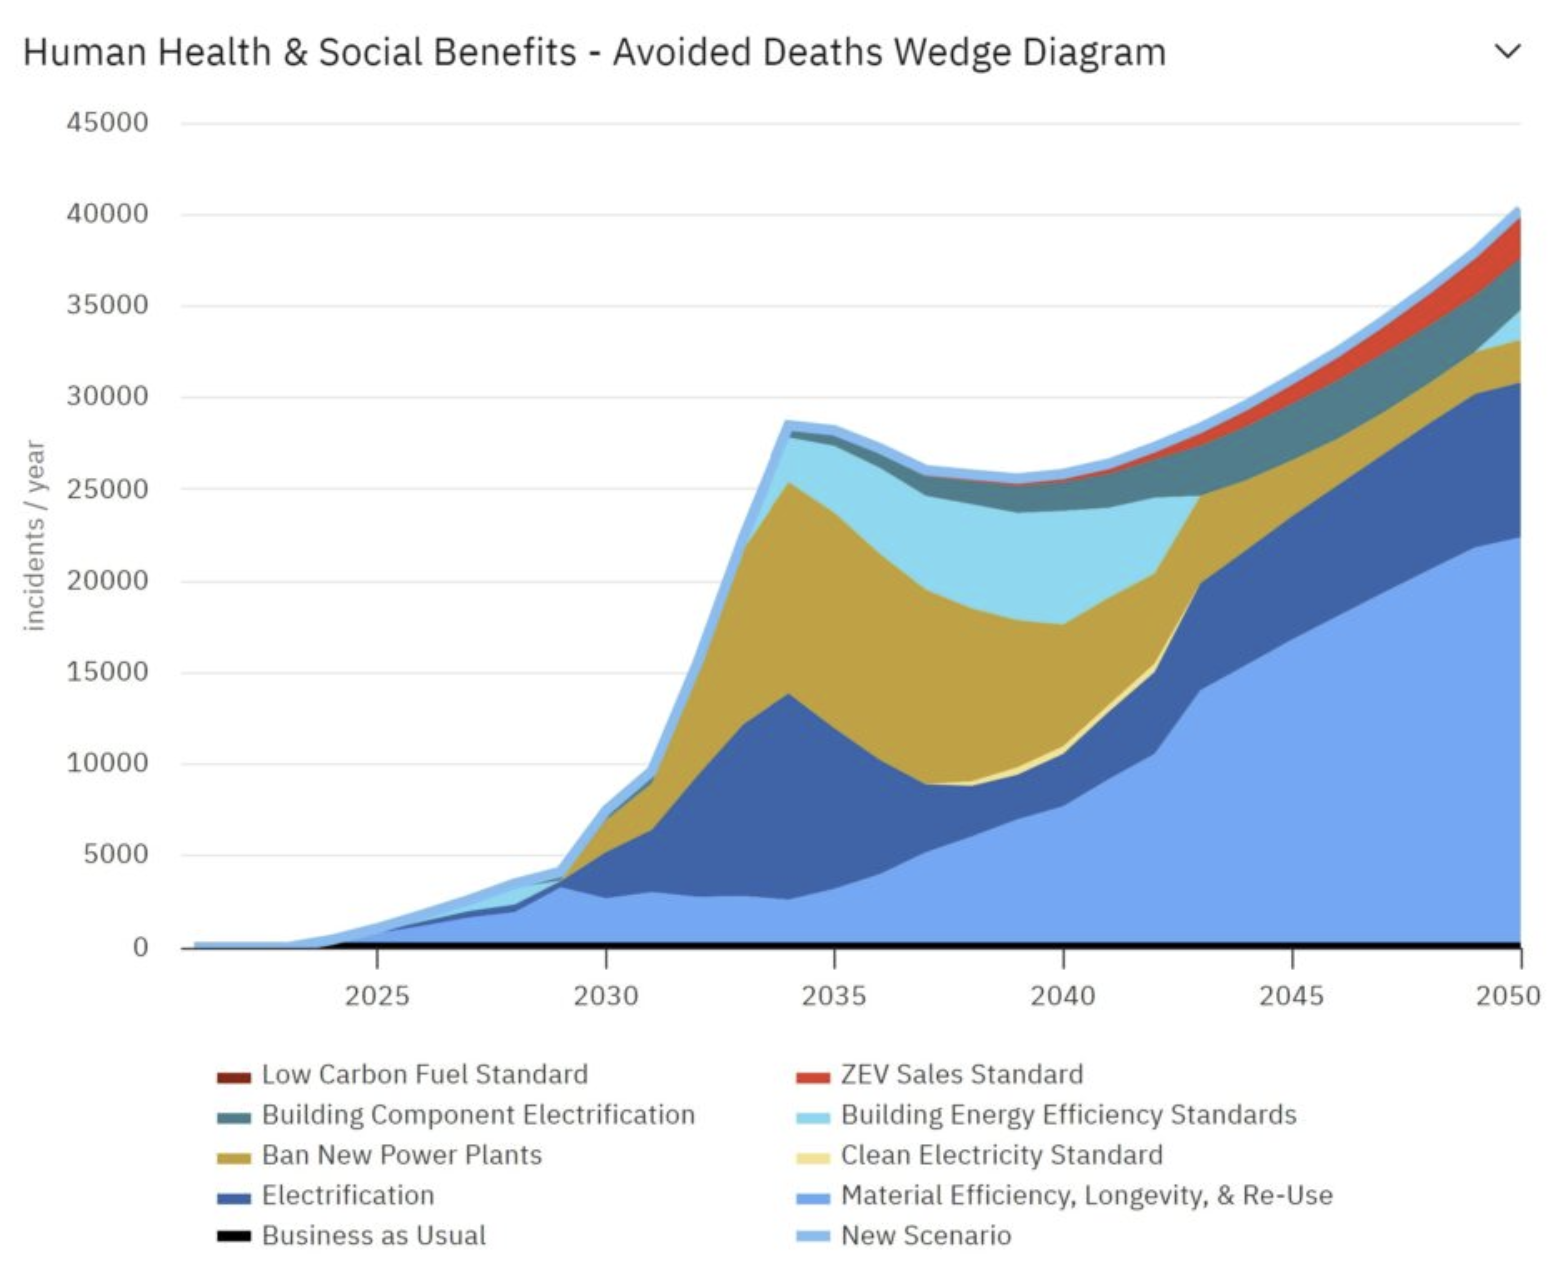
Benefits Analysis: The benefits of adopting energy policies extend beyond climate pollution reductions. The EPS includes estimates of the health, social, and economic benefits expected from modeled policies. A sampling of specific benefits that a state can analyze and quantify in their CCAPs include avoided deaths, avoided lost workdays, induced change in jobs, and percent change in GDP. States can also use these metrics to select priority measures and build support among stakeholders.
When PCAPs were submitted in March 2024, at least eight states (Minnesota, Georgia, Pennsylvania, Colorado, Wisconsin, Texas, Illinois, and Michigan) used a previous iteration of the EPS to develop their plan, which can be ported into the new model. Some states also used the EPS when developing applications to win CPRG implementation grants.
Updated EPS models support planning for potential load growth
A key component of climate action planning is understanding and meeting different electricity load growth scenarios. And notably, utilities across the country have been increasing their expectations for electrical load.
To support states to better understand the potential scenarios more fully, EPS can now simulate hourly generation dispatch during peak winter and summer periods in which consumer electricity demand is highest. The models can also estimate load growth related to electrification driven by the clean energy transition, offering insights into both how much and which types of clean firm power are necessary. Other drivers of forecast load growth, including new manufacturing, artificial intelligence and data centers, are not projected in this tool and should be considered separately.
The types of resource options that EPS can assess to meet potential load can inform the CCAPs, which allow states the chance to identify opportunities to build clean energy resources, energy efficiency, and demand-side management options.
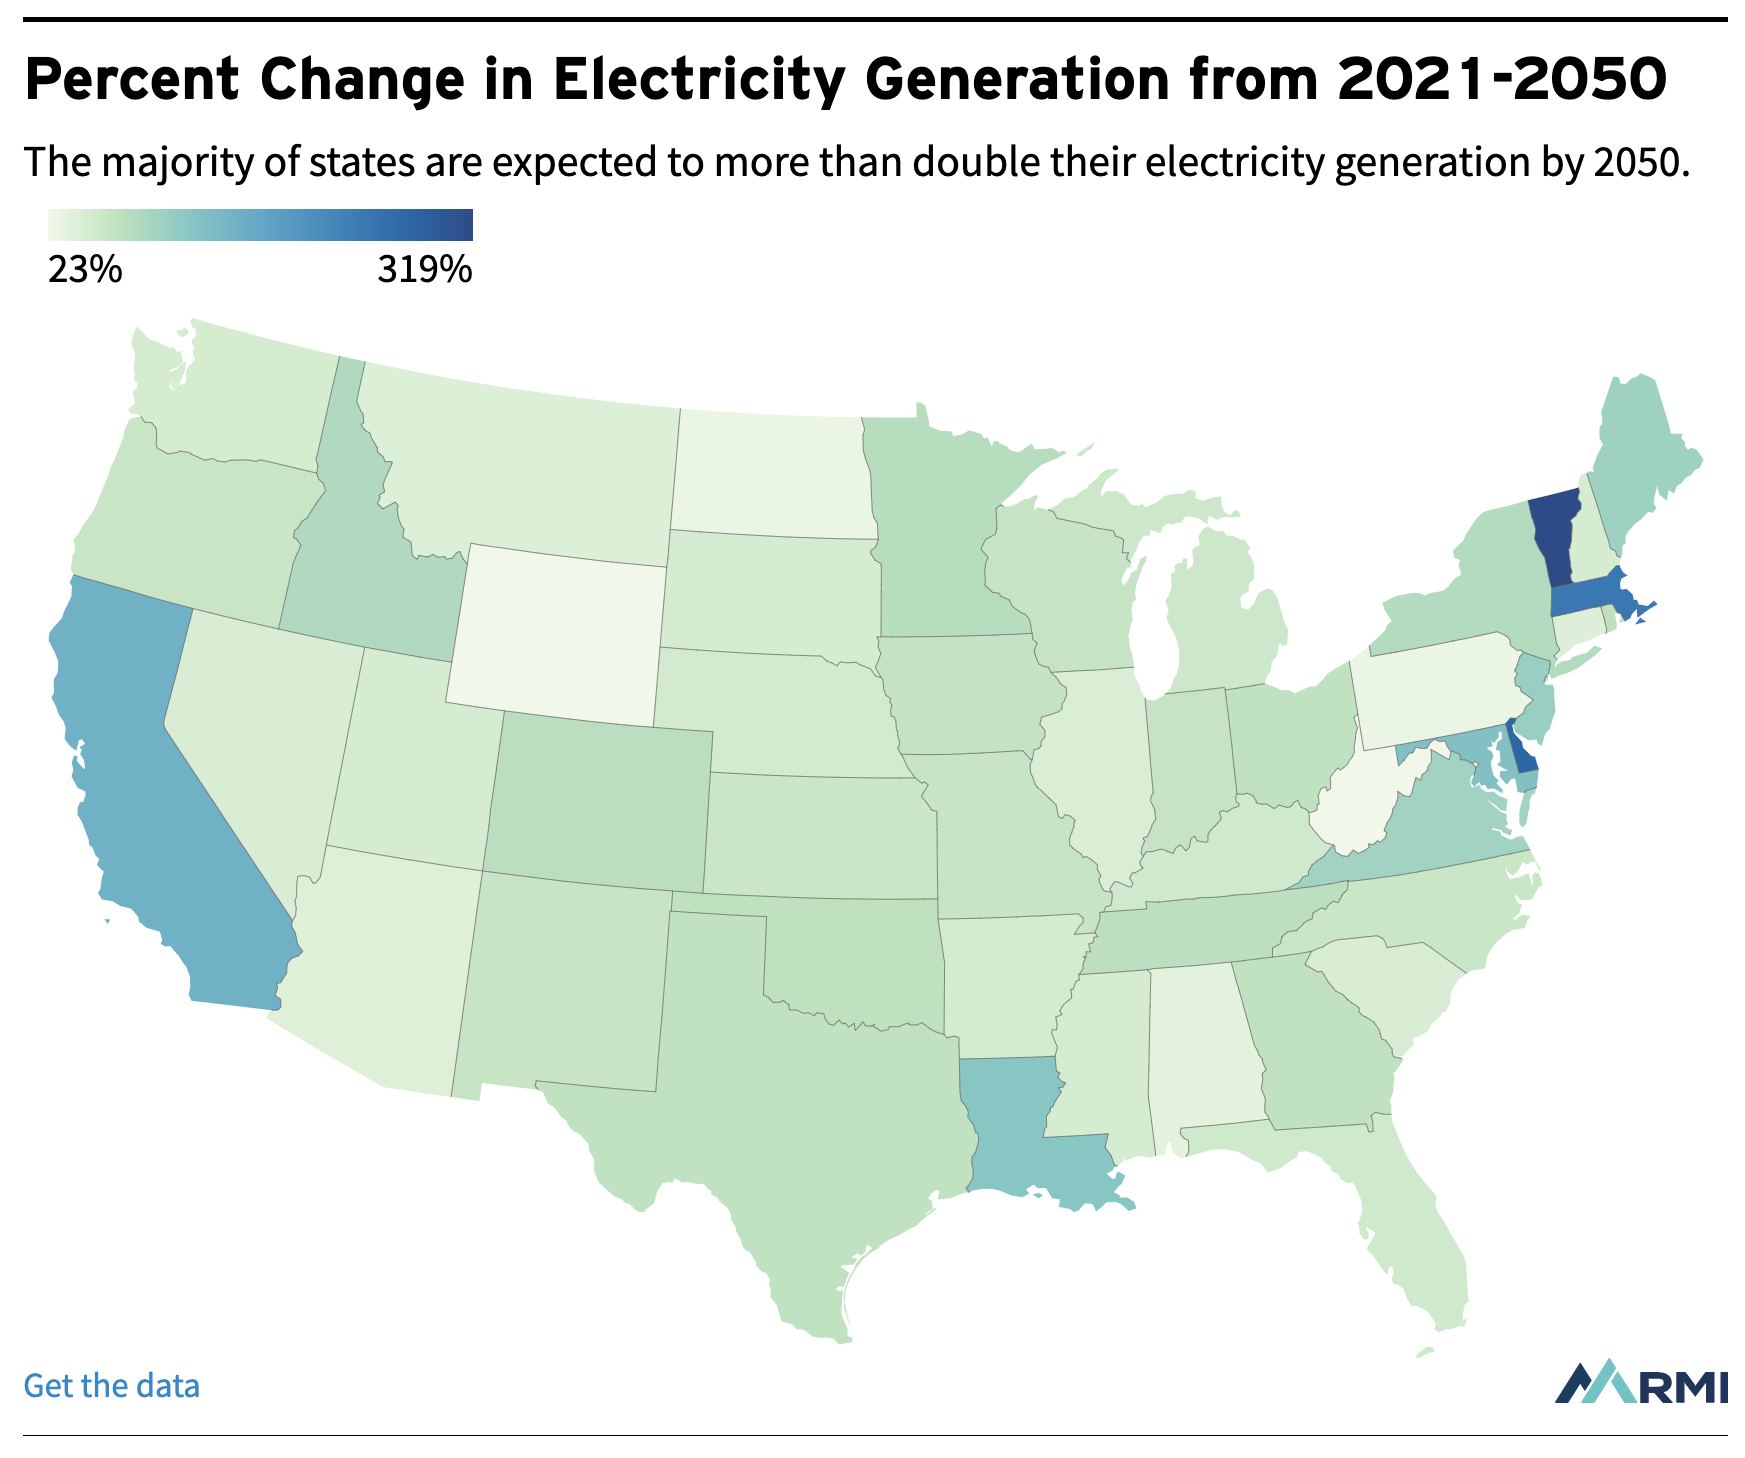
Ultimately, as more clean resources are put onto the grid, the question moves from clean volume to clean reliability. IRA incentives for battery storage and clean firm power will be essential to supporting that endeavor. Potential load growth is also an opportunity to bring federal funding to the states while creating a more reliable and cleaner grid.
The transition to clean energy creates economic opportunities
The CCAPs are an opportunity not just to reduce climate pollution but to strategically advance clean energy and cleantech-led economic development.
RMI has found that IRA programs could unlock between $1 billion and $154 billion per state by 2031, if clean energy technologies are adopted at the pace and scale needed to meet national climate targets. For all states, the refreshed EPS demonstrates how clean energy investments drive economic development.
Overall, the transition to clean energy sources, which will be furthered by measures included in state CCAPs, will change the power grid. States will depend more on in-state electricity generation, which can displace imports of fossil fuels. This shift, from imported fossil fuels to installed clean energy infrastructure generating in-state production, can improve state economies.
For fossil-producing states, there are other economic opportunities from the buildout of clean economies. Regional competitiveness is driven by building the tools for decarbonization, including investments in emerging technologies. Michigan, for example, is leveraging IRA funding and providing economic incentives that are enabling the state to become globally competitive in clean energy manufacturing and return to pre-recession levels in manufacturing employment.
Conclusion
Looking forward to the CCAPs, the updated EPS is a powerful, fast and free tool for helping states meet required elements. This includes quantifying pollution reduction measures, projecting emissions into the future, setting targets, and estimating co-benefits.
We are eager to see how states and decision makers use the EPS going forward and are available to answer questions (contact USAnalysis@rmi.org).
Note: Consistent with EPA methodology, the EPS online tool calculates GHG emissions using a 100-year Global Warming Potential (GWP) for all climate pollutants. However, users can access the underlying model to estimate GHG emissions using GWP20 for assessing impacts over a 20-year timeframe.
This work was made possible with the generous support of Bloomberg Philanthropies.
Originally published on RMI. By Kayleigh Rubin, Nathan Iyer, Adefunke Sonaike.
Have a tip for CleanTechnica? Want to advertise? Want to suggest a guest for our CleanTech Talk podcast? Contact us here.
Latest CleanTechnica.TV Videos
CleanTechnica uses affiliate links. See our policy here.
CleanTechnica’s Comment Policy

