Sign up for daily news updates from CleanTechnica on email. Or follow us on Google News!
Key Takeaways:
- Focus on high-potential corridors with strong GDP, climate action, and low-carbon electricity
- Drill down to county-level data to align charging infrastructure with local needs
- Start with collaborative pilots and scalable microgrids to drive adoption
When rolling out electric truck charging microgrids for depots and truck stops, a key question to ask is: Where first? The audiences for this strategic perspective — major logistics firms like UPS and Amazon, major truck stop chains like Pilot, and major turn-key truck stop and depot contractors like TLM and Gray — may agree with designing a menu of incrementally bigger capacity microgrids for truck charging, but which of the hundreds of depots or truck stops they own and operate, or the thousands of depots and truck stops across the USA should they start with?
As the authors — Rish Ghatikar and Michael Barnard, experts in sustainability, transportation, and strategy — explored in their diagnosis of the challenges of truck charging, there are overlapping concerns which can heavily slow down deployment of megawatt scale charging solutions to accelerate truck electrification, and getting derailed into non-charging value propositions is one of them. So far the actions have included incrementally adding charging capacity in standardized increments, leveraging electricity pricing flexibility microgrids afford for competitive advantage, finding your lego for modular microgrid components, sticking to the knitting of charging and establishing a central and tightly controlled program to deploy charging microgrids, all explored in previous articles. But that won’t help if they are put in the wrong places where the conditions for success don’t exist.
The authors have identified a key set of filters to assist with this strategic choice, and roughly tiered US into these categories. Our starting filters were gross domestic product (GDP) per capita and climate action orientation and carbon dioxide or equivalent per kilowatt hour (CO2e/kWh) of electricity.
GDP per capita was chosen as a proxy for three things. The first was purchasing power per person, the likelihood that a lot of freight would be flowing on roads within the state. The second was the ability of consumers to pay a green premium, if any, for early additional costs for shipping. The third is the ability of the state to fiscally support incentive programs for decarbonized trucking and charging microgrids.
Climate action orientation was chosen not for ability but for willingness to pay. It’s a proxy for consumer willingness to pay a bit extra or to feel positive about lower carbon deliveries. It’s a proxy for a state being willing to allocate budget dollars to decarbonized trucking and charging microgrids.
The carbon intensity of electricity, CO2e/kWh, was chosen because it has a direct correlation to the carbon intensity of freight trucking. As one of the authors, Barnard, published in mid-2024, road freight trucking with electric semi tractors is already lower carbon than rail in eight US states. This means that in these states, where there is any impetus for lower carbon shipping, trucking will empirically be lower carbon and hence more preferred by organizations measuring that and delivering to their customers’ and stakeholders preferences.
CO2e/kWh was averaged from the different grid subregion data produced by the US Environmental Protection Agency in its eGrid dataset, most recently published in early 2024 for the year of 2022. While state-level aggregation is appropriate for this detailed analysis, logistics and truck stop firms will want to do the modeling at a county-by-county level to ensure that locations’ electricity carbon intensities are accurate, as side-by-side grid sub-regions can have substantially different intensities, and some states are a patchwork of sub-region grids. Both Alaska and Hawaii, for example, have two grid sub-regions with quite different carbon intensities.
As a reminder, the trajectory of carbon intensity in all grid subregions in the United States is downward, but some grids are greening faster than others. Texas continues to surprise observers as the dominant jurisdiction for wind and solar generation deployment, rhetoric from the state not matching investment on the ground. Renewable generation is just cheaper, so it’s outcompeting even natural gas generation in purchasing decisions across the country. Every MWh of renewably generated electricity displaces a MWh of electricity generated with natural gas or coal, so the effect is lower carbon emissions from electricity everywhere.
However, the authors have carefully chosen carbon dioxide or equivalents as the measure, provided by the eGrid material. This measures not only carbon dioxide, but also methane and nitrous oxides. Methane, the dominant component of natural gas, has a very high global warming potential, 30 to 80 times that of carbon dioxide depending on the timeframe considered. Nitrous oxides are in the range of 270 times more heating than carbon dioxide. Natural gas generators and the extraction, transmission, and distribution systems that lead to them leak methane. When natural gas is burned in generators, nitrous oxides are a result. This is gaining much more focus, and measurement is finding higher leakage at every step of the value chain than previously assumed. Natural gas-heavy grids are likely to see adjustments upward of CO2e/kWh as a result.
This matters for both accurate assessment of carbon intensity of electric trucking, but also for supply chains that lead to exports to Europe and need to be accurately reported on. Europe’s carbon border adjustment mechanism will include methane and nitrous oxides in 2026, the same year that imports to the economic bloc will start incurring the carbon price. Ignoring these two potent greenhouse gasses isn’t advised.
As noted in the diagnosis of all freight modes in the United States’ ability to decarbonize, while freight rail is under pressure by major logistics firms such as Amazon, rail organizations’ likelihood to actually decarbonize given the major headwinds in the country is low. This puts the country at odds with every other major economy in the world, and the technical reasons given are specious, but effectively the federal government would have to pay for the electrification of roughly 50% of all tracks in the USA and for conversion of the majority of locomotives in order for it to occur.
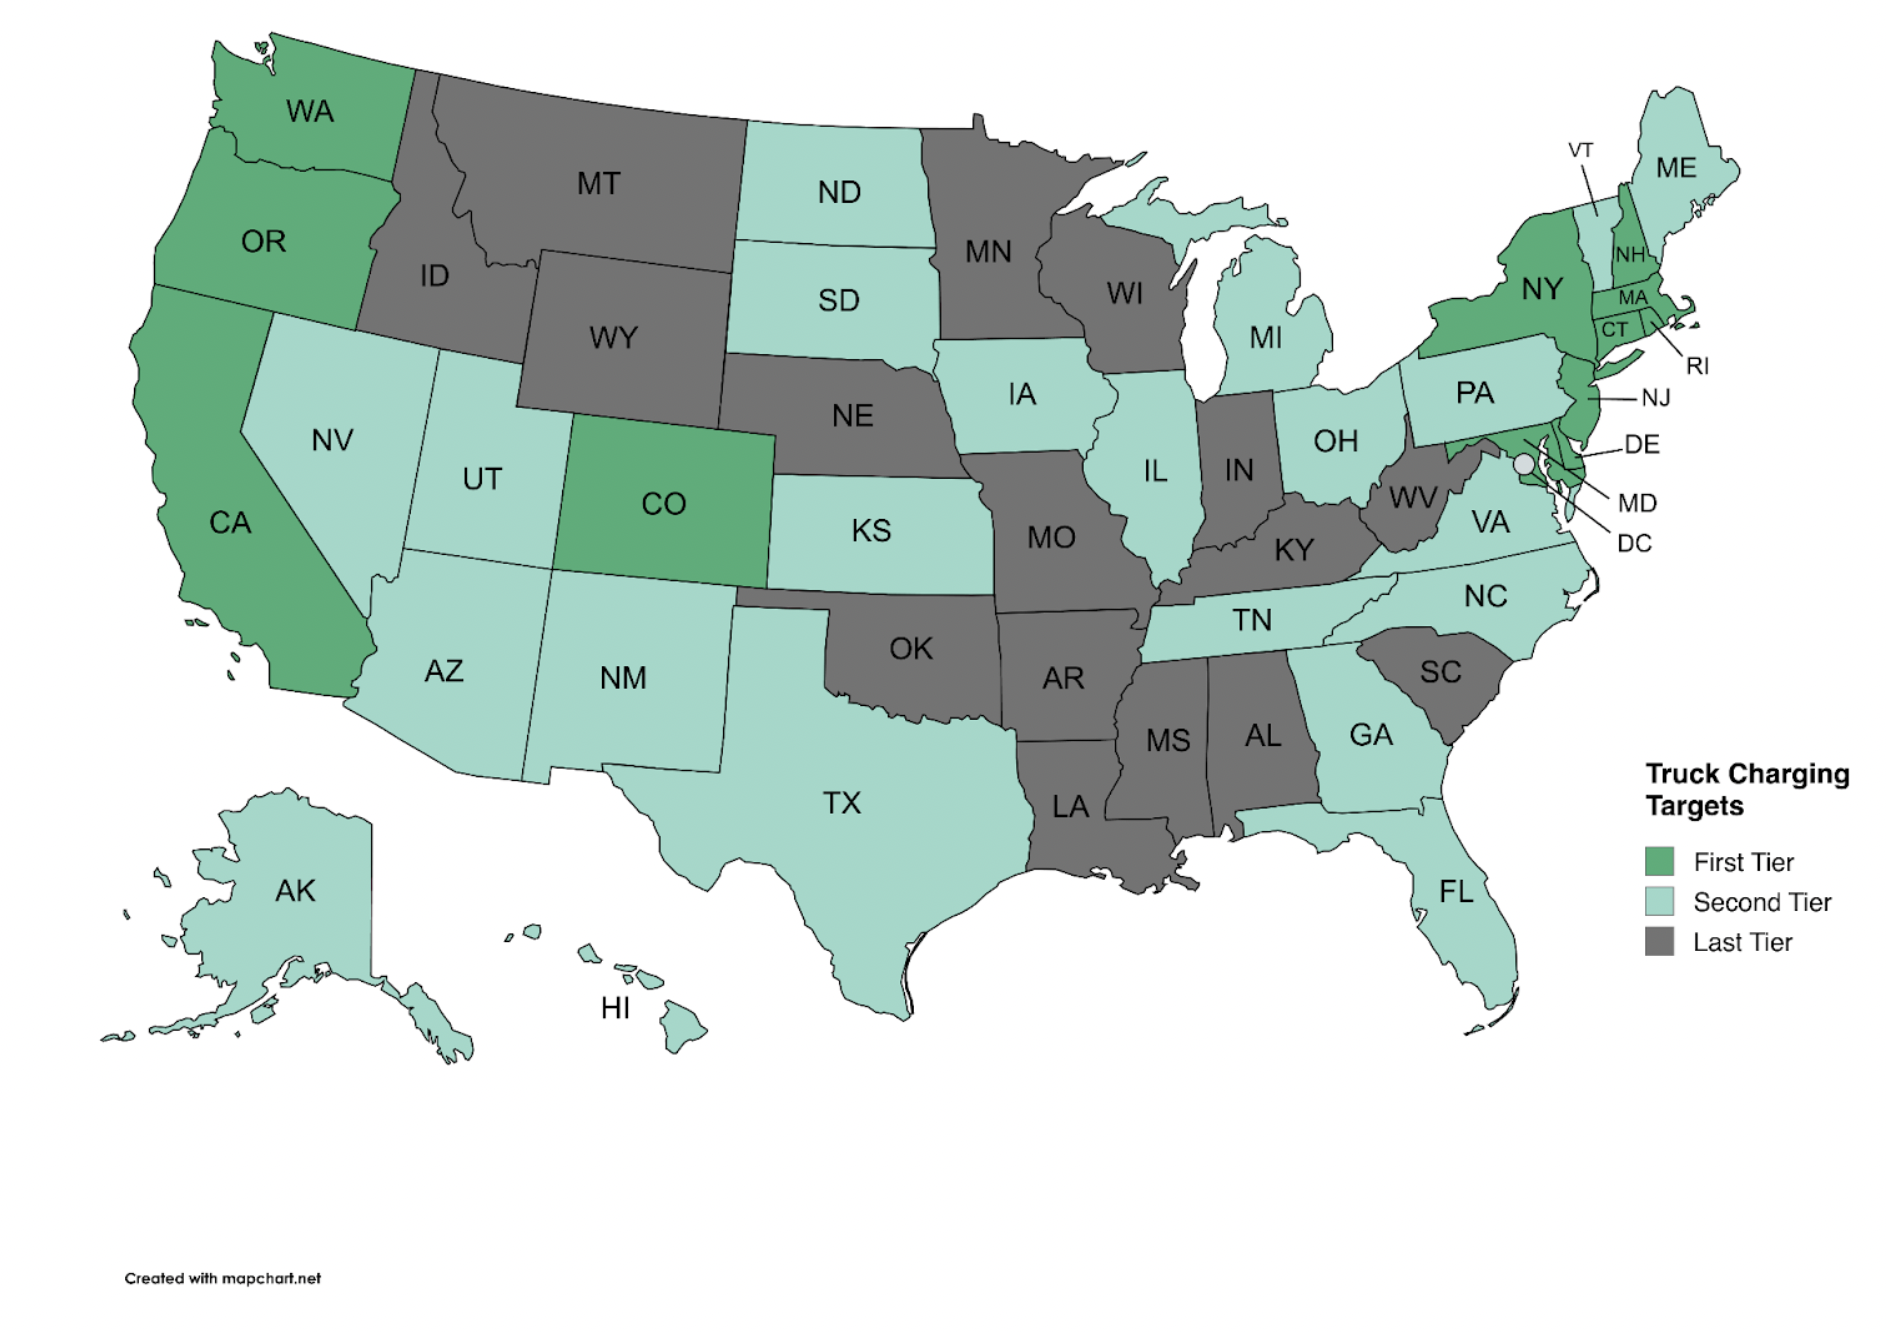
For each of these we gathered state level data, and then extrapolated to a score of one, two, or three for each state, with three being highest. California, for example, scores a three in each category, while Missouri scores a one in each. These were summed to create a state score out of nine, and then the states sorted and grouped by scores.
As a note on the methodology, both authors have created multiple scoring methodologies for various strategic ranked choice initiatives over the couple of decades of their global careers. However, in recent years, Daniel Kahneman’s book Noise: A Flaw in Human Judgment with Olivier Sibony and Cass Sunstein has persuaded us to change our approach. The authors of the book make the clear statistical case that in scoring matrices, fewer criteria with no weighting give more reliable results.

At first blush, the map of states coded with tiers is an unsurprising result. If the analysis had shown anything other than that the western and northeastern coastal states were highly ranked based on the criteria, the analysis would clearly have had an error.
Obvious green truck charging corridors for the first waves are up and down the west coast and into affluent, climate-focused British Columbia, and likely from New York to Virginia.
Second wave green truck charging corridors are likely from Virginia to Florida and from Texas to California.
Third wave green truck charging corridors would include two cross-country routes from Florida to California and from New York to Indiana, then possibly down to Kansas and straight across to California, taking advantage of Colorado’s strong showing.
For the target audiences for this microgrid strategy, there are three actions to take. The first is to do a more comprehensive analysis of this type, but include the factor of existing facilities for logistics firms and truck stop chains, and for market connections and strength for turn key firms that build depots and truck stops. This will firm up the strategic order of events.
The second is to subdivide the analysis down to the granularity that makes sense for your business, the county level for physical locations to get the accurate carbon intensity of electricity, high-volume routes for logistics firms and other factors.
The third is to assess the major routes that emerge to look at specific locations, traffic volumes today, likely traffic volumes in the future given a shift of additional container volume from rail, and compare to the initial microgrid incremental sizings to see if there’s any requirement for adjustment.
At this point, there is sufficient information to identify a pilot route or two. They must be high enough profile that there’s skin in the game, and have willing participants in the local management and workers. Picking from the highest tier of routes with the most favorable local governments will assist with success.
For truck stop firms, an analysis of distances traveled for electric trucks between truck stops will be necessary, as current trucks vary considerably in terms of usable range. An analysis of current and near future ranges will assist in sub-selecting the truck stops out of the route to target first. Picking locations in low carbon intensity grid subregions and enabling driving across high carbon intensity grid subregions is a good refinement to make.
The challenges that this approach takes reduces the complex regulatory and stakeholder barriers that building microgrids face in many jurisdictions. The affluence of customers and potential for increased market share by taking volume from rail reduces somewhat the challenge of capital expenditures preceding revenues. The combination of actions the authors are suggesting address all of the challenges, without eliminating them.
Previous articles in this series:
About the authors:
Rish Ghatikar has an extensive background in decarbonization, specializing in electric vehicles (EVs), grid integration, and demand response (DR) technologies. At General Motors (GM), he advanced transportation electrification energy services, as part of a broader climate strategy. Previously, at Electric Power Research Institute (EPRI), he focused on digitalizing the electric sector, while at Greenlots, he commercialized EV-grid and energy storage solutions. His work at the DOE’s Lawrence Berkeley National Laboratory spearheaded DR automation to support dynamic utility pricing policies. An active climate advocate, Ghatikar advises on policies and technologies that align the grid with transportation and energy use for sustainable growth.
Michael Barnard, a climate futurist and chief strategist at The Future Is Electric (TFIE), advises executives, boards, and investors on long-term decarbonization strategies, projecting scenarios 40 to 80 years into the future. His work spans industries from transportation and agriculture to heavy industry, advocating for total electrification and renewable energy expansion. Barnard, also a co-founder of Trace Intercept and an Advisory Board member for electric aviation startup FLIMAX, contributes regularly to climate discourse as a writer and host of the Redefining Energy – Tech podcast. His perspectives emphasize practical solutions rooted in physics, economics, and human behavior, aiming to accelerate the transition to a sustainable future.

Chip in a few dollars a month to help support independent cleantech coverage that helps to accelerate the cleantech revolution!
Have a tip for CleanTechnica? Want to advertise? Want to suggest a guest for our CleanTech Talk podcast? Contact us here.
Sign up for our daily newsletter for 15 new cleantech stories a day. Or sign up for our weekly one if daily is too frequent.
CleanTechnica uses affiliate links. See our policy here.
CleanTechnica’s Comment Policy


