This summer the Northern Hemisphere has been so hot with record temperatures — including at sea — that discussions have turned to the limits of human survival. Even in the Antarctic, sea ice is failing to re-form, a drastic departure from normal winter patterns. It isn’t just your perception that extreme heat is happening more and more. As a result of climate change, the number of extreme heat events has accelerated — and it’s expected to worsen.
Indeed, heat is the deadliest disaster most years, killing an average of 490,000 people globally and causing severe health problems for many more. Deaths from heat are expected to grow by 50% by 2050, according to the World Health Organization. But the impact of heat on health isn’t equitably distributed — around the world or within our communities. Already vulnerable populations are at the greatest risk.
At the global scale, people in developing countries, particularly in South Asia, Africa and East Asia, who have contributed the least to cause climate change and do not have the resources to adapt are expected to have their health impacted the most by climate change-induced extreme heat.
At the city scale, neighborhoods with poorer and more marginalized populations, or with worse infrastructure and services, such as fewer green spaces and histories of restricted housing investment, are measurably hotter. This difference within cities exists in part because these neighborhoods are less likely to have tree cover and vegetation, an important mitigant of heat.
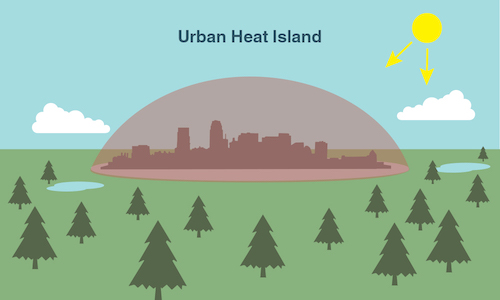
Image courtesy of Climate Kids, NASA
These neighborhoods are also more likely to have hard, dark surfaces, which absorb heat. This is an example of the urban heat island effect, where cities, or parts of cities, experience more heat than rural areas because man-made infrastructure such as buildings, streets and sidewalks often retain more heat than natural surfaces.
Extreme heat can be devastating, but there are tools every community can use to make measurable differences to reduce heat hazards to health, energy systems and our economies; improve urban equity; and even curb climate change. By adjusting the same land cover components that are the largest contributors to an urban heat island — such as buildings, trees and streets and built materials, including concrete, asphalt, permeable pavements, paints and coatings — cities can dramatically lower their temperatures.
The Influence of Urban Infrastructure on Heat — Examples from Monterrey and Mumbai
In cities, land cover is determined by infrastructure — both gray (roofs, pavements) and green (urban forests, street trees, streams and reservoirs). And choices among infrastructure options that provide the same function, like stormwater management, can have very different impacts on land cover (for example, vegetated streams instead of paved drainage channels). The relationship between land cover and heat is a consistent finding in cities and research where WRI has worked to identify cooling solutions. And the absence of cooling land cover is often found in neighborhoods where vulnerable people concentrate — exacerbating inequality in exposure to extreme heat.
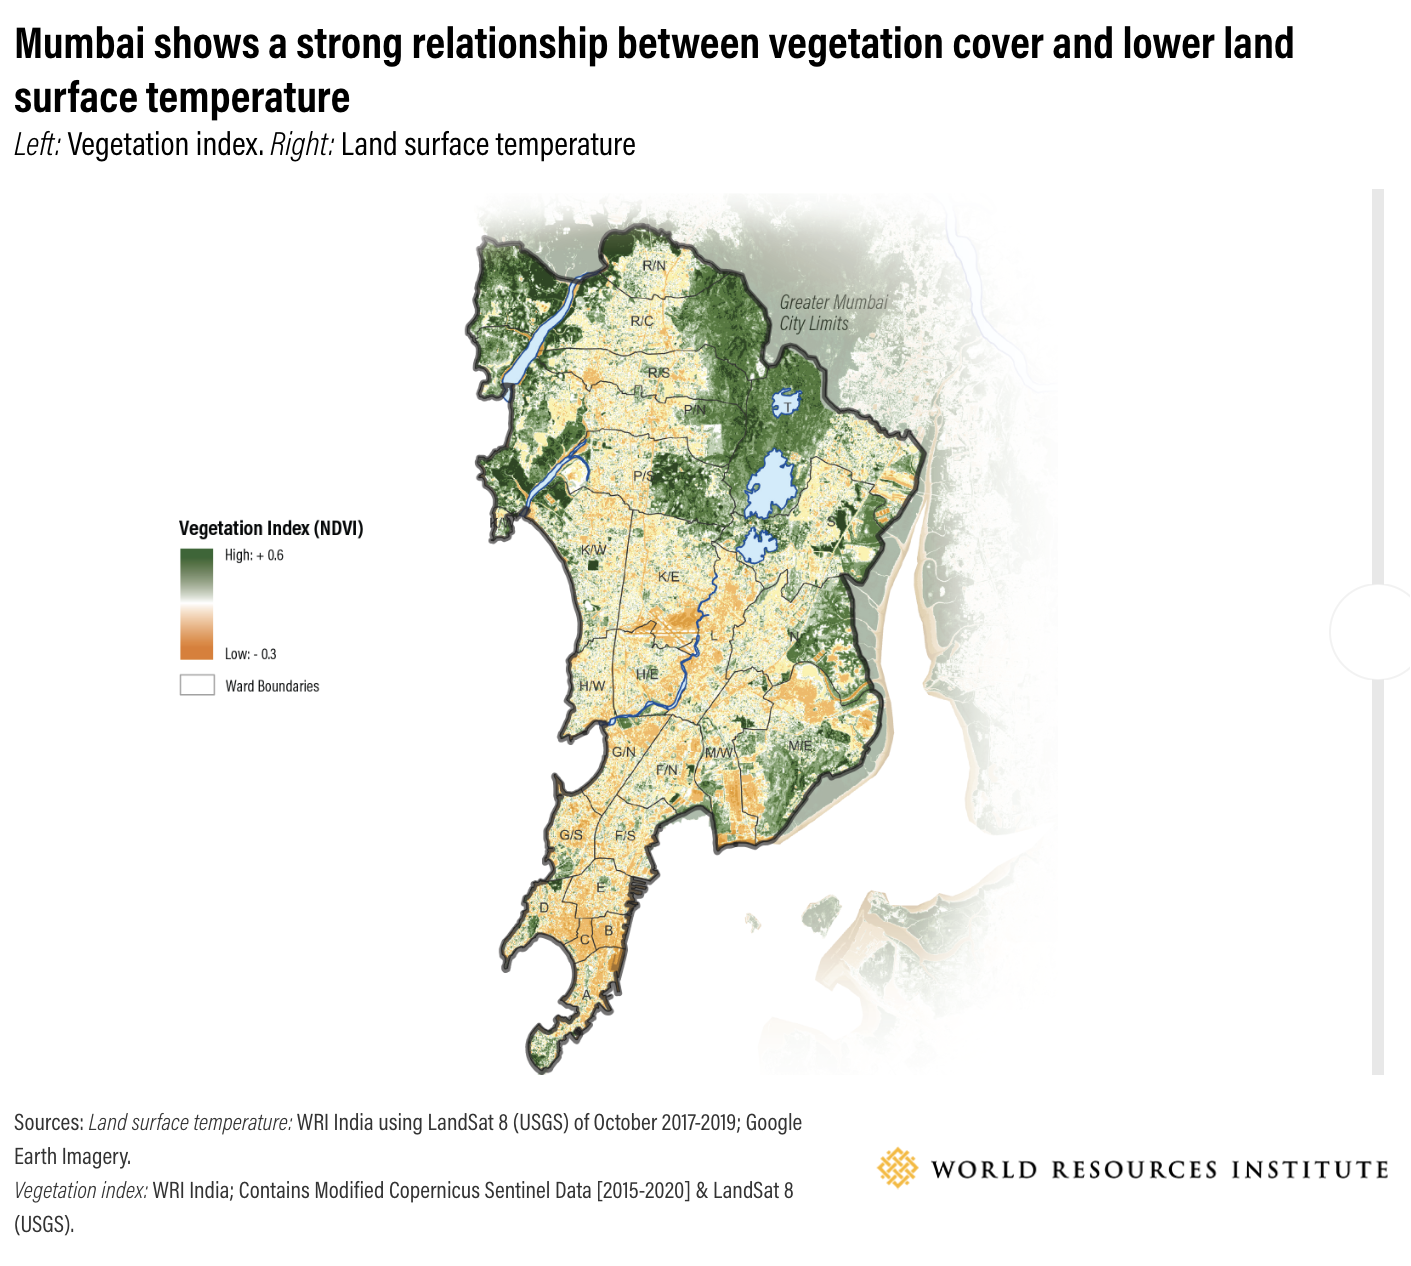
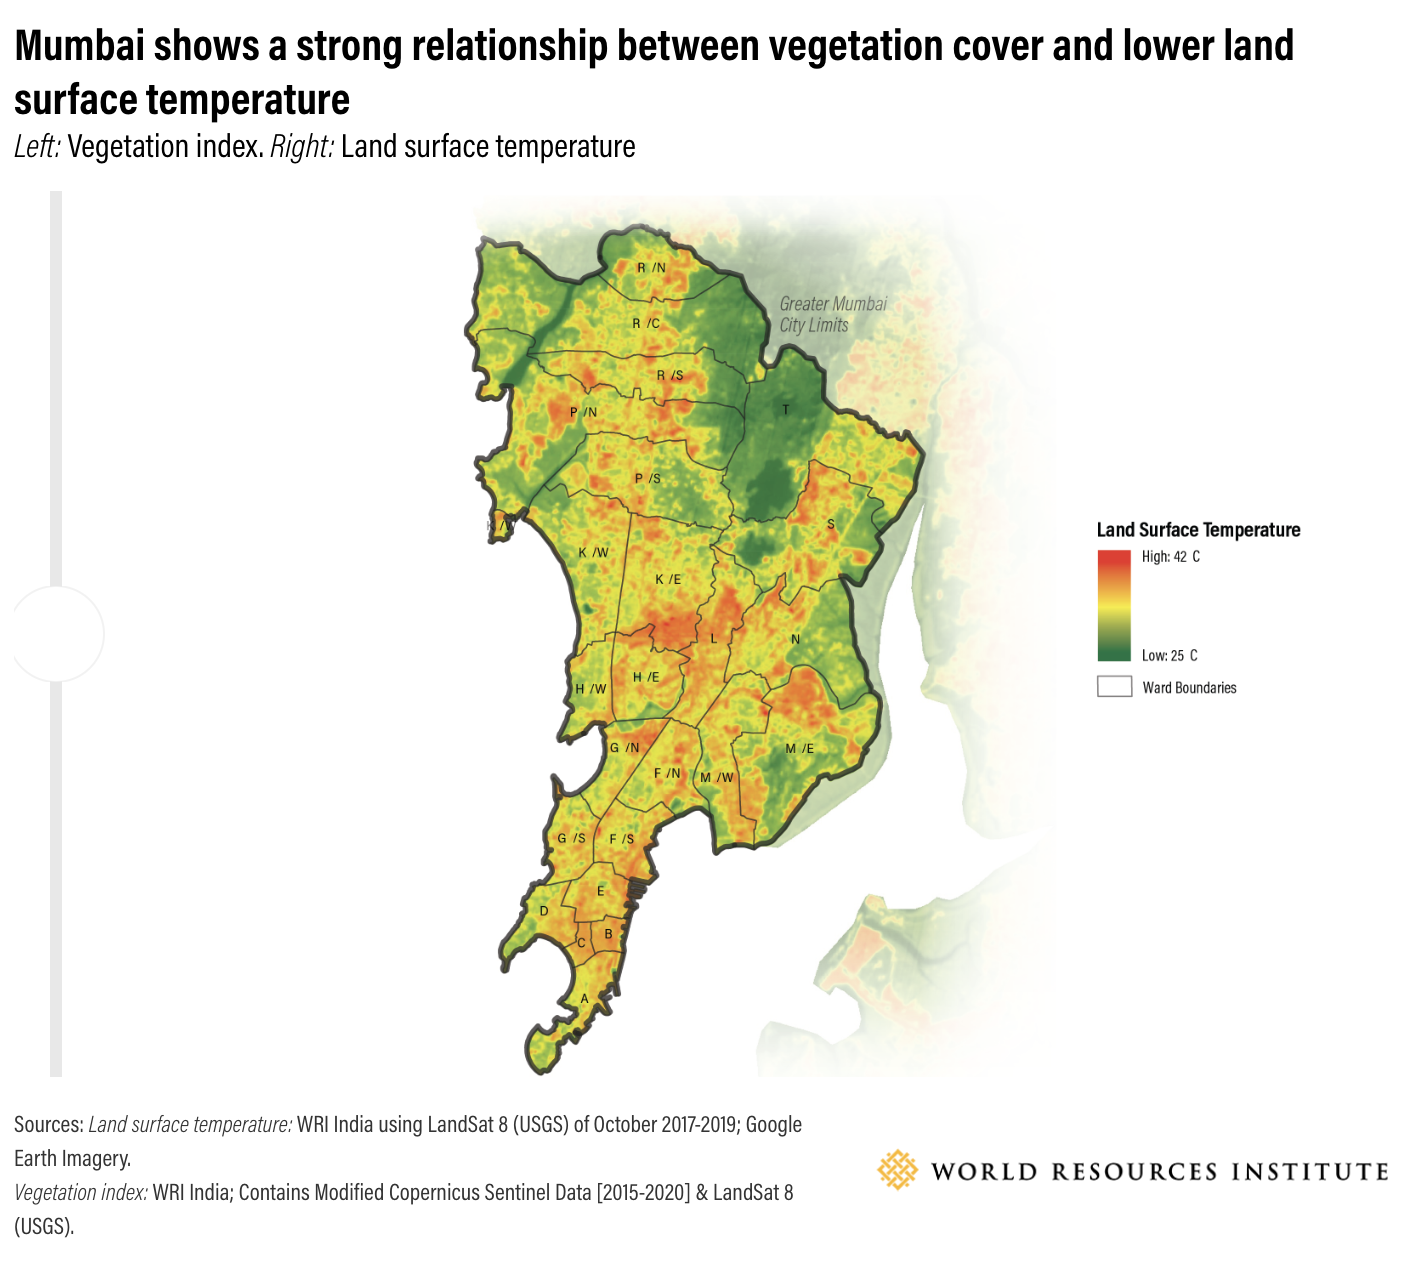
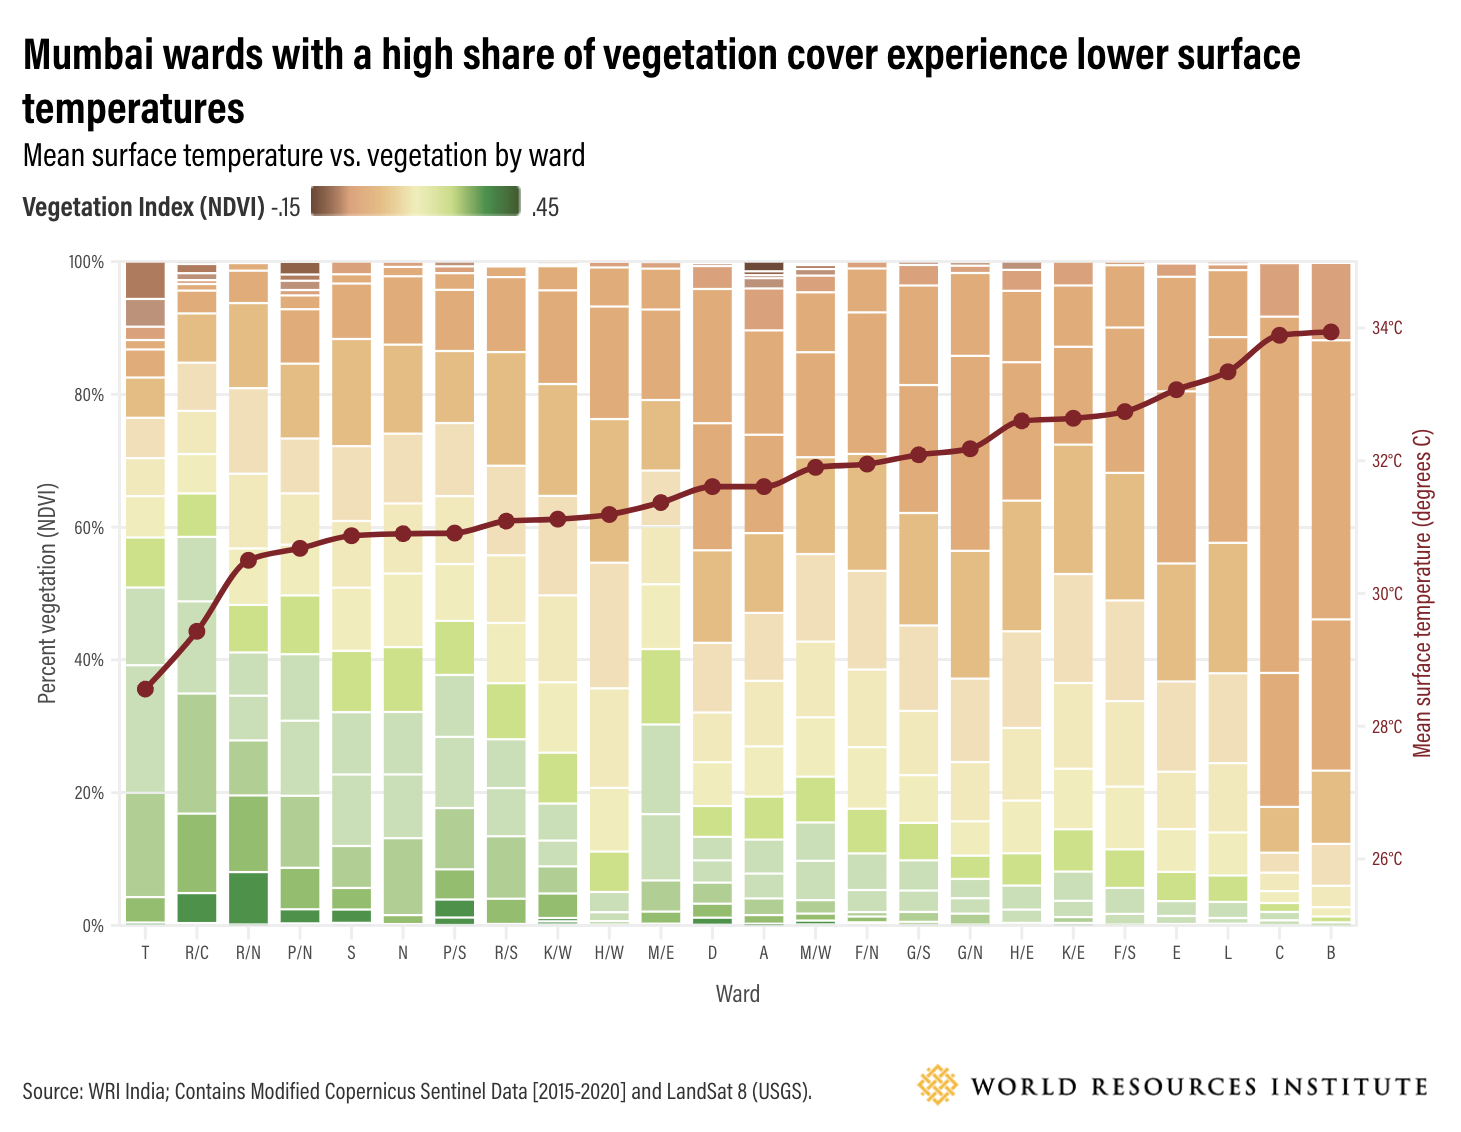
In Mumbai, where the city government considered heat hazards while developing its first Climate Action Plan (which defines the government’s commitment to address climate change), WRI India’s analysis found a strong relationship between the share of vegetation cover in city wards and lower land surface temperatures, with a difference of 5.5 degrees Celsius ( 10 degrees Fahrenheit) between the mean land surface temperature of the hottest and coolest neighborhoods.
A nature-positive future is possible for cities, but only with the right info. Our new dashboard, in partnership with @shiftcities, helps cities visualize their connection with nature and climate change across seven themes. Discover the themes here: https://t.co/cESYAAOoFu
— Cities4Forests (@Cities4Forests) July 14, 2023
Cooler and greener neighborhoods typically have a greater share of high-income residents, while hotter neighborhoods are more often informal settlements.
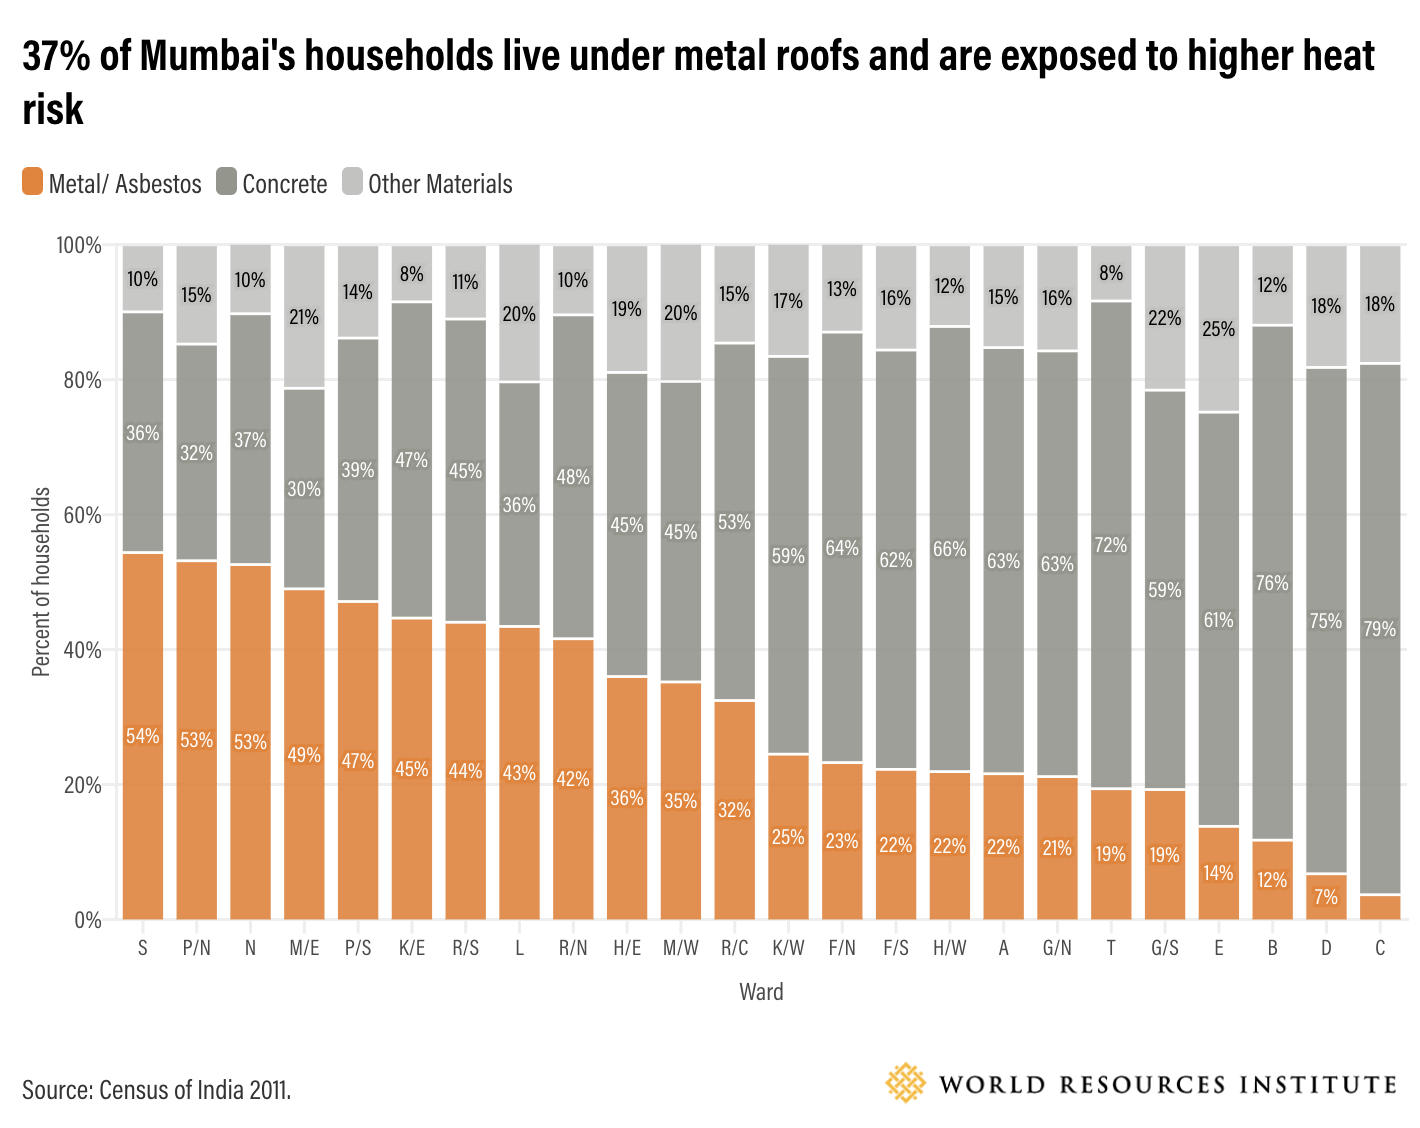
In addition, neighborhoods with a larger share of metal roofs, a roofing material associated with informal settlements and homes of low-income people, often had higher average surface temperatures. Around 37% of Mumbai households live under metal roofs and are exposed to higher heat risk.
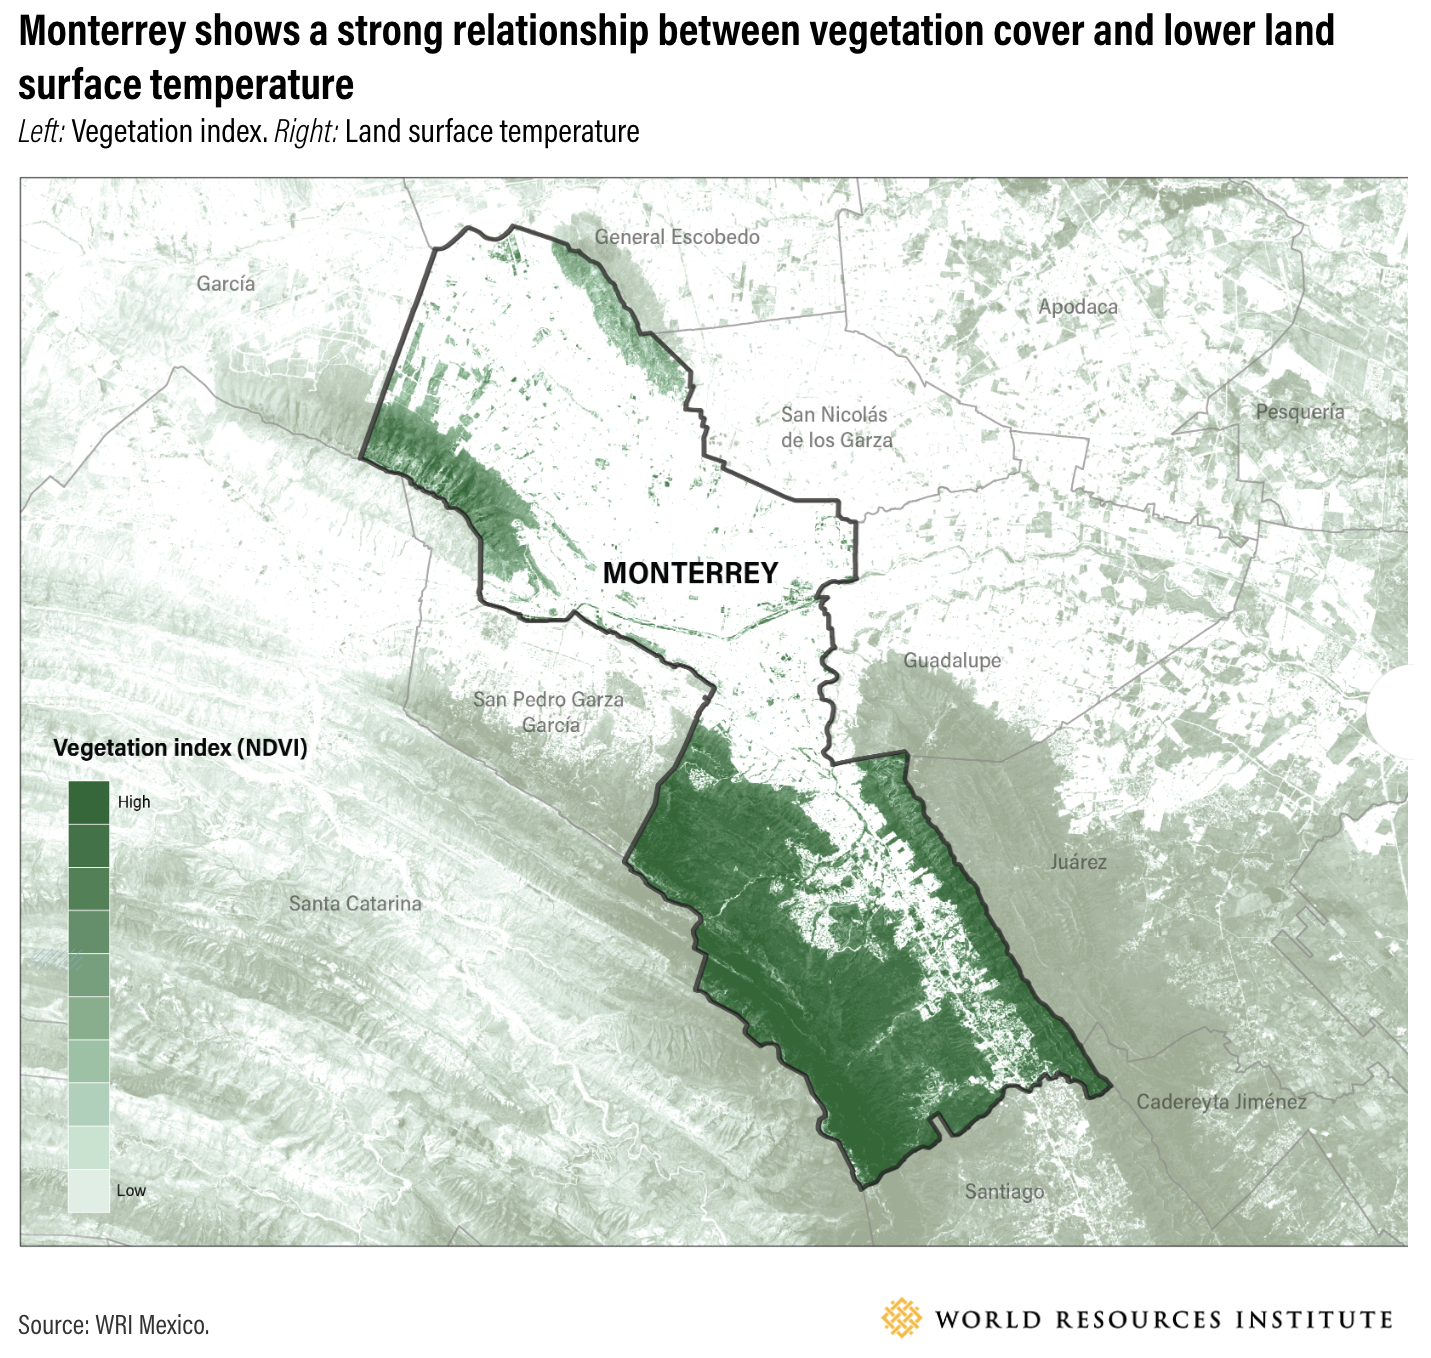
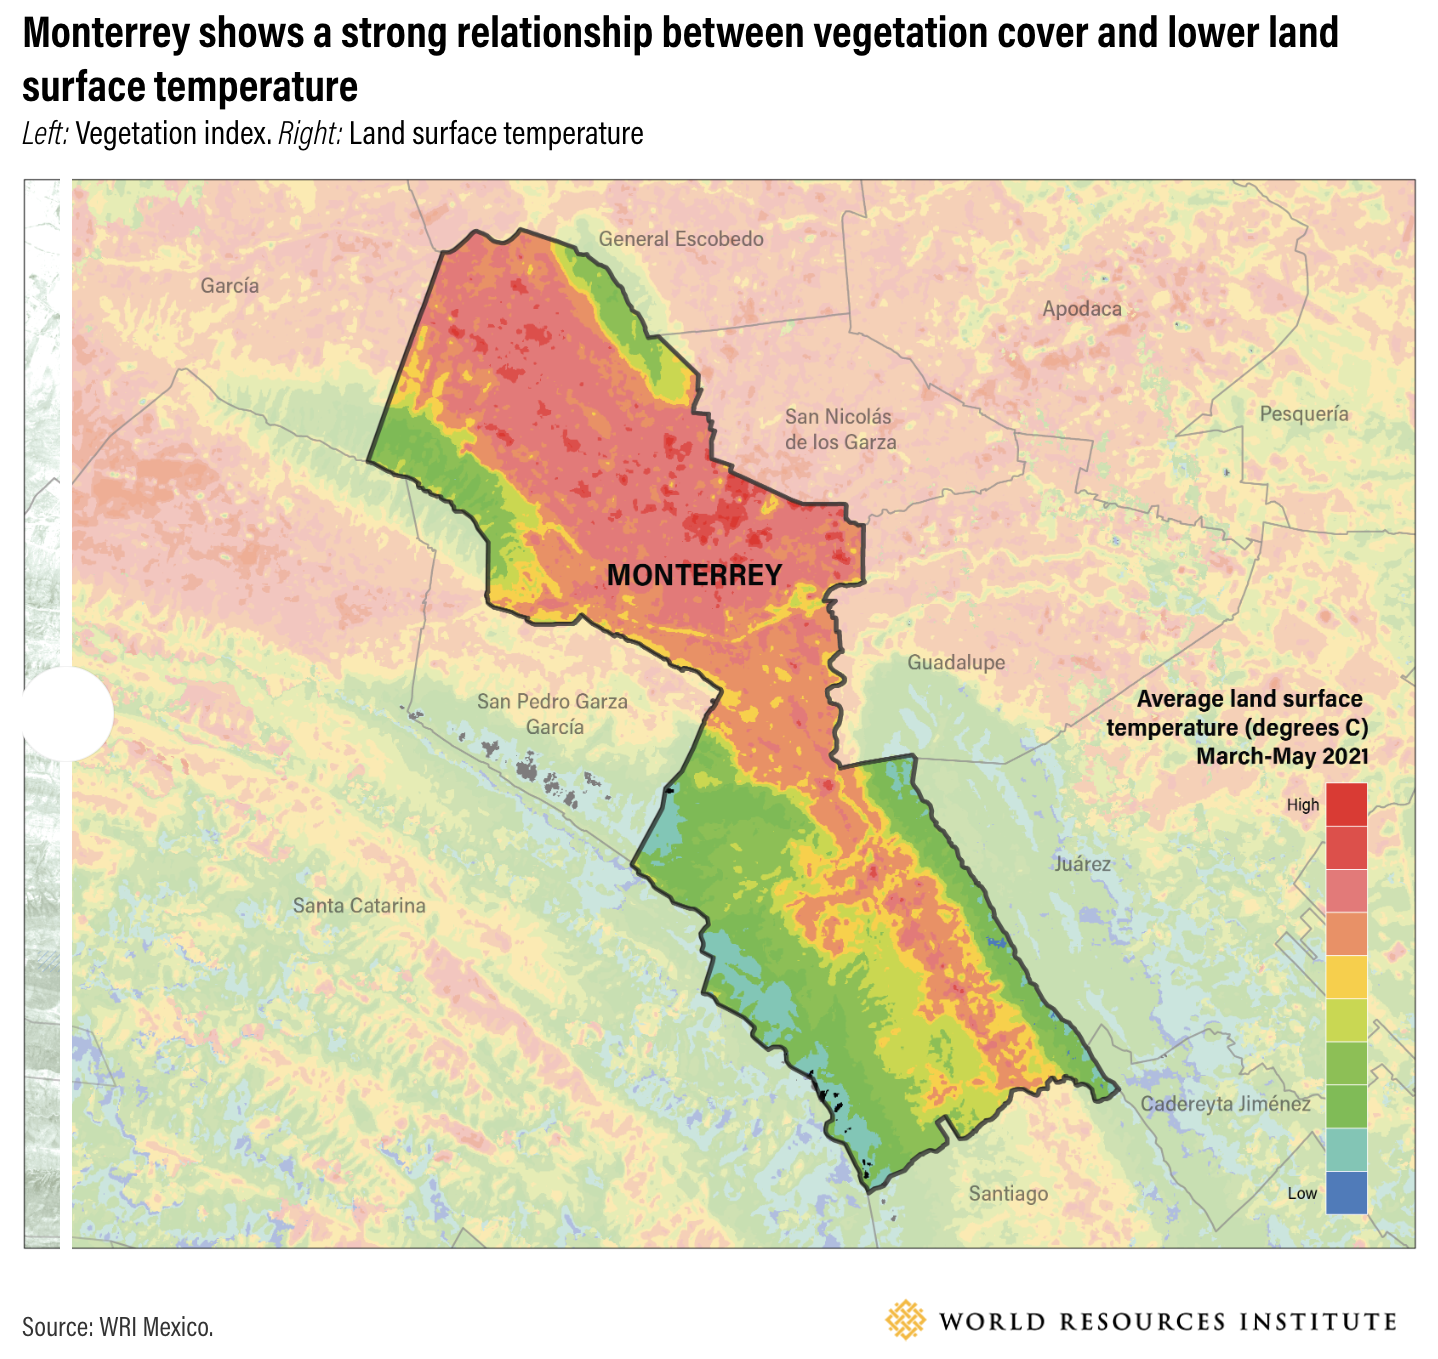
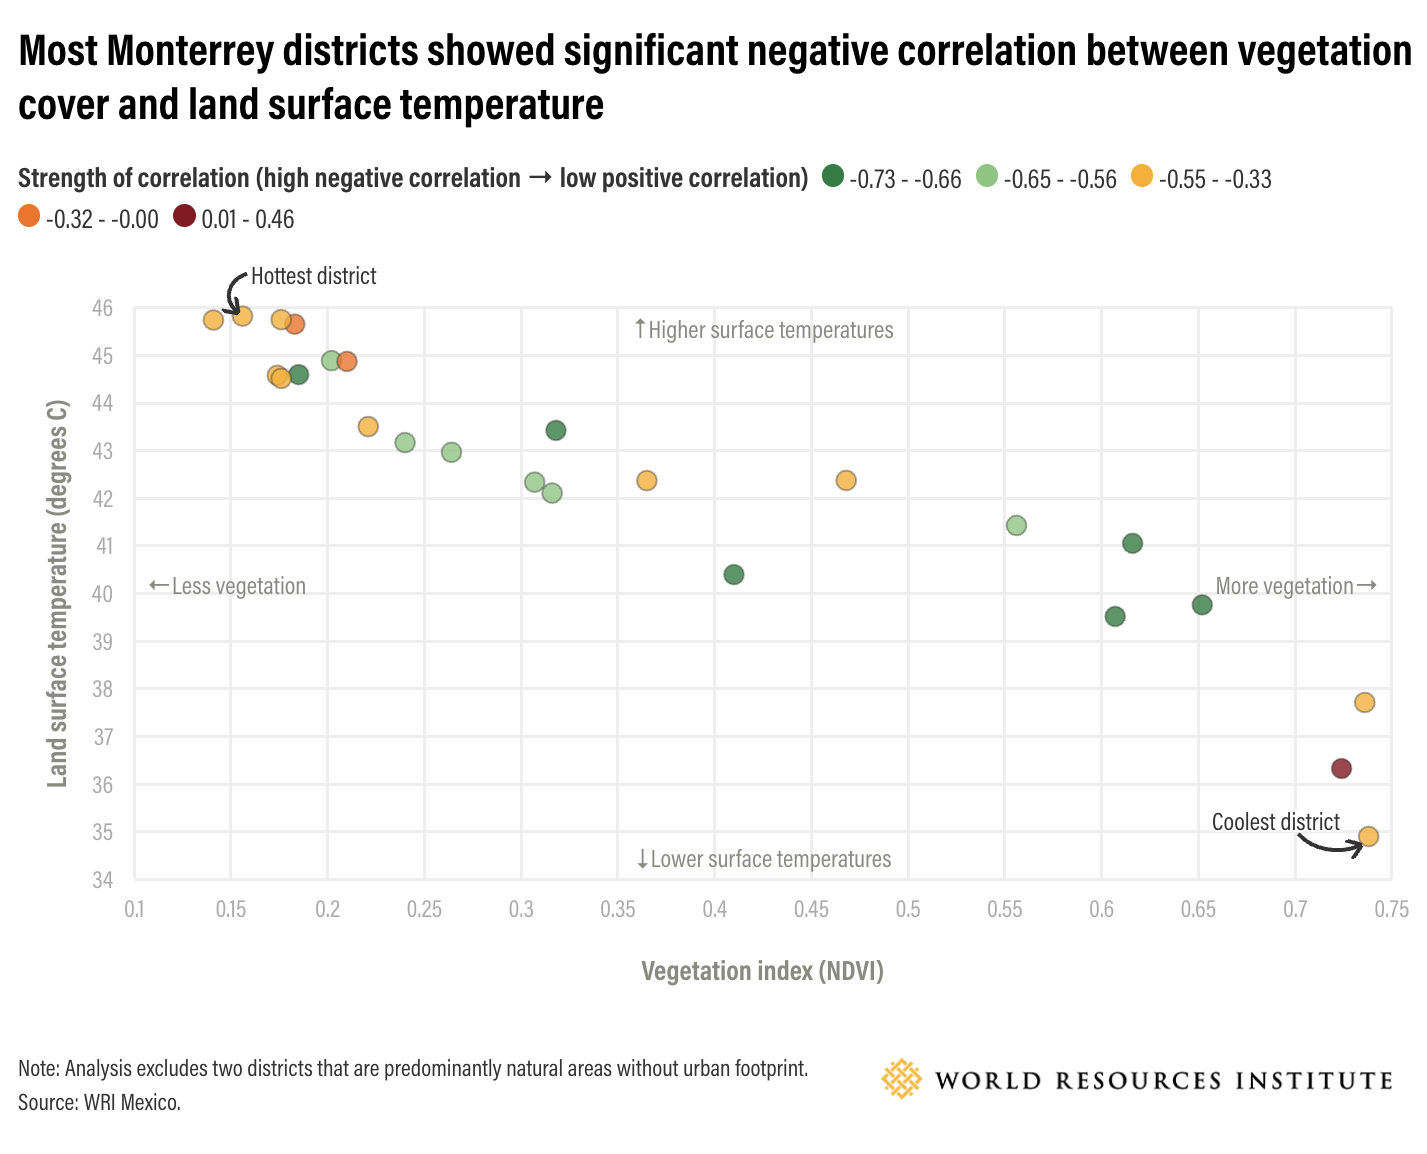
In Monterrey, WRI Mexico found that the relationship between greater vegetation cover and lower land surface temperatures had very high statistical confidence in 22 out of 27 districts of the municipality.
The findings also show that land surface temperatures vary greatly between districts, with an 11 degrees Celsius (20 degrees Fahrenheit) range of temperatures. The range is still more than 6 degrees Celsius (11 degrees Fahrenheit) even if only considering districts that are mostly urban.
Variations on the pattern repeats itself in cities around the world. Infrastructure, particularly vegetation and built surface types, are critical contributors to the accumulation of heat, how it is experienced by city residents and which residents experience the worst effects.
City Infrastructure as a Cooling Solution
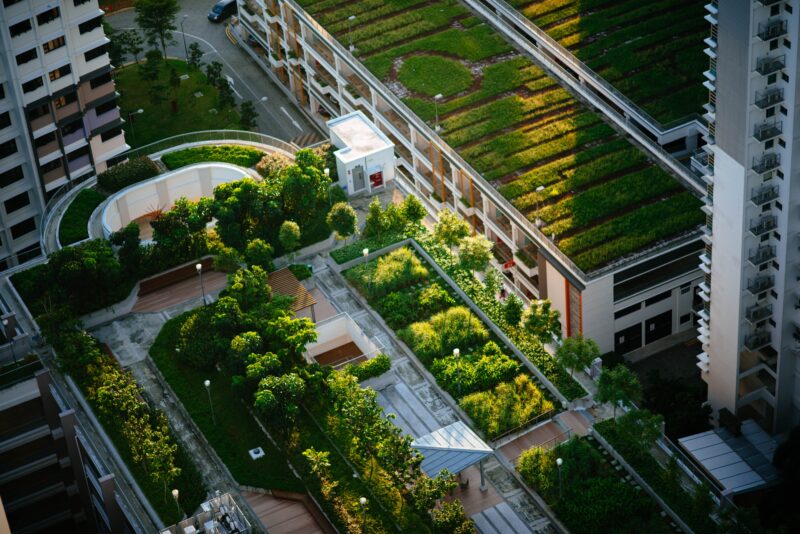
Rooftop gardens are one way to mitigate urban heat. Photo by CHUTTERSNAP on Unsplash
But just as urban infrastructure choices have created areas ripe for extreme heat, the same choices can create neighborhoods and whole cities that are cooler.
Cool infrastructure, both natural and built, can reduce city air temperatures by 3 degrees to 4 degrees Celsius (5 degrees to 7 degrees Fahrenheit). Vegetation, particularly trees, cools through evapotranspiration (releasing water into the air) and providing shade. Solar-reflective built infrastructure, most notably solar-reflective materials used on roofs, streets, walls and other built surfaces, send heat back into the atmosphere rather than letting it accumulate at ground level.
Cool infrastructure options are increasingly seen as strategies to address extreme heat. In particular, a growing number of cities are strategically investing in trees, green corridors and other nature-based solutions, as well as solar-reflective roofs to help reduce the urban heat island effect and the impacts of extreme heat.
In Kochi, India, the city has implemented a tree planting campaign to reduce heat in vulnerable neighborhoods, informed by community knowledge and geospatial data.
In Medellin, Colombia, the city has planted over 8,000 trees to create an interconnected network of green spaces across the city to address heat while improved access to nature and improve biodiversity. City officials estimate that after three years of implementation, the urban heat island effect in the Medellin has been decreased by 2 degrees Celsius (3.6 degrees Fahrenheit)
In Ahmedabad, India, the city together with non-government organizations have developed climate adaptation solutions, including painting white the roofs of 17,000 homes to reduce heat accumulation, to support women living in slum communities.
These cool infrastructure changes provide a myriad of benefits with very low costs, use technologies that are already available around the world, and do not exacerbate climate change (as distinct from mechanized cooling interventions, like air conditioning).
They also provide many co-benefits to help address climate change. By increasing the share of solar radiation that is reflected into the atmosphere and reducing energy demand required for space cooling, cities can ultimately reduce their greenhouse gas emissions. Adaptation gains are provided by reducing local temperatures, thereby decreasing heat stress, heat stroke and other heat-related health conditions.
Many other economic, equity and environmental benefits of cool infrastructure have been documented, including reduced energy consumption and peak electricity demand, improved worker productivity, more equitable access to green spaces, improved physical and mental health, and improved air and water quality.
From Information to Action on Urban Cooling
Cool infrastructure solutions have been piloted in hundreds of cities around the world, but there are thousands of cities that can and should adopt these tactics at large scale. However, it’s difficult for communities to plan, fund, deploy and track these solutions. A key barrier is actionable data.
Cities and businesses are seeking ways to set targets, prioritize investments and meaningfully measure progress. Without these tools, adoption of projects and policies will remain too slow to save lives. Absent data, investments can’t be selected and sited to maximize cost-effectiveness. Changes in urban surfaces are not being measured with methods that are repeatable, scalable and broadly accepted, stifling finance of these solutions, which relies in part on these metrics.
Efforts like the Smart Surfaces Coalition, Arsht-Rockefeller Resilience Center, Cool Cities Network, WRI projects including Data for Cool Cities and Cities4Forests, and others are aiming to address this need by generating local data on heat risk, getting it into the hands of policymakers and informing them about the impacts of their infrastructure choices. The hope is that new data used to power analytical tools that meet the needs of decision-makers can accelerate the adoption of and funding for cool infrastructure to help residents adapt to more extreme heat while bringing emissions down in time to avert even hotter temperatures.
Courtesy of World Resource Institute. By Eric Mackres, Gorka Zubicaray and Bina Shetty
Interactive versions of charts and maps above are available on the WRI article.
Featured photo by Jason Wong on Unsplash
I don’t like paywalls. You don’t like paywalls. Who likes paywalls? Here at CleanTechnica, we implemented a limited paywall for a while, but it always felt wrong — and it was always tough to decide what we should put behind there. In theory, your most exclusive and best content goes behind a paywall. But then fewer people read it! We just don’t like paywalls, and so we’ve decided to ditch ours. Unfortunately, the media business is still a tough, cut-throat business with tiny margins. It’s a never-ending Olympic challenge to stay above water or even perhaps — gasp — grow. So …

