 From comments made in my articles in past months, Gold had formed a key bottom back in mid-February – and with that was projected higher into mid-April of this year, or later. From there, a correction was favored to play out into the late-May to early-June window, where the next bottom of significance is now due to form.
Gold’s Dominant 72-Day Cycle
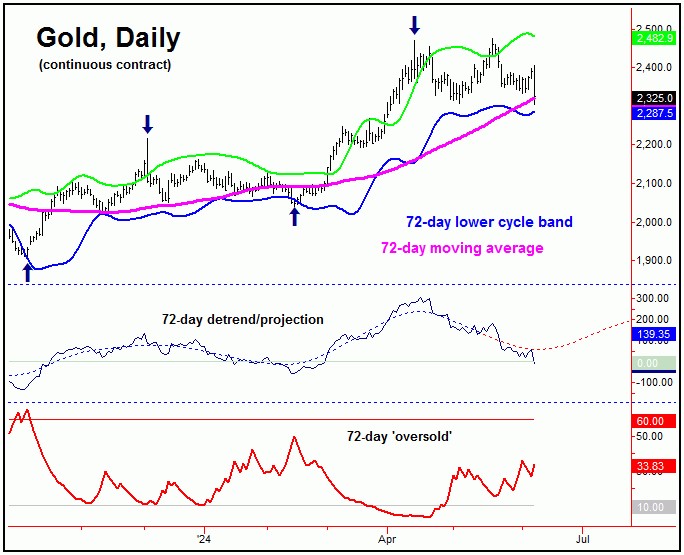
The 72-day cycle is currently the most dominant cycle in the Gold market. This wave saw a mid-February bottom giving way to a sharp rally – one that was not projected to peak prior to April 9th of this year.
Shown again is that 72-day cycle component:
Following a peak on April 12th, the downward phase of this 72-day cycle began to assert itself, with the metal dropping some 6.6% into early-May. From there, however, a push back to a minor new high was seen into May 27th – though that rally was not able to take out the April peak on a closing basis.
With the above said and noted, our overall assessment remained intact, which called for a 72-day bottom made into the late-May to early-June window, though this window could extend slightly, from the original (time) projections.
Price Considerations
From my 5/26/24 article: “with price, we normally expect to see a drop back to the lower 72-day cycle band as this wave bottoms out – something that has been seen prior to 85-90% of the lows for this particular wave. In terms of time, this 72-day cycle is still projecting a bottom in the coming weeks, and with that – until proven otherwise – we would like to see additional weakness playing out, then to be on the lookout for technical signs of a bottom forming.”
In terms of price, the ideal path favored a correction back to the 72-day moving average or lower, seen 90% of the time before our 72-day cycle normally bottoms.
With the above, Friday’s action has now dropped Gold back to its 72-day moving average. Having said that, Friday’s sharp decline seems to favor additional weakness into the new week, with the next logical magnet being the lower 72-day cycle band – something which also tends to be hit prior to 72-day lows.
Going further with the above, we are close to triggering a new upside ‘reversal point’ for this 72-day wave. This reversal point figure will be an exact price number for Gold, which – when taken out to the upside – will confirm the next upward phase of this 72-day cycle to be back in force, with precise details in our thrice-weekly Gold Wave Trader report.
The above is key, as the average rallies with this 72-day wave – when forming the pattern of a ‘higher-low’ – have been in the range of 10-14% or more. This gives us some idea of the potential upside, once this cycle does bottom.
The Mid-Term Picture
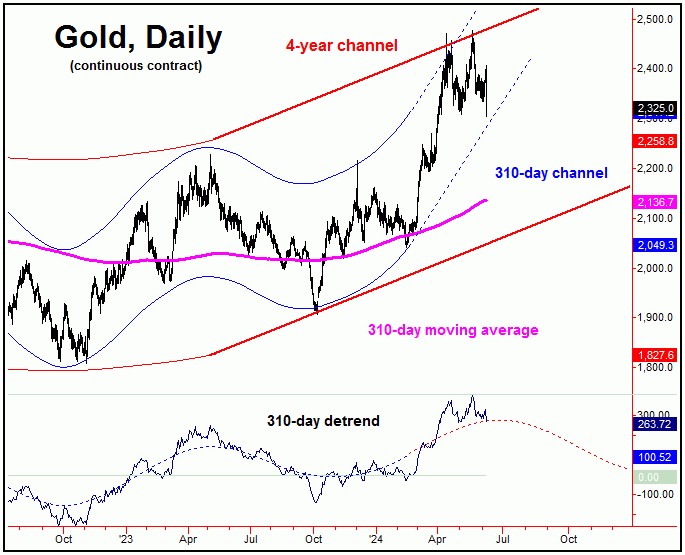
For the mid-term view, the larger upward phase seen since October, 2023 has come from our 310-day cycle – as well as the even-larger four-year wave – with the smaller 310-day component shown again on the chart below:
As originally mentioned back in the Autumn of last year, the last mid-term low was expected to come from this 310-day wave. The upward phase of this cycle was confirmed to be back in force back in late-October of 2023, thus confirming a 20-25% rally to be in force – projected to last into the Spring/Summer of this year.
With the above said and noted, a low that forms with our 72-day wave – if seen as outlined – should give way to a sharp rally into mid-Summer of this year. In turn, that rally will eventually peak the larger 310-day cycle, for what is anticipated to be a bigger percentage decline into the late-2024 to early-2025 window.
Until proven otherwise the next correction phase of our 310-day cycle is favored to end up as countertrend. With that, a late-2024 to early-2025 bottom with this cycle – if seen as noted – should give way to another sharp rally into what (tentatively) looks to be next Summer, before topping the next larger cycle, the four-year component.
The Four-Year Cycle in Gold
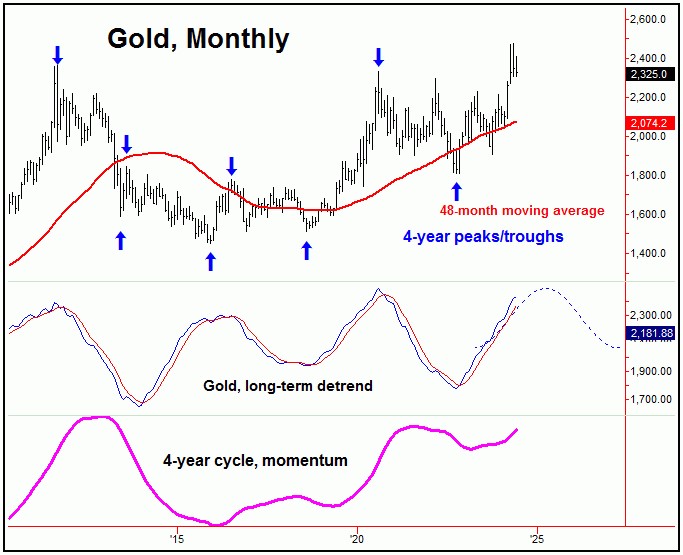
Our largest-tracked cycle for the Gold market is the four-year wave, which last bottomed back in October, 2022.
Here again is that four-year cycle in Gold:
As mentioned above, with the position of this four-year cycle (i.e., higher into mid-to-late 2025), the next correction phase of the smaller 310-day component is expected to end up as countertrend. If correct, what follows should be a push back to higher highs into the Summer of next year (or later) before topping this larger-degree wave.
In terms of price, we recently confirmed an upside target for this four-year cycle, giving us a precise level that we expect to reach going forward – with the exact details of this target posted in our Gold Wave Trader market report.
For the longer-term outlook, once this four-year wave tops in Gold, we would expect to see a sharp decline – something in the range of 20-30% off the top, likely playing out into the late-2026 timeframe. Having said that, it is too early to speculate too much in regards to this four-year cycle, though we should know more as we get closer to next Summer.
Jim Curry
The Gold Wave Trader
Market Turns Advisory
http://goldwavetrader.com/
http://cyclewave.homestead.com/
*********


