
Author Leonard Herchen & Yuchen Wang
Overview
The last quarter has seen relatively stable prices for oil and gas. Oil has moved modestly higher against short term expectations, and gas has showed short term weakness.
Investment optimism in the Canadian energy sector appears to be rallying around imminent completion of new ex-basin pipelines, and the growing realization that the demand for energy encompasses all energy, petroleum and new low carbon sources. Demand growth for petroleum products worldwide appears relentless The current oil price lives in the happy space where producers are very profitable and consumers feel they still get value. Natural gas, less so.
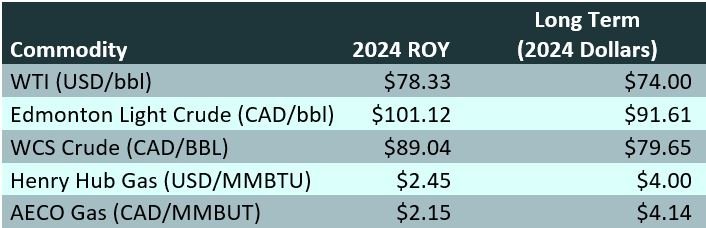
GLJ has made no significant changes to our long term expected nominal oil and gas prices for key benchmarks. This implies no change in our long-term real oil price to USD $74.00/bbl in 2024 dollars for WTI. We have maintained our long-term real price of Henry Hub to $4.00/MMBtu in 2024 dollars.
Given the relative stability in the quarter, GLJ’s analysts have decided to discuss long term prices, instead of commentary of the normal to and fro of quarterly price signals.
Long Term Price Outlook
GLJ uses a fixed long term real price for its commodity price forecasts. Adjusting only for an assumed inflation rate. The choice of long term benchmark prices strongly affects assigned reserves on producing and undeveloped locations due to economic limit considerations. As GLJ’s price forecast is used extensively in reserves analysis worldwide, we need to consider that price carefully.
Julian Simon, one of our all-time favourite economists, argued that the amount of a resource is infinite in an economic sense. In the late 70s and early 80s, Simon made the bold claim that the real price of a commodity should be relatively constant over time. In fact, with technological advance, the long term real price of a commodity may fall.
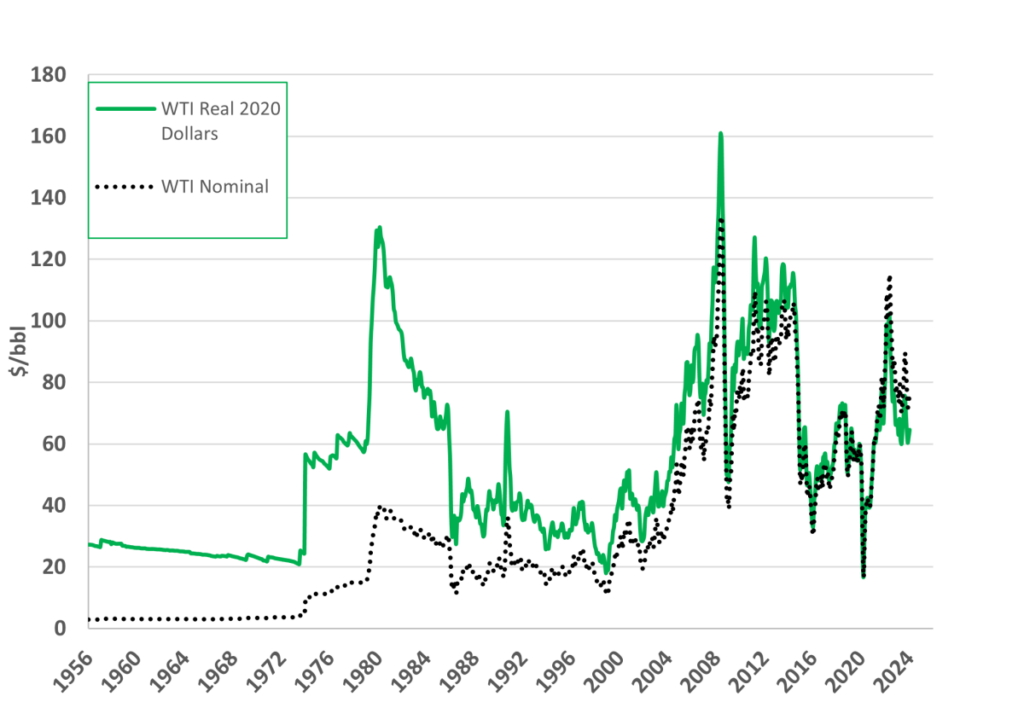
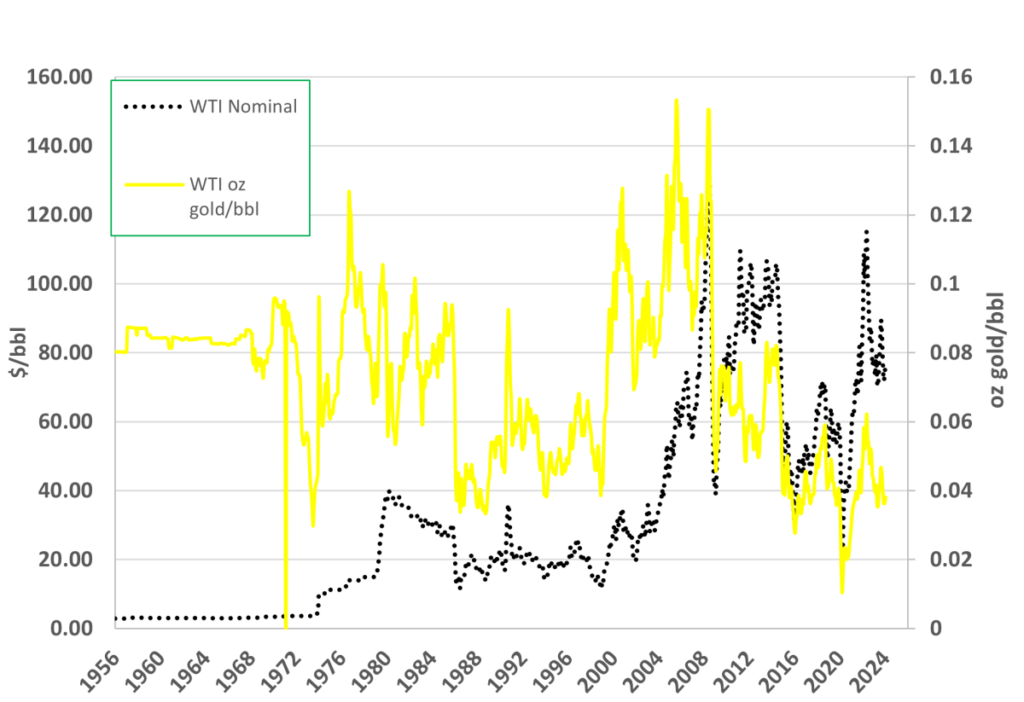
This thesis can be tested by examining the price of oil deflated by CPI over long periods, or comparing the nominal price to the price of gold. The figures below show the price of WTI over 70 years in 2020 dollars, and in ounces of gold per bbl of oil.
WTI Price Deflated by USA-CPI
The effect of inflation on oil prices over decades of time is strongly visible.
WTI Price Deflated by Gold Price
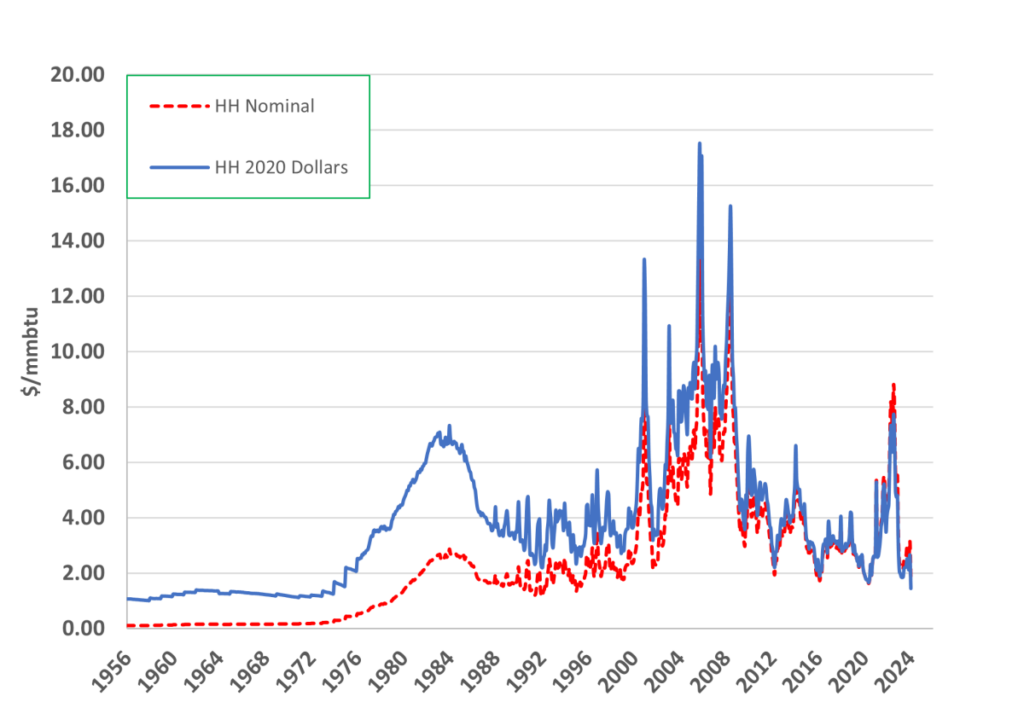
Similarly, natural gas prices show how technological advancement has made natural gas as affordable now as it has been in 50 years.
Hence the phrase, “the cure for high/low gas prices is high/low gas prices”.
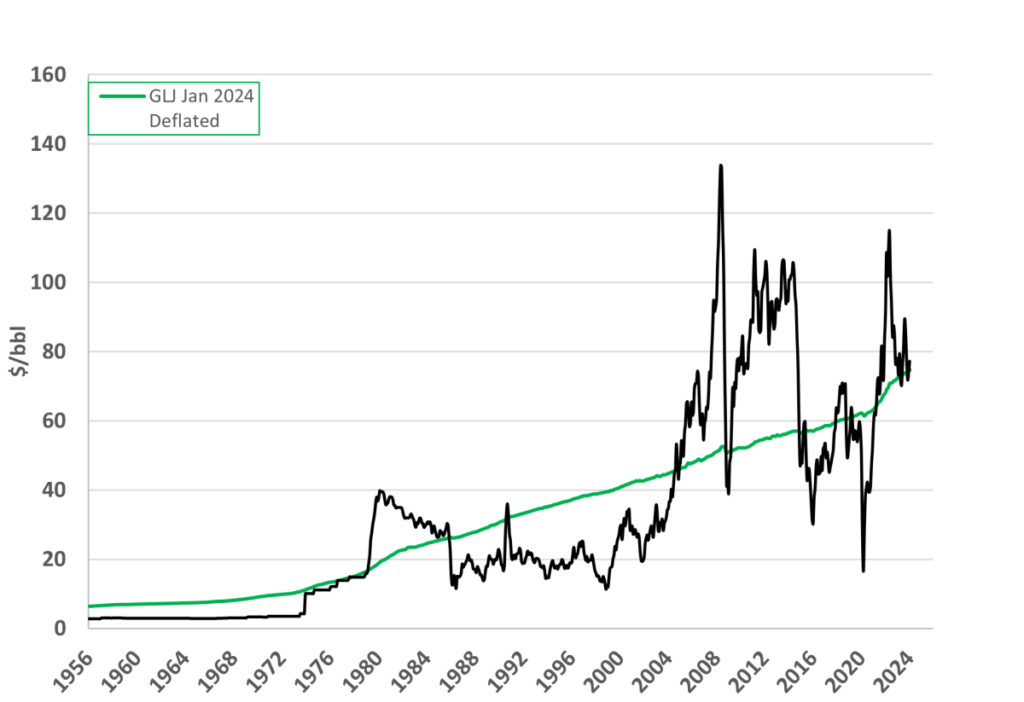
A simple way to test the validity of a long term price forecast is to deflate it into the past and compare to actual historical prices. The figure below does just that for oil.
As claimed by Mr. Simon, almost all the growth in long term average oil prices in the last 80 years can be associated with monetary factors.
WTI 74 USD Deflated into the Past
Natural Gas Prices
Natural gas prices generally moved downward in the last quarter, reflecting weather and overall global surpluses.
Oil Prices
Oil prices increased and have exceeded 80 dollars per bbl. WCS differentials narrowed by the end of the first quarter. Perhaps due to the normal seasonal variation, or possibly response to Trans Mountain line fill demand.
Inflation and Exchange Rates
Exchange rates moved around expected ranges in the last quarter. US CPI has proven especially resistant to move below 3%.
GLJ’s forecast values for key benchmarks is as follows:
Share This:


