Sign up for daily news updates from CleanTechnica on email. Or follow us on Google News!
Between 70% and 90% of Americans support using wind energy. One study that examined decades of national popular acceptance of wind energy makes that claim. However, local opposition to wind-generating projects can occasionally (or often) impede them, partly due to people’s perceptions of turbines once they are coming near. Over the past fifty years, not much has changed regarding that resistance. Yet, some, such as NREL’s Anthony Lopez, are working to change this and offer a new contextualization of a shared communal landscape — with a fresh “lens.”
“Visual concerns are among the top reasons people are opposed to wind projects,” said Mike Gleason, a geospatial data scientist at the National Renewable Energy Laboratory (NREL), who led a first-of-its-kind study examining the visual impacts wind power has at the national scale.

“We are trying to look at the different aspects of wind deployment and contextualize those in a manner that means something to people.”
Currently, land-based wind generates around 10% of all electricity in the United States, or more than 150 gigawatts. Although there is a sizable and expanding fleet of wind turbines, their visual effects on land area, population, and sensitive visual resources are comparatively minimal.
“We’re examining the overall impact that wind turbines have on the landscape, specifically the scale of visual change they introduce,” Gleason said. “This study aims to provide a broad context for these discussions, offering an objective perspective to better inform some of the narratives that may exist.”
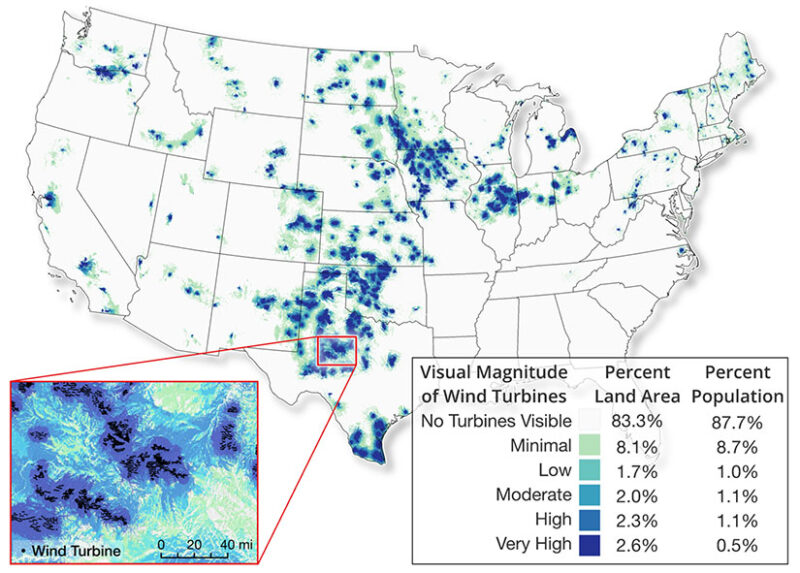
By adapting techniques from two previous, smaller-scale visual effect assessment studies to a comprehensive geographic information systems (GIS) dataset of about 70,000 land-based wind turbines in the contiguous United States, the team used an innovative method in their study. In the end, the information contributed to the development of a high-resolution map showing the entire visual magnitude of the present turbine fleet in the United States.
Below, NREL’s visual impact assessment is used to create a map that displays visual impact ratings throughout the contiguous United States (CONUS). The assessment’s excellent spatial resolution is demonstrated in Inset A. The percentage of the CONUS land area and daytime population in each visual impact category is summarized in the table in the lower right corner.

NREL’s team divided its examination of the turbine fleet into 3 main steps:
- First, they modeled the total visual magnitude — the proportional amount of space something may take up in someone’s field of vision—of impacts from installed wind turbines using 3D simulations and GIS tools.
- Second, they took those methods and applied them to the existing land-based turbine fleet of the contiguous United States.
- And third, they examined how the visual impacts of turbines are geographically distributed relative to key environmental and human factors.
“What we found is that turbines are technically visible for only 12% of the population, which is proportional to the contribution of wind energy to the grid,” said NREL geospatial data scientist Marie Rivers. “But most of those impacts are minimal or low, and I think that’s a positive story for wind energy development because it suggests that to some degree that while more turbines may be installed on more land, the population and scenic resources may not be impacted by them as much.”
“The results suggest that people’s perceptions of the visual impacts may be exaggerated relative to how we were able to quantify them,” Gleason said. The report clears up a lot of misperceptions about wind energy.
A small percentage of land area, people, and sensitive visual resources are impacted by wind energy development in the contiguous United States, despite turbines being visible in many places across the country. The highest visual impact from existing turbines is geographically concentrated in deserts and plains. Although increased density of wind development consistently leads to visual impacts across a greater proportion of land, it does not always lead to impacts on a greater share of the population.
A higher density of wind development does not necessarily result in effects on a larger percentage of the population. Even though wind turbines can be seen in many locations throughout the continental United States, wind energy production only affects a small portion of the land area, population, and sensitive visual resources. The areas with the greatest visual impact from current turbines are plains and deserts
The vast majority of land in the contiguous United States — roughly 93% — falls into the three lowest categories in terms of visual effect.
“This research really helps inform some of the social sciences and gets them off and running quicker to understand the impacts to local communities,” Lopez said. “I also hope that this type of work helps further the discussions around what an energy future with wind as a main electricity generator could mean for people.
“Some of the questions the study could help researchers examine next include subjects like the evolution of wind turbines: What could happen as they get taller but may be spaced further apart? How could that potentially change the patterns in visual impact?
“The study also gives future researchers a platform to dive deeper into why certain regions around the country may have had higher or lower visual impacts than expected.”
“As we model future decarbonization scenarios, this study gives us more tools in our tool bag to explain what changes to the landscape could look like and how they compare to the current landscape,” Gleason said.
To that end, the team has released the software developed and used in the study under an open-source license, meaning it is publicly available for other entities to use for further research or commercial applications.

Chip in a few dollars a month to help support independent cleantech coverage that helps to accelerate the cleantech revolution!
Have a tip for CleanTechnica? Want to advertise? Want to suggest a guest for our CleanTech Talk podcast? Contact us here.
Sign up for our daily newsletter for 15 new cleantech stories a day. Or sign up for our weekly one if daily is too frequent.
CleanTechnica uses affiliate links. See our policy here.
CleanTechnica’s Comment Policy


