Both gold and silver are in the process of breaking out of bull flag patterns, which indicate sharp gains in the near future. Here’s what you need to know…
Gold and silver had an impressive day, with gold rising 1.18% to a record high of $2,775 and silver climbing 2.33% to close at $34.46. Yesterday’s strong performance in precious metals has triggered a significant new bullish signal, prompting this timely update.
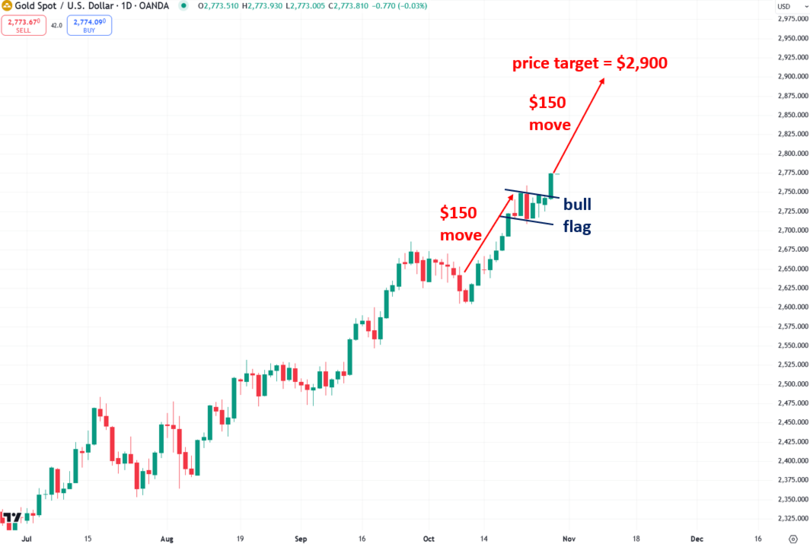
As I pointed out recently, gold had been forming a chart pattern known as a “bull flag,” which is a continuation pattern that suggests further gains once gold breaks out on strong volume.
Following yesterday’s strong upward move, gold has broken out of its bull flag pattern, indicating that further gains are likely ahead.
Using a concept called the ‘measured move,’ we can project the potential price target for gold’s rise after this breakout. In a measured move, the price is expected to climb by the same number of points as the initial rally that preceded the consolidation.
Applying this logic, gold should increase by an additional $150 in this leg, reaching approximately $2,900. Based on the previous move, this target may be reached within a little over a week.
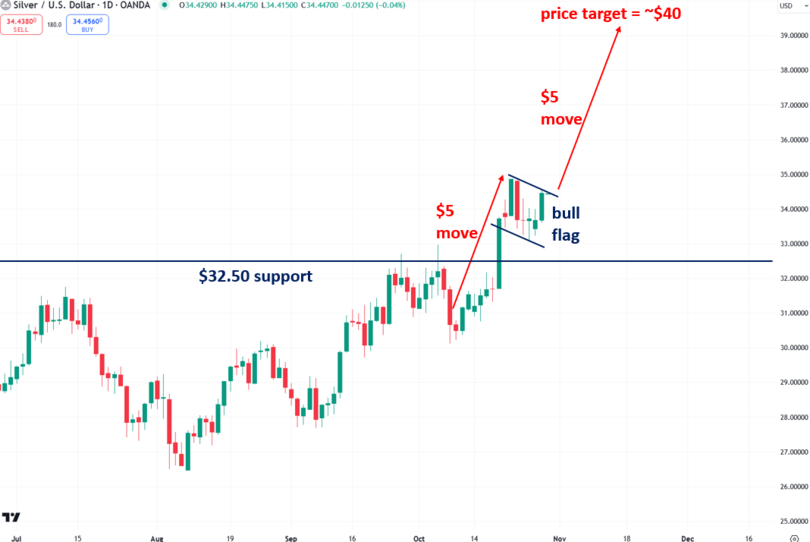
Similar to gold, silver has also developed a bull flag pattern, though it hasn’t broken out yet—but I expect it will soon.
The initial move into the pattern was $5, suggesting a post-breakout rally of the same magnitude, targeting approximately $40. This also makes sense because $40 is a key psychological level, and such levels tend to draw prices to them like a magnet.
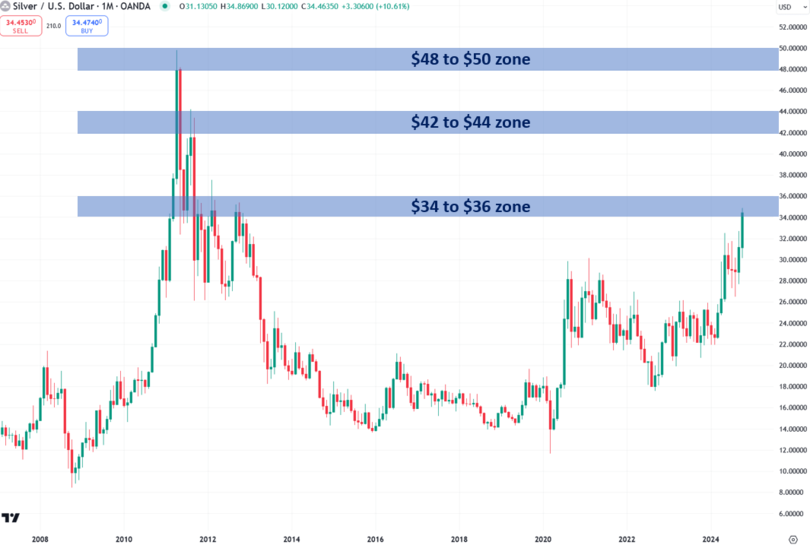
Since silver broke above its key $32.50 level, I have been watching closely; I am now watching silver’s monthly chart to help identify potential resistance areas as the bull market unfolds. I analyze previous congestion zones to determine where silver might face temporary challenges.
Each zone acts like a hurdle that silver needs to overcome. Once it does, that level becomes a new floor, and we then focus on the next resistance level, continuing this pattern as the bull market progresses.
When silver breaks out of its flag pattern, it will surpass the $34–$36 resistance zone, a significant barrier that held firm through much of 2011. Once surpassed, the $34–$36 zone will become a new support level, offering added confidence for the bulls.
I believe silver is on the verge of a very powerful bull market that will likely take it to $50 and eventually much higher from there.
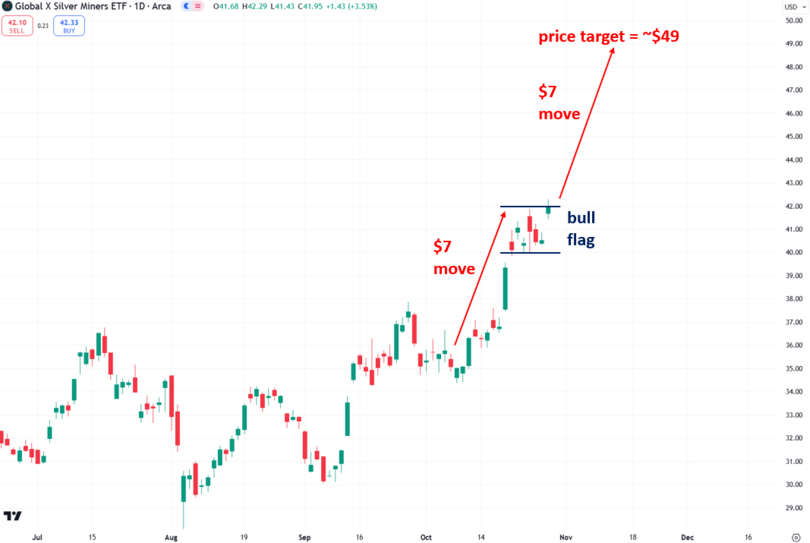
I watch silver mining stocks to confirm moves in the price of silver—particularly the popular Global X Silver Miners ETF (symbol: SIL). SIL, much like silver itself, has formed a bull flag pattern, indicating a projected price target of $49 upon breakout.
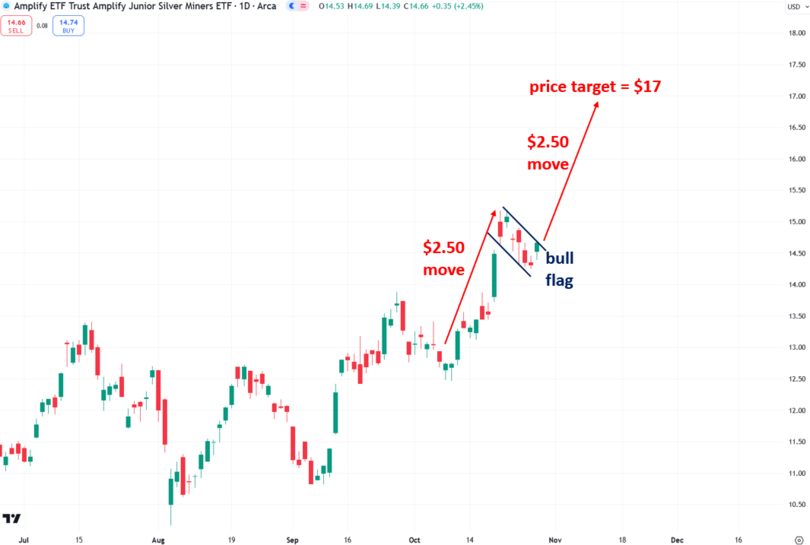
In addition to SIL, I monitor the Amplify Junior Silver Miners ETF (symbol: SILJ), which is the main proxy for junior silver mining shares.
I’m especially bullish on junior silver mining stocks and personally invest in them (a topic I’ll discuss in greater detail very soon). Similar to SIL and silver, SILJ has also formed a bull flag pattern, projecting a price target of $17 upon breakout.
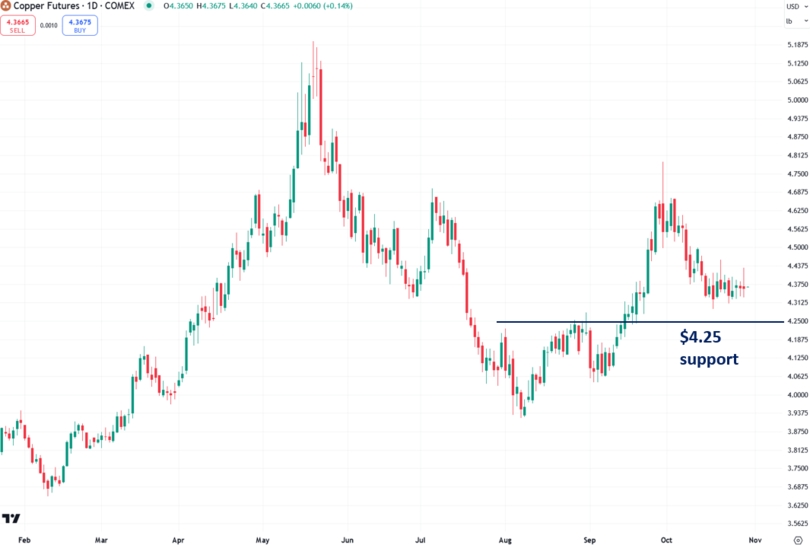
As I recently explained, I closely monitor copper to better ascertain silver’s potential moves due to their strong correlation. Bullish trends in copper generally signal strength in silver and vice versa.
Since early October, copper has pulled back, which has weighed on silver’s price. The good news is that there’s a strong likelihood copper will find support around the $4.25 level and rebound, which should provide silver with an additional boost.
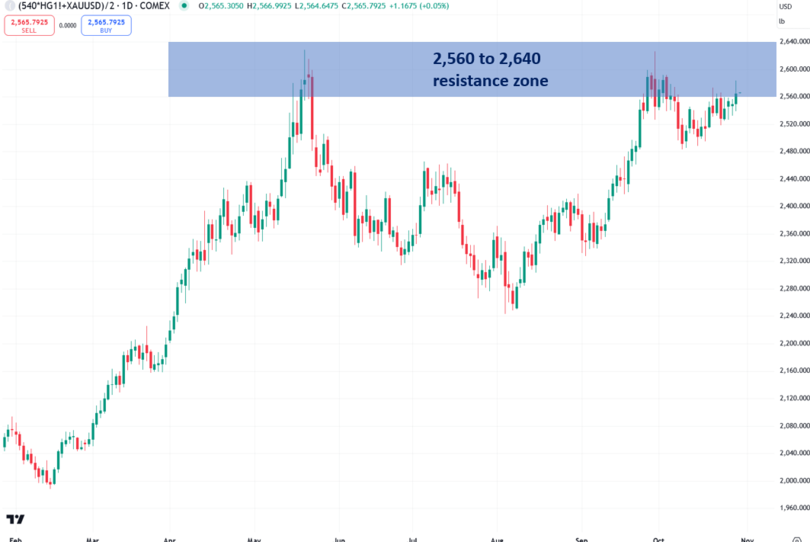
Building on the logic discussed above, I developed an index known as the Synthetic Silver Price Index (SSPI) to confirm silver’s price movements. This index calculates the average of gold and copper prices, adjusting copper by a factor of 540 to ensure that gold’s higher price doesn’t disproportionately impact the index.
Remarkably, the SSPI closely tracks silver’s price—even though silver itself isn’t an input! I’m watching for a decisive close above the SSPI’s key resistance zone, between 2,560 and 2,640, to issue an additional supplementary bullish signal for silver. Once that signal is given, there should be no looking back for silver.
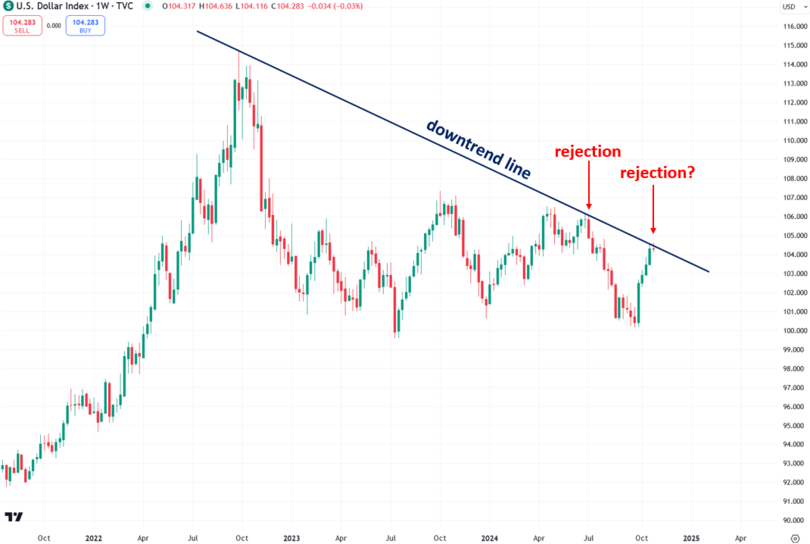
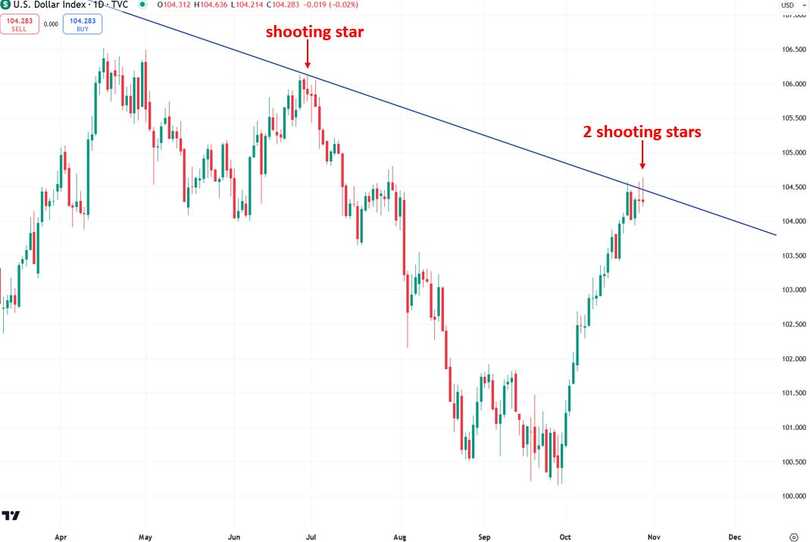
Since the beginning of October, the U.S. Dollar Index has experienced one of its sharpest rallies in recent memory, rising in 16 of the last 22 trading sessions. Precious metals generally have an inverse relationship with the dollar, so you’d expect them to drop sharply, given the dollar’s strength.
However, the fact that they’ve held steady is a strong indication of their resilience. There’s a strong possibility that the dollar’s rebound will soon encounter a pullback, especially if it struggles to break above the two-year downtrend line that is just overhead. Such a pullback in the dollar would be highly bullish for gold, silver, copper, and other commodities.
A closer look at the U.S. Dollar Index’s chart reveals two shooting star candlesticks, indicating that the index has attempted—and failed—twice to break above the downtrend line. These candlesticks often precede bearish moves.
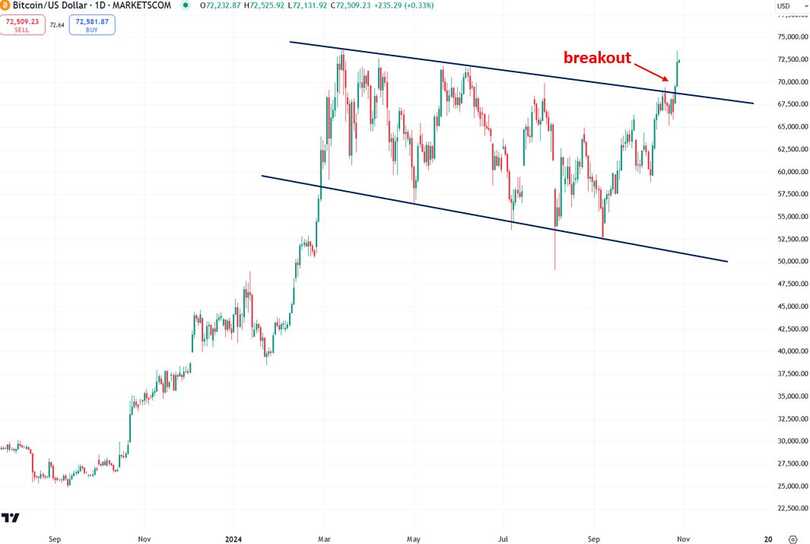
Interestingly, Bitcoin has finally broken out of a consolidation pattern that’s been forming since March, signaling a potential rise to $100,000 or higher.
This breakout is noteworthy because gold, silver, and Bitcoin often rally for similar reasons—rising liquidity and increasing investor interest in alternative assets—essentially reinforcing each other’s bullish outlook.
In conclusion, the outlook for precious metals remains strongly bullish, with both gold and silver positioned for substantial gains as they break out of critical chart patterns. Gold’s bull flag breakout projects a potential rise to $2,900, while silver is set to target $40 once it breaks out.
In addition, silver mining stocks, copper, and the U.S. Dollar Index add layers of confirmation to this bullish outlook. The potential for a dollar pullback and copper’s anticipated rebound could further support higher prices in gold and silver, bolstered by rising investor demand for alternative assets, including Bitcoin.
Given these dynamics, the precious metals landscape looks particularly promising for continued upward momentum in the weeks and months ahead.
********

