Sign up for daily news updates from CleanTechnica on email. Or follow us on Google News!
Currently, hurricanes severity is measured by either the Saffir-Simpson scale or the Accumulated Cyclone Energy scale. Neither of them really was adequate in the massive 2017 Atlantic hurricane season, in the years since or in this years devastating season. Let’s explore why.
Note: I published a version of this article on Medium in 2017, and am republishing with slight edits here. Where my methods appear unsound in retrospect, I’ll make a note.
First, let’s look at all of the factors a better model would have to have in order to help people understand their risk and to be useful in disaster preparedness. Then we’ll actually build a model with these factors and compare them to some historic hurricanes.
To be transparent, I’m building an inadequate model from scratch knowing it will be inadequate. It’s a useful thought exercise nonetheless and will assist in assessing other hurricane models that are in existence. Part of my process is often wastefully but enjoyably spending mental cycles doing things from first principles, then comparing to other material by my betters to figure out where I get things wrong. I learn more this way and satisfy my nerdier impulses. (As a note, comparing to work by their betters is why so many cranks go wrong. They never do that step and so remain convinced of their brilliance and insights, as opposed to usefully humbled.)
A useful measure would provide a risk rating based on wind velocity, size of hurricane, storm surge, wave height and likely volumes of rain due to water vapor in the storm. These factors are interrelated to a greater and lesser degrees, but each has unique risks. Size, surge and rain are higher impact so would be weighted higher. (Note: Weighting of a rating scale increases the noise in it and reduces its likelihood of giving useful results. For full details on this note, read Kahneman’s Noise. I’ll leave the weighting alone as it’s only a though exercise, not a proposed scale for anyone to take seriously.) The end system has to be relatively simple to explain, so I’ll stick to a 1–5 scale, but average out and round ratings.
The wind velocity would reasonably just use the Saffir-Simpson scale, as it was intelligently designed, is broadly used and wind damage above Category 5 is relatively indistinguishable from Category 5 damage. There are also atmospheric limits on wind velocity that make additional points unnecessary. (Note: Michael Mann has endorsed the 2023 Wehner & Kossin paper that asserts a Saffir-Simpson 6 rating is required as climate change has in fact made the winds stronger. Yikes.)
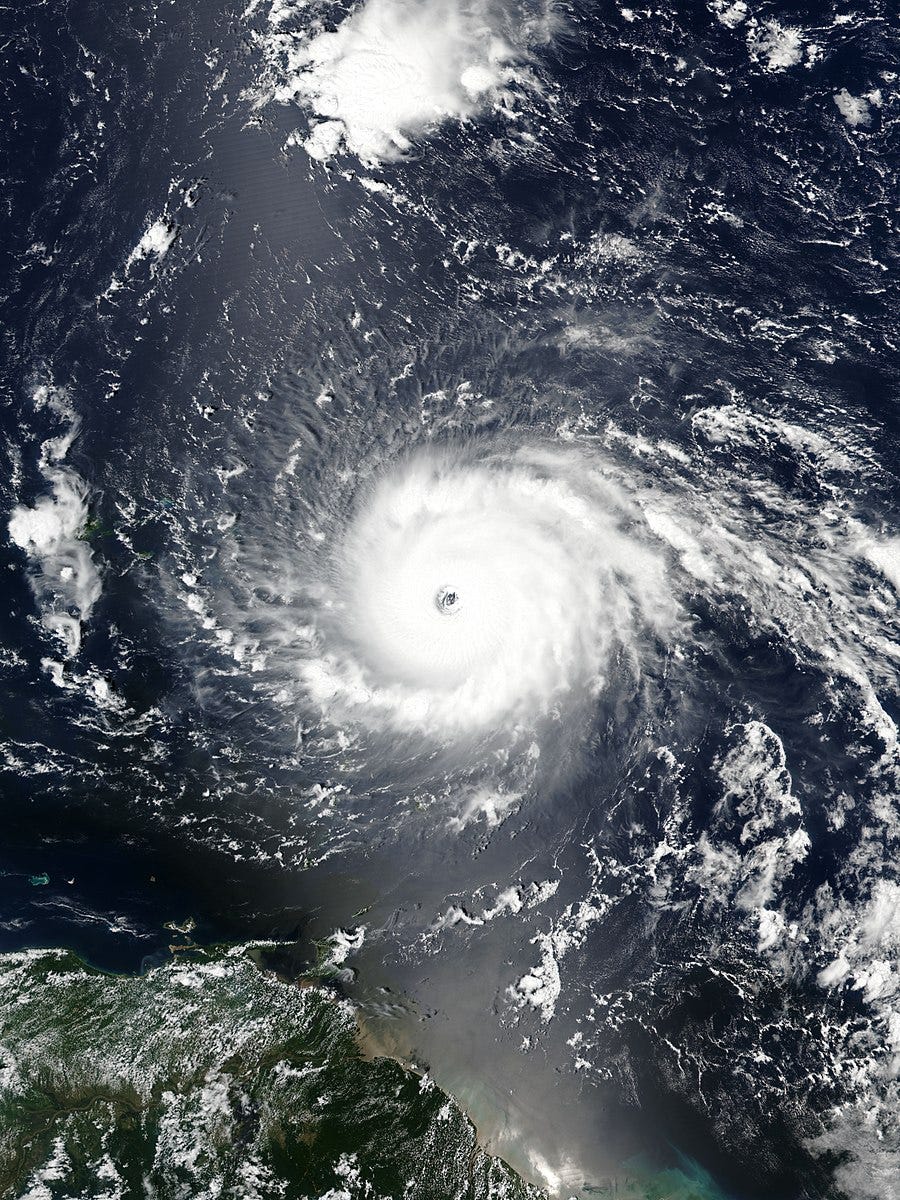
Size of the hurricane is important. The broader the storm’s breadth, the more areas it will cause damage to. Hurricane Sandy was low on the Saffir-Simpson scale but the largest hurricane ever to form in the Atlantic at 1,800 km and can be reasonable considered an upper boundary with Typhoon Tip at 1,100 km being another data point. Tropical Cyclone Marco was only 18.5 km so would constitute the lowest boundary. The larger the hurricane, the larger the storm surge and amount of water it can hold. Hurricane Helene was incredibly wide at 725 kilometers diameter of sustained hurricane force winds compared to the devastating 1900 Galveston hurricane that destroyed that small city by hitting it dead one with a much smaller diameter, 50 kilometer, storm. As I said recently in a discussion on the topic, hurricane diameter is an underreported factor.
Given the impact of this, I’m going to weight it double in the simple model. (Note: a note on weighting. Diameter not only causes impacts over a broader area but also impacts storm surge and rain fall, so by doubling the weighting, I’m likely causing noise and redundancy.)
Storm surge produces its own range of problems. It tends to be highest at the storm wall. Larger radius hurricanes tend to have higher storm surges, as do higher intensity hurricanes. But storm surges do their own level of damage. The highest ever recorded was 14.5 meters for Cyclone Mahina in Australia in 1899. Irma recorded 6 meter storm surges with Florida likely to see 4.6 meter surges when it lands. Storm surge is one of the most damaging aspects of hurricanes, so it will be weighted double as well. (Note: originally Saffir-Simpson included storm surge, but it was removed later as it muddied the waters for getting evacuees motivated to get out, something the simplicity of the scale assists with.)
Wave height is an element. Bigger waves are much more destructive than smaller waves and waves provide percussive damage that’s much different than the sustained storm surge damage. Wave height is additive to storm surge height as well. Hurricane Ivan generated 27 meter waves at sea. Hurricane Sandy, while low on the Saffir-Simpson scale generated 9 meter waves in New York Harbour.
The final component of our blended scale is the amount of rain likely to fall. Hurricane Harvey’s damage was dominantly from the rainfall. It didn’t have a high storm surge or hugely destructive waves or wind when it landed, it just sat there and dropped about 95 trillion liters of water on Houston and area. That’s been compared to three weeks worth of the Mississippi River.
Just as warmer water increases hurricane wind velocity, it also increases the amount of water vapor the hurricane sucks up only to drop down later. Due to high surface and and deeper water temperatures in the Gulf of Mexico, much more water vapor was available to fuel rain. The size of a storm also affects how much vapor can be sucked up by a storm. The bigger the diameter, the larger the amount of water vapor. Double the diameter, quadruple the available water.
Modern hurricanes have combined larger diameters and unusual tracks to amplify this problem. Hurricane Harvey stalled, half over the Gulf and half over land, turning into a conveyor belt for Gulf water to vapor to rainfall that persisted for an extended period of time. That was due to shifts in the Arctic jet stream attributed to climate change that locked the weather pattern in place. Hurricane Florence’s unusual track had it hit the Carolinas, then turn south instead of north and meander slowly along dropping Atlantic water on hog manure ponds and the like for days.
And rainfall is one of the more serious problems of hurricanes as it scales up to high volumes, as with storm surge and waves, rainfall has fewer places to go quickly. What storm surge and waves don’t flood, rainfall has a good chance of. Average hurricanes can unleash 9 trillion liters of water a day. This factor will be weighted double as well after Harvey. (Note: this is in part double counting diameter, hence the noise. The tip is not to use weighting on rating systems like this professionally.)
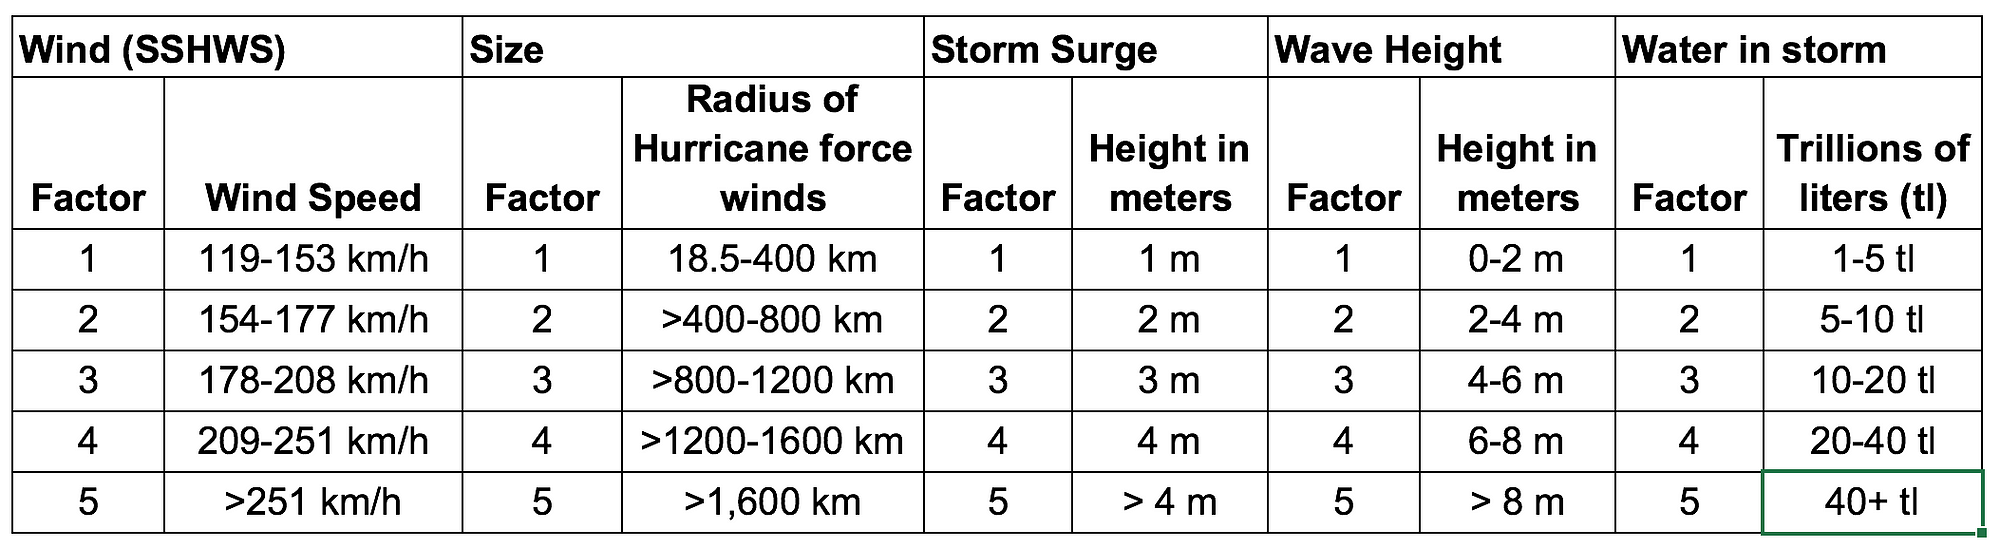
This gives a reference table that would look like this.
Running the numbers on some storms at their peaks using this approach as a first pass to test it gives the following results.
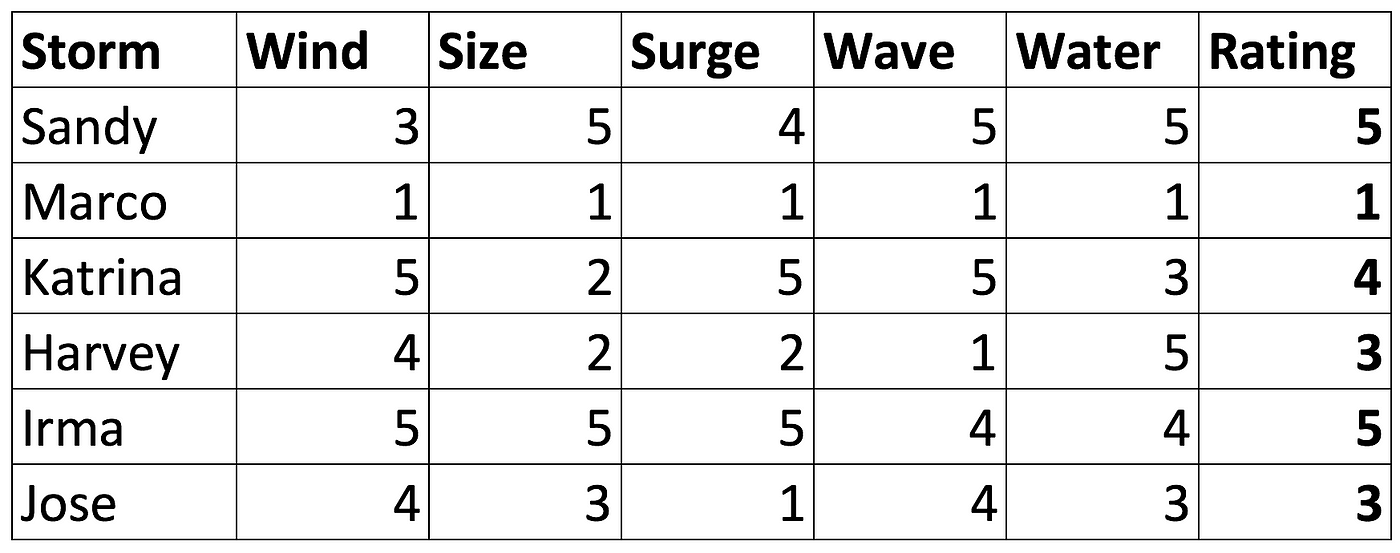
Assessing the results we see that Sandy is much more convincingly modeled as a high severity storm. This aligns strongly with the actual damage and is two-points above Sandy’s peak Saffir-Simpson rating. The model holds up so far.
Marco is in as a bottom-end data point and looks fine as far as it goes.
Katrina comes in at a rating of 4 as opposed to its peak Saffir-Simpson rating of 5. That’s still very high, but it was not as destructive as Sandy so it holds up. Inadequate preparation and response in New Orleans were as much the reason for Katrina’s destructiveness as Katrina’s scale and size. Katrina was a relatively small hurricane that scored a direct hit on New Orleans, so one way to think of this is that you really didn’t want to be underneath it regardless of its lower rating. This argues that this blended model is challenged simply because part of the value of ratings like this is to help motivate people to get out of the way.
Irma and Jose look very reasonable given what’s been observed. Irma is already one of the most destructive hurricanes to move through the Caribbean and will likely prove to be equal to Sandy or of greater cost when its all tallied up. Jose is a middling hurricane despite the wind speed, with a low surge especially reducing its likely destructiveness. Note that the water content of Jose wasn’t readily available, so it’s pegged at 3 for want of a better choice.
Finally, we get to the result which challenges the model’s usefulness. Harvey was rated a 3. A useful model would have had it rated at least as a four, at least as severe as Katrina, if not in the scale of Sandy or Irma. As the rainfall was the large problem with Harvey, I tested increasing the weight of water content of the hurricane to a factor of 3 and then 4 to see the results. Harvey didn’t budge from a rating of 3. The model is insensitive to peak damage categories which might be a better approach.
Note: As I look back on this, there’s one additional new factor which I hadn’t included in 2017, which was speed of development. Milton developed so quickly that a professional meteorologist broke down on tv in horror at its strength. Hurricanes are developing so quickly from Cat 1 to Cat 5 that there is increasingly a situation where there is no time to issue evacuation orders. It takes a couple of days to empty an impacted area out, and evacuation orders take time to arrive at. When a hurricane jumps from Cat 1 to Cat 5 in 18 hours, all emergency procedures are overturned. This will definitely impact loss of life, but it’s an exercise for the reader as to whether to include it in a better system.
Of course, there are other existing models which vary from the Saffir-Simpson model.
The Hurricane Severity Index does deal with size, but it’s still dominated by wind speed with no factors made for storm surge, rain or wave size. It’s quite likely that people who work and research in this space have concluded that size and intensity are all that are required to cover the other factors.
There’s also a new Cyclone Damage Potential Index which did more accurately predict that Harvey would be very severe, in the top 10% of storm impacts. It factors in how long destructive winds cover a specific area, which matches the lingering of Harvey over Houston, the factor which allowed Harvey to dump all of its trillions of litres of water in a single place. It still ignores water content, surge height and wave height.
It’s possible wave height at least is unnecessary in a model based on this but the inclusion of breadth of a hurricane in both indicates that part of my assessment is correct. The exclusion of both surge height and moisture content are interesting. The impacts of climate change are creating not only more intense and bigger hurricanes, they are also increasing the correlated surge height and the separately correlated water load.
Saffir-Simpson is a useful model, but it’s obviously inadequate. It completely underrated Superstorm Sandy, the most destructive storm in US history. It underrated Hurricane Harvey, which was also incredibly destructive. And it set Irma as a 4 when it was more destructive than that.
References:

Have a tip for CleanTechnica? Want to advertise? Want to suggest a guest for our CleanTech Talk podcast? Contact us here.
Latest CleanTechnica.TV Videos

CleanTechnica uses affiliate links. See our policy here.
CleanTechnica’s Comment Policy


