Sign up for daily news updates from CleanTechnica on email. Or follow us on Google News!
Before Professor Bent Flyvbjerg’s book with Dan Gardner, How Big Things Get Done, was topping 2023 bestseller lists and on the Kindle and Audible apps of policymakers, investors, and developers globally, I had the chance to sit down with him. Originally, this episode was published on CleanTechnica’s CleanTech Talks, but management kindly permitted me to repurpose the audio for my current podcast, Redefining Energy – Tech.
Michael Barnard (MB): Hi, welcome back to Redefining Energy – Tech. I’m your host, Michael Barnard. This is a repeat of a discussion I had with Professor Bent Flyvbjerg, author of 2023’s top selling business book, How Big Things Get Done. Listen in for our discussion of nuclear modularity, scaling, and megaprojects.
Professor Bent Flyvbjerg (BF): Thank you very much. Thank you for having me.
MB: Now, the excuse for having you, because I would gladly spend hours and hours talking to you about a bunch of topics that sadly, we don’t have time for, is the publication of your upcoming book with Dan Gardner. That book is How Big Things Get Done. It explores your decades of research and experience in dealing with megaprojects, their failures, what works, and what doesn’t. And today, we’re gonna focus on some clean tech aspects out of that. But before we get into that, how did you end up being the person, that is the go-to person for governments globally when megaprojects need to be started effectively, when portfolios, megaprojects need to get moving, or when they just go off the rails, literally in some cases.
BF: So, like you mentioned, I’m an economic geographer, and economic geography is a special branch of economics that focus on what we call spatial economics. Here you look at how do economics play out in space? And that could be urban space or regional space or national space. So you basically look at what’s going on the surface of the planet in economic terms. And that’s what I was raised on as a student, undergraduate, graduate, PhD, postdoc, everything. And at one stage, I started noticing that the cities and regions were being built in larger and larger chunks. So the projects that make up a city, to take that city as an example, just got larger and larger. And I noticed this early on, and I identified it as a mega trend. You know, I said, okay, this is going to be the future.
It’s actually not planning that is so important as such, which you talk about planning as land use planning. It’s much more what are the specific projects that a city decides to do and how they’re delivered? That’s what’s going to be defining cities and actually regions and ultimately nations in the future. This is a long time ago, I saw this just by observing what was happening on the ground, including in my home country, which is Denmark, but also other countries. And I started looking around and found I couldn’t find any data on this, even though already at that stage, trillions and trillions of dollars were spent on these big projects, and nobody was collecting data. You couldn’t get data on them.
So as a scholar, you know, this is an ideal situation. There’s just a wide area on the map. Nobody has studied it before. Let me get in there and study it. So that’s how it started.
MB: Why was there no data? This strikes me as, you know, it’s an obvious insight, but why do you think that was? We’ve been building big stuff for thousands of years. Why haven’t people been collecting even good anecdotal data?
BF: For several reasons. One is that it’s very hard to collect this data. I didn’t know this at the beginning, but I got educated quickly about how difficult it is to get high quality data. There’s so much crap data out there, and in a big project, there are so many versions of data. So just to choose the right version of the data, which would be the version that has validity and reliability from a scholarly point of view, is a major job in its own right. So that’s one thing. And that meant that they were only, like, there might be some data on individual projects or a handful of projects, but there was nothing that would allow statistical analysis, you know, for which you need a larger sample. And so it wasn’t really on the radar of scholars either.
And practitioners are so in the here and now, and they’re very future-oriented. They’re always thinking about the next project. Nobody thinks once you deliver a project, actually, it’s very rare. So to have anybody stop and think, okay, what can we learn from what we just did? Why don’t we collect some data on the outcomes and then see how the outcomes compare to the plans? This is almost never done. So this is a combination of reasons why data sets just were not available until we started collecting data. It actually took us five years to collect the first data set of just 258 projects, which was the largest dataset in the world when we published this in 2002. So this is just over 20 years ago now. And today, it’s ludicrous to think that 258 projects could be the largest data set in the world.
Now, just my group might seem like we have a data set that has now grown to over 16,000 projects, which still is the largest database in the world. But that’s how we started. And 258 was actually enough to start doing statistical analysis and come up with some valid and reliable answers to questions like, how much does it actually cost to deliver a big project? What’s the likely cost overrun on a big project? How long does it take? What’s the likely schedule overrun? What are the benefits generated? And is it the benefits that were planned, or do we get more benefits or less benefits than we planned? So these were the kind of questions we could start rigorously analyzing after we got those first 258 projects.
MB: Let’s just take an example. We connected over nuclear energy, and we’ll get into that in a bit. But let’s just take the history of nuclear generation build-outs. I’ve looked at that. You’ve looked at that. Take Ontario, where I’ve lived many times, that place, they had a provincial strategy in the richest, largest province in Canada, equivalent to Baden, not Wittgenstein, but the biggest province in Germany [Württemberg]. And they took $20 billion off the books and shoved into general accounting at one point. And 15 years ago or so, they pushed it back into the utilities books, but it’s now visible, and they’re trying to pay it down.
But I look at France, and if we take Macron, when he was in charge of the organization that should know this, has admitted that he could never figure out how much they actually spent, because as national strategies or major political strategies, money flows in odd ways in different accounting systems. How do you reconcile some of those challenges in a way that was academically sufficiently of quality?
BF: So you just look at that, and you’re right, there are myriad ways that you can hide costs, take them off the books, or you can even include them in the books arbitrarily. And that’s a huge problem. So basically, we study this in detail for each and every project and see if we can make sense of it. Sometimes we can. Then we don’t include the project. We have clear criteria that data have to be valid and reliable.
So if there’s something dodgy that we can’t explain, we will simply leave out that project, because we are very keenly aware that we don’t want to pollute our database, which is the problem with most data that consultants are using, is that it’s garbage in, garbage out, that they’re so hungry for just having data that they will accept data, even if the quality of the data might be of dubious quality, of dubious status, and they include it anyway. In that way, you get a database that is not really worth it. And I decided from the very start that we were not going to do that, because I felt we’re going to be spending a lot of time on this, and that would be completely meaningless if we didn’t know the validity and the reliability of our data.
So we would not include anything that had unacceptable validity and reliability. That doesn’t mean that the data are perfect. There’s no such thing as perfect data on big projects like we’re talking about here. There would always be things that could be better and that are not entirely clear. But still, the data would have to be above a threshold where you could say, hey, this data actually contains really worthwhile information. It tells the truth about what the costs were here, and if we couldn’t claim that, we wouldn’t include it or the schedule or the benefits.
MB: Yeah, and it’s interesting what you get up with, because, as you say, 16,000 data points, and now you can do statistical analysis. One of the things I thought was most fascinating in the book was you not only looked at cost and schedule overruns, but you also looked at benefit accruals, and you actually did a fundamental piece of analysis to disprove a theory about unlocking creativity and doing stuff, even though it appears to be a bad idea. That insight was, I mean, 0.5% of projects, if memory serves, actually come in on time, on a budget, or close to it, and actually deliver benefits. Can you unpack that a bit and unpack that argument that you countered?
BF: So the 0.5% we call the iron law of projects, and the iron law goes like this, over budgets, over time, under benefits, over and over again. That’s the iron law. About 48% of projects come in on budget or better. About 8% of projects come in on budget and on time or better. And then the famous 0.5%, those are the projects that come in on budget, on time, and deliver the promised benefits or better. So that’s how little. It’s half a percent. There’s a diagram in the book, and the interesting thing is that half percent, when we had to show that in the diagram, it’s invisible because you need to show the 100%, you need to show the 48%, you need to show the 8%, and then the half percent just becomes invisible.
And that’s pretty much a good metaphor for how things are in real life, that the projects that tick all the boxes regarding success, which are on budget, on time, and on benefits, are better, are invisible. That’s how few they are. I want to emphasize that it doesn’t mean that they don’t exist. Especially when you start thousands of projects, even half a percent will give you a couple of handfuls. And that’s what’s really interesting to me, is how on earth do the people who are doing these projects, how do they beat the odds? Because the 0.5%, that’s your base rate. That’s the objective base rate. When you look at these products, like going to the casino, if you play the game of building a big project, your odds are 0.5% that you will win.
If by winning, you define it as being on budget, on time, and on benefits, those are pretty steep odds, you know, and if you are going to go in and claim I can beat those odds, you better have something, and I want to know what that something is. And we spend a lot of time on that in our research. And when we wrote the book, you know, to pick the brains and study the data of people who actually beat the odds, just as you would if you were in a casino and you were interested in winning in a casino, there’s somebody walking around the casino, and they beat the roulette, they beat blackjack, and so on consistently. You want to know what’s going on there. And believe me, the casinos have detectives that are on this immediately and cameras that are on people.
They’ll be on this immediately and study what’s going on here. In a casino, it’s usually fraud. Somebody’s gaming the system or counts and cards or whatever, and they will be expelled from the casino very quickly. So we’re like those detectives and those cameras. We were watching all the people doing projects and finding who are the ones that actually are winning here. And we didn’t kick them out. We actually sought them out and said, can we please talk? Can we please look at your data? Can we please look at your documentation? And so on. And then we figured out, what is it that they’re doing, that they are successful at this.
MB: It’s an interesting question. I speak to institutional investors occasionally. They reach out for somewhat often contrarian perspectives on the decarbonization future. But one of the things that occurs to me is you have a set of 25 categories of projects, and only five of them are in the sweet spot of usually delivering on time, on budget, and delivering benefits. That’s an easy list. Transmission is in there, for example. But then we go into the other stuff. Nuclear is way down the bottom of the list. What are some interesting examples of things that usually go wrong or usually go right from your perspective?
BF: For me, this is the most interesting result in the book. And it’s the first time we publish these and we look at 25 different projects. We present the data for those 25 different projects, and we find, like you say, four or five project types do very well, and all the rest are doing rather poorly to different degrees, to be sure. And we show the different degrees. And some of the successes are, as you mentioned, transmission. And the most successful is actually solar power. Solar energy. That’s the most successful. After that, wind. Wind energy. So now we have solar, wind, transmission. Wow, that’s interesting, because that’s exactly what we need in order to solve the climate crisis. Right. So I just, I went through, when I saw this, I said, whoa, what a result. How lucky can I be?
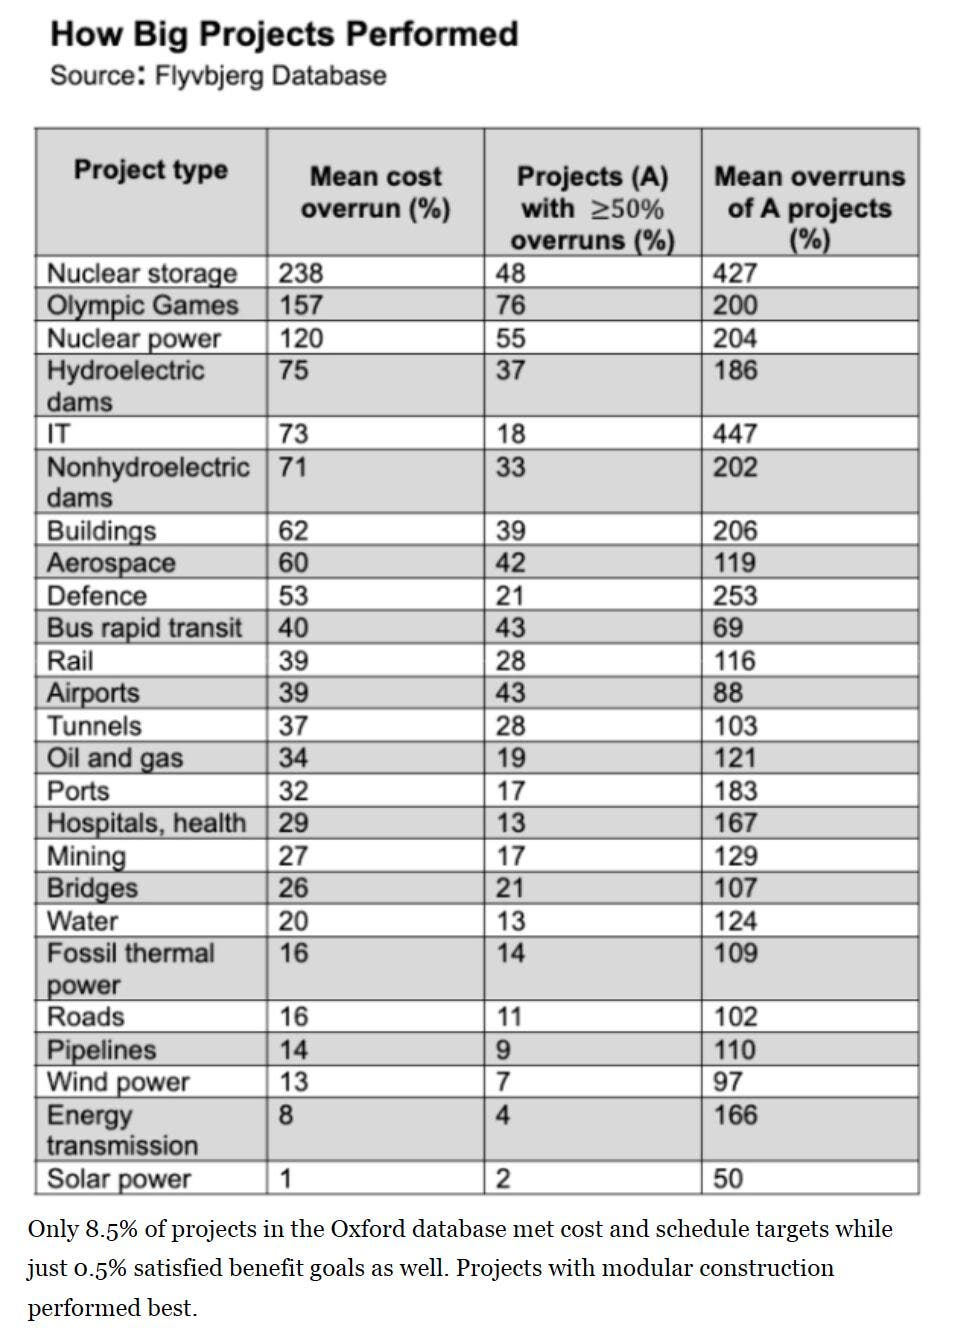
I mean, it might have been the opposite. And at the opposite end, which you also asked for, what are the examples of really underperforming projects? One of the worst is nuclear power, only surpassed in worseness by nuclear storage. Nuclear is way at the other end. So basically, nuclear and solar at opposite ends of the scale here. But lots of other stuff is at the bad end of the scale, too. Like the Olympic Games is one project type we study that has terrible performance consistently. It’s not so hard to understand. I mean, you always do it in a new country. We talk about something called the eternal beginner’s syndrome, that it’s always beginners who are doing this so you don’t get accumulated experience. For the Olympic Games. Hydroelectric power, same thing.
So big dams, whether they are hydroelectric or not, big dams are really difficult to build, and they also have bad performance. Airports, high speed rail, lots of other project types. So there, it’s a bad end. And at the other end, we have these good-performing, well-performing types. And the secret to the difference is we also uncover that is actually fat tails. So thin tail projects that have thin tail distributions for their performance are doing well. So they have more or less like a normal distribution of costs and cost overrun and scheduled overrun and benefits. And that means that they are manageable. So they are normal in that sense, even statistically. Right. The other projects that are going bad have fed chains. So what Nassim Taleb calls black swans. And by some people, they are considered outliers.
We don’t consider them outliers because they are actually part of the distribution. It’s not like some statistical error. It’s actually real performance, real projects who performed like that. So they are part of the distribution, and they are extreme, like you could have on it projects, which is the worst project type. Regarding outliers, if you look at the fat tail, the average in the fat tail is more than 400% cost overrun. That means that there are projects with much higher cost overruns than the 400, because that’s an average, right? So to find cost overruns of four, five, or six hundred percent is not unusual. And that’s a completely different ballgame compared to solar, where you never find that kind of cost overrun, at least not so far in the data that we have seen.
MB: Yeah, it’s interesting because I prefer Michele Wucker’s gray rhino metaphor. Completely understand why for a more western-oriented book, which I think your book is, black swan has become the dominant metaphor for risk since Talib published around the same time as the subprime mortgage crisis. My experience with the book is that people have used it as an excuse to say we couldn’t have possibly known about these things, as opposed to say we ignored these things that were pretty obvious if we thought about them and we didn’t build a resilient system that would accommodate fat tail risks knowing that they’re present. And so Wucker’s metaphor, you define the way people should think about black swans in your book. And I recommend people read it, obviously.
But I would say that you actually define it much more like Wucker’s gray rhino metaphor, which, oddly, is much more dominant in Asia than it is in the west. She’s had massively more penetration there. It’s being discussed at the highest levels of the Chinese Politburo, for example, in terms of guiding their strategies. You can kind of see some of those long-termism behaviors and the way they’re structuring out stuff, versus some of the short-termism that often democracies indulge in around electoral cycles. And we’re seeing those kinds of implications. Have you read Wucker’s book and have any examples or contrasts there that you can pull apart?
BF: So the way I understand it is that the gray rhinos are less extreme than the black swans. So that they are extreme, but they are not as extreme. Actually, our definition, we don’t have to call it black swans or gray rhinos or anything. Our definition is actually statistical. Statisticians have a very clear definition of what extreme values are. So there’s something called extreme value theory in statistics, and you define an outlier. So if it’s cost overrun, for instance, you would say the technical definition is that it’s 1.5 interquartile ranges, about the third quartile. And that’s, you know, that’s objective. That’s just the way statisticians think of it. They don’t care what you call it, whether you call it gray or black or whatever it is. That’s what’s called an extreme value theory.
As I understand gray rhinos, they come in, they’re not necessarily that extreme, but they’re still extreme enough to create lots of problems in practice, policy, and planning. And I would say the way we do it, we consider the whole range. You’re familiar with reference task forecasting, I’ve seen in what you’re writing. And if you read about the way we do that, you will know that we look at the total distribution, the total probability distribution, or whatever variable it is that we are forecasting. And I find that gives me really peace of mind because I know there’s nothing I don’t look at. So whether it’s gray or black or what it is, it’s being considered. And we do pay special attention to the most extreme values, because we know that these are the most damaging.
If you end up in the tail, you are in trouble. And you are not only in a little trouble, you are in big trouble. And it’s very hard to protect yourself against through contingencies, because the contingencies just have to be too high. You will never get those kinds of contingencies. It is not even rational within an organization to allocate that much contingency to any one project because it means you can use the resources for other projects, right? So what we recommend is that when that like 80% of the probability distribution, you can project yourself with contingencies. And we calculate the exact size of those contingencies, and then we say the remaining part of the probability distribution, you really got to go in and mitigate. So that doesn’t happen. We call that black swan management.
And then the slogan of black swan management is cut the tail. You need to cut the tail. And how do you cut the tail? You cut the tail through mitigation. So let’s take a really simple example like Fukushima, you know, and you need to protect the nuclear power plant against a tsunami wave. Simple. You build a wall that’s tall enough and then that’s it, you know, that’s it.
MB: Or move it uphill, because they built the plant downhill from a tsunami high level marker from the 17th century.
BF: Move it uphill, you know, that’s even easier. Even easier.
So we go through an exercise like this. And of course, most of the time, it’s not a tsunami wall. That is the solution. I’m just mentioning that because it’s so easy to understand or build further in a country or up at a higher level and with different projects and project types. Mitigation means different things. But you can always sit down and think, how do I cut the tail? Is the most valuable exercise you can go through when you’re delivering a project. It’s very exciting and stimulating too, when you get, so this is something you do like a whole team of people who are experts in what you are talking about here, and they just sit down and for whatever time it takes, goes through. Like, how do we get that tail off there? How do we cut that tail?
Are we confident that the tail is now cut and come up with all the different measures that could help compensate?
MB: Well, it’s interesting, because I know you worked with Daniel Kahneman, and I totally envy the two different academics [I know] who have had the opportunity to work with Kahneman. He just must be such a delightful person. And that’s where I first ran across your work, in Kahneman’s Thinking, Fast and Slow. In Kahneman’s Thinking, Fast and Slow, he talks about the precursor thinking behind reference class forecasting. But he also articulates the use of premortems as a mechanism for doing that. And I kind of was reading your book and saying, oh, he’s not mentioning pre-mortems. The reference class forecasting is excellent because it gives you a statistical view of the actual risk and the variability of the fat tails for your project class. But the pre-mortem allows you to cut the tail. But you don’t use that term. You call it cutting the tail, which is probably more evocative anyway. It’s a process.
BF: I seem to remember that we do mention the pre-mortem somewhere. But anyway, whether we do or not, I do think pre-mortems are a very important methodology, a very legitimate methodology. And yes, Kahneman has been extremely helpful for my thinking. He’s been very generous and giving me feedback and so on. And that has been very helpful. Obviously, when you are using his ideas, and that really works. And you probably saw his latest book, with co-authors, called Noise. And now he’s using a more general term in that book and in previous publications after thinking fast. And it’s decision hygiene. So you need a certain hygiene when you’re making decisions. And typically humans just skip that. We have no decision hygiene. We have this thing called availability bias.
So we just jump straight to the thing that just pops into our mind and then we start working on that and we feel that we’ve got going. We just, we have such an urge, I don’t know what it is, but we seem to be hardwired just to get going with things and not to sit back and think and reflect over what is it that we are doing here and think it through before we get going. So we have this availability bias that tends to get us going and that bypasses decision hygiene. And decision hygiene is the solution to that problem. And decision hygiene is pre-mortems, for instance. So pre-mortems are an example of decision hygiene, and reference forecasting is another example of decision hygiene. And there are others.
MB: I’ve written about this in the past because I’ve read Kahneman. I’ve dealt with cognitive scientists like John Cook, who’s the PhD cognitive scientist behind Skeptical Science, the climate change myth debunking site, and Stephen Lewandowski, his PhD advisor. The availability bias that always amuses me is that so many thought leaders around decarbonization are North Americans. They tend to be affluent and live in suburbs and have solar panels on their roofs. And so their availability bias leads them to assume that rooftop solar can be a more impactful solution than it is. Now do you live in Copenhagen itself?
BF: I live in Copenhagen itself, yes. And Oxford both.
MB: And Copenhagen, it’s a bunch of five-story apartment buildings where the population density is much more like the rest of the world than like North American suburbs. I live in much higher density downtown Vancouver. Every once in a while I count, I think it’s 18-story plus, condo buildings that are visible from my windows in my home office. We have I think 3600 people on my block. And this is much more like an Asian pattern of living. It’s much more like the population density of Paris. But the availability bias of people who like distributed energy, they see detached homes, so it seems a lot more people in the world live in detached homes. It’s just one of those interesting things.
BF: Yeah, and that’s the way we are. I mean like Kahneman says in his book, like his life has been spent on studying these biases, but he’s getting tripped up by them all the time anyway, you know, and I think we just have to realize this. That’s no excuse for letting them run rampant. Obviously quite the opposite. It means that we really have to have this decision hygiene. If we don’t do that, we are not doing our jobs.
MB: I spend a lot of time figuring out what the denominators are and then figuring that scale up. Let’s go back to the specific example we talked about, the project classes like wind and solar, which tend to be on time, on budget, and achieve benefits versus nuclear. The reason you and Dan Gardner, your co-author, originally reached out to me was because I’d published on the natural experiment of those three technologies in China over a dozen years. I’ve been looking at that since 2014. You included some of my work, you extended it in time, and transformed some of the stuff because it made more sense. But why don’t you talk about what you observe from the experience in China and other places about why wind and solar are so successful and nuclear isn’t?
BF: Yeah. And first, let me say, we couldn’t believe our luck when we came across that part of your work, because that natural experiment, that China is exactly what we needed in order to get a decision on whether nuclear works. Basically because people usually say that China would be the place where it would work if it works. And you just had the data to show that. And obviously your data show that it doesn’t work even in China, if by working would mean being scaled up to the level that it needs to be scaled up to, if it’s going to be a major fix for the climate crises. And you compare directly to wind and solar, and you show that they scale up much faster. Okay, so we explain why in the book, we say, okay, why is that the case? That’s strange on first sight.
Why would it be so different? But it relates back to what I said earlier, that nuclear is fat tailed and wind and solar are thin tailed. So they’re much more manageable and they scale much better, much faster, much more easily than nuclear. Then we went deeper and we looked at what’s called learning curves, which basically occurs that show, you know, the more you do a thing, you know, how much easier does it get? And by easier, you often say cheaper, it gets cheaper and faster. So, and this is our normal experience as human beings. Just think of if you’re doing some handiwork around your house, you start on a Saturday morning, you need to get something done. Everything feels wrong, you know, the tools in your hand and whatever you’re doing.
But you get going and you get some experience with what it is that is your task that day. And even within that kind of a short period of time, you get better at what you’re doing. Now, as you expand that and think about doing it day after day, you do something that our general experience is that it becomes easier to do something the more times we do it. It becomes cheaper to do something. The more times we do it. It becomes faster to do something the more times we do it. Now that’s exactly what has happened with solar and wind, that we have become much better. It used to take much longer even to put up a single wind turbine than it does now. You put up turbines one a day now, and you build.
So this is actually the first time I’ve ever seen multi-billion dollar projects being built in less than a year. Those are wind farms. That’s unusual. I would say. Usually you would have, at least at first, to make a project. It’s four or five years. That’s fast. And here you have in the most difficult waters on the planet. So this is offshore wind I’m talking about, that is being built in the Irish Sea and the North Sea, which are both part of the North Atlantic, which is like the same part of the world as you. You don’t want to be out in the winter. Like, basically, you can’t do anything from October till April, March, April.
And nevertheless, you know, now, in those seven months that they have to do things, they will actually put up a multi-billion dollar wind farm in that period of time, which is totally off the charts. It’s being done. And this is through this positive learning that I’m talking about getting better by doing it over and over again. And solar even more so, because it’s even more modular than wind. I usually call it Legos. That’s why the last chapter in our book is called, What’s Your Lego? That’s what you need to do when you’re doing things. You need to have a Lego in order to be effective. And a wind turbine is four pieces of Lego. There’s a foundation, there’s a tower, there’s a nacelle, that’s the turbine itself.
And then there are the blades, or the wings that it’s called sometimes, also that click onto the nacelle. And that’s your wind turbine. So it’s like click, click. And there it is. And, okay, those are big pieces of Lego. So there’s some difficulty in getting them out to sea. And there might be a lot of wind when they’re raising them. So they have a lot of strong tools and so on, powerful tools, big tools to get these things done. But basically, that’s the way it’s done. And it’s because it’s done like Lego. Click, click, over and over, that it’s so efficient and that we get these economies of scale and economies of learning. So that’s wind and solar at the other end. Back to nuclear. It turns out when you start looking at the learning curves in nuclear, it’s the exact opposite.
And this is weird. This is actually something that should not be happening, but it is happening. The more you do nuclear, the more difficult it gets. That’s called negative learning. So you do one nuclear plant and you find out this is actually more difficult than we thought. For instance, getting the safety requirements right is much more difficult than we had estimated. So now that we’re doing an estimate for the next nuclear plant, it’s actually going to be more expensive than the first one, because now we have learned these things about safety, and we built that into the next estimate, and then we try again. That’s the second one. So you build a second nuclear plant at a higher cost which takes longer because it’s more difficult. And so on what happens? Fukushima happens, or Three Mile Island or Chernobyl, you have an accident.
All of a sudden, the rules and regulations change and they are being ramped up. You get much higher safety standards that you have to live up to. So now, all of a sudden, the standards have gone up and you have to live up to those. So now then the next nuclear power plant, the third one, it gets even more expensive because you have to live up to these standards. Right. And that’s negative learning. That’s the more you do it, the more expensive it gets. And that is what has happened with nuclear over the past several decades, except maybe in one place, and that is South Korea, but all other countries for which we have data, it looks like negative learning is the case, that it gets more and more difficult. It gets more and more expensive.
In fact, some of those nuclear power plants are causing bankruptcies for the companies that are building, like Westinghouse went bankrupt because of nuclear reactors that couldn’t be built to the budget and to the time that was in the United States, in Europe, we have two. We had to have a few more now. But the nuclear reactors that have progressed and should be close to being finished now are not being finished. You know, there’s always a new story of why there’s another delay and why the body is going up. So that’s negative learning for you. We just don’t have anything on the ground in North America and in Europe that would encourage us to think that we can deliver nuclear power cheaper in the future. So that’s why nuclear looks the way it does in our data.
And that’s why, and this is purely for economic reasons, many people think this is something ideological, being against nuclear power. It’s not even about nuclear waste. That’s not even taken into account. This is simply the economics of building nuclear power plants. On that criterion alone, nuclear power is losing out.
MB: Yeah, it’s interesting. Here’s what I characterize as the success requirements for a nuclear rollout. And this is before I read your work, which confirmation bias suggests we think identical on this, because, of course, what you wrote confirms what I think. It’s one of those other biases that Kahneman points out, which I try hard to overcome. But the articulation I make is that it’s possible to do gigawatt-scale nuclear reactor build-outs under the following conditions with reasonable experiences. First, you have to do lots of them, dozens in a country or a region. Second, it has to be a national strategy, so that you get to override over a whole bunch of local regulatory things that’s typically related to nuclear weapons build-out, or capacity you build out of, so the federal government can step in and throw its weight around.
Third, it has to be exactly the same design. You have to avoid the desire to do bespoke engineering for a specific site for the technology. You just have dozens of the same thing. There was a period in the United States where the light pressurized water reactors were built in sufficient quantities that it worked out. And this gets to another point you make in the book, which was that you need a master builder and their team. Building the capacity of resources who are certified and security-credentialed, enabling them to work on nuclear plants, is deeply non-trivial. Holland is looking at a nuclear reactor, and they have nobody who has any of those skills, and where are they going to get them from? EDF. That’s working out really well in Hinkley.
That master builder and their team of experienced people and shared stuff has to be done in a short period of time. And lastly, which is getting introduced in the next subject, small modular reactors. They have to be built as components at the maximum viable scale for the physics of it. Wind turbines, as you mentioned, are very big these days. Onshore, the average is 2.6 MW. Offshore, it’s much higher, and that’s a logistical choice. If they could build wind turbines the size of offshore wind turbines, and get them along roads and on railways, under bridges, they would. But they can’t deliver the blades and mast and the nacelles to the sites onshore, but they can offshore. So that’s why we’re now seeing the Innwind project, which has been going on for a decade or so. Now they’re edging up towards 20-megawatt individual wind turbines.
BF: Massive, massive beasts.
MB: But you can deliver that offshore. You can build them in a port area and put them on ships that are special tenders, and then you have automated solutions, heavy lift automation, which enables you to construct that. But wind turbines getting bigger, it’s not like we left wind turbines small because we need to maximize the physics of them. Now, nuclear reactors, from a thermal generation perspective, coal plants want to be bigger because that boiler and then generating the steam is more efficient the bigger they get, up to the maximum 1 to 1.2 gigawatts. And nuclear reactors are just coal plants with radiation instead of coal plants with CO2. It’s just thermal generation. Small modular reactors want to get that modularity and constructability and manufacturability, deliverability, but they don’t, they forego thermal dynamics, so they lose that efficiency there. And it’s an interesting question for me.
Have you seen other examples where modularity has trumped the physics in your data sets, or do you have a perspective on that angle? I think it’s an unknown question to me. I think it’s significant, but I haven’t done the math sufficiently or seen another dataset where smaller works outside of small onshore wind energy where the limits are logistics.
BF: So when you say that smaller works, do you mean that smaller works even when there is a larger level like the 1 to 1.2 gigawatt what you’re talking about?
We haven’t studied that. It’s a very good point. It’s very interesting to me, and I understand your argument for small modular reactors and all I can say is the nuclear industry must hate you because this is the only hope. That’s what I say. If nuclear is going to work, it’s going to work, it will be small modular reactors. But now you’re saying like, no, that’s, it’s not going to work there. You even say it’s especially not going to work there because that goes against the basic physics of the whole thing in terms of where the sweet spot is regarding size. Well if you’re right, and I don’t hesitate to believe that you are, then I would say it’s game over for nuclear.
MB: I’ve looked at datasets like yours and the initial reactors being built in the fifties and sixties were tiny. They were much more like the ones on nuclear-powered submarines and nuclear-powered ships, because guess where the nuclear industry started? It started mostly in the United States and they repurposed their PWRs for electrical generation. But they found the electricity was really expensive at that scale, so they made them bigger and then the electricity cost dropped and then negative learning occurred and they tried to innovate instead of just building the same thing over and over again. They kept saying we could make it better and then it all blows up again from a cost and budget perspective. And so that’s that interesting thing right now.
I see the small modular reactors getting bigger and bigger because they’re doing the math and realizing small doesn’t work. So it’s fascinating to watch it balance back and forth. I think there’s an optimal size in there, but I don’t know what it is. I think it’s over 300 MW reactors. India for example, has a bunch of reactors, CANDU Canadian-designed reactors that are 300 MW or so. Maybe there’s a sweet spot in there. I don’t know. It’s an interesting question and I haven’t seen a counterexample to that. But I do have one counterexample which I think is interesting. And that’s the next topic, which is pumped hydro storage versus batteries.
This is Michael Barnard, host of Redefining Energy Tech. My guest today has been Professor Bent Flyvbjerg. If you don’t have his book How Big Things Get Done on your desk, get it now.
Have a tip for CleanTechnica? Want to advertise? Want to suggest a guest for our CleanTech Talk podcast? Contact us here.
Latest CleanTechnica.TV Videos

CleanTechnica uses affiliate links. See our policy here.
CleanTechnica’s Comment Policy


