Sign up for daily news updates from CleanTechnica on email. Or follow us on Google News!
Market Data Shows the Value of Transmission Remained High in Certain Locations Despite Overall Low Wholesale Electricity Prices
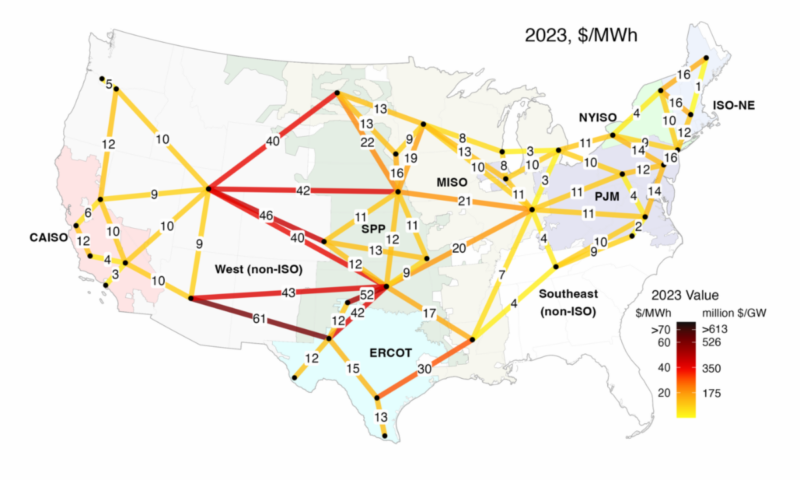
In 2023 additional electricity transmission would have provided the most value for links that crossed between grid interconnection regions in the United States or crossed between system operator regions within the same interconnection. The U.S. has three interconnection regions covering the western U.S., the eastern U.S., and Texas. Added transmission value is equivalent to reduced cost. Many multi-interconnection or multi-region links had values of greater than $20/MWh, or up to $175 million/yr per 1 GW expanded transmission. The technical brief discusses import caveats about total value estimates. In contrast to these high value links, many links within regions, or between regions in the northeast, had relatively low values in 2023, following the overall decline in wholesale electricity prices in 2023 compared with 2021-2022. In our new technical brief, we analyze transmission value across the contiguous United States. We also explore an example of a unique value of transmission that is different from value created by other solutions, such as building local generation resources — its ability to deliver benefits to two regions and ease constraints due to multiple types of circumstances.
To learn more about transmission value in 2023, see our technical brief here.

Update with market data in 2023
In the technical brief, we explore the potential value, or equivalently, the potential savings, that new transmission could have provided in 2023. The analysis differs from modeling approaches that are commonly used to value transmission, as it is based solely on the difference in wholesale-market energy prices between locations. When we refer to ‘transmission value’ we are referring to the value of additional transmission as indicated by locational price arbitrage.
This analysis builds on our past research. For example, see:
Key Findings for 2023
In the technical brief we provide additional detail describing these key points:
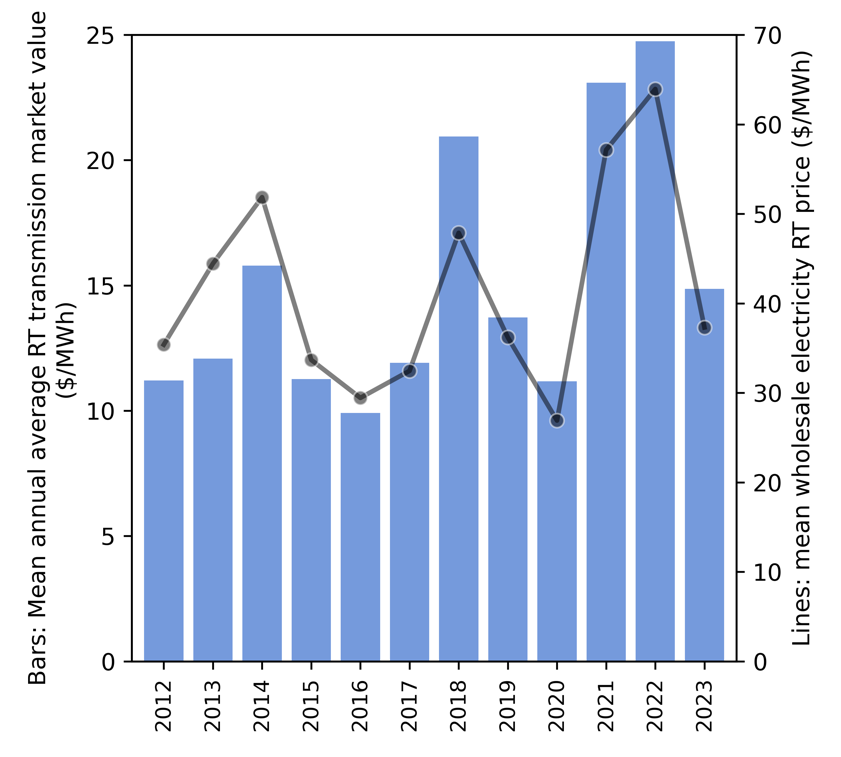
- Transmission value correlates with average wholesale electricity prices, and thus the decline to wholesale electricity prices in 2023 versus 2022 meant that many links saw a decline in value in 2023 (Figure 2). However, a number of interregional links maintained values close to or above $20/MWh, or equivalently, $175 million per GW of transmission capacity per year (Figure 1). This and all value estimates are subject to caveats discussed in the technical brief.
- Regions that saw the largest decline in transmission value from 2022 to 2023 include the northeast and mid-Atlantic, including the PJM, NYISO, and ISO-NE footprints. Both declining natural gas prices and the lack of a weather event in 2023 similar to winter storm Elliott led to this decline.
- Links between Texas and the Southwest had the highest value potential in 2023, peaking at greater than $60/MWh or $526 million per GW of new transmission.
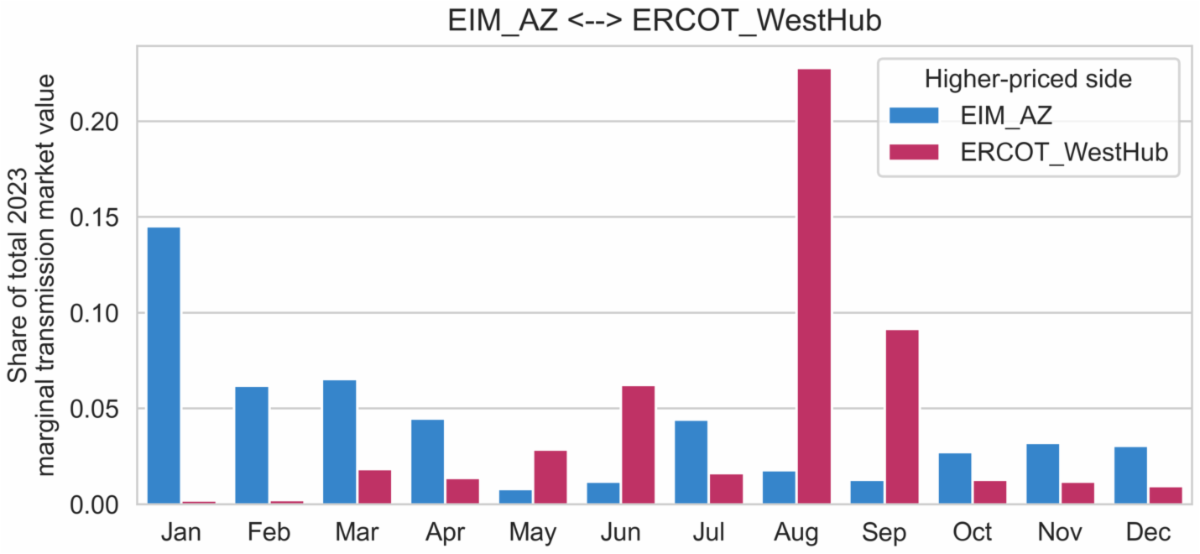
- Differing regional circumstances drove the high value potential for links between Texas and Southwest, with high wintertime natural gas prices in the southwest, but not Texas, driving transmission value during the winter, and high electricity demand associated with an unusually hot summer in Texas driving transmission value during the summer (Figure 3).
- Of note is that though both Texas and the Southwest saw record summer heat in 2023, circumstances were different enough in each region that peak electricity prices occurred at different hours in each region (Figure 4). This mismatch in timing of high prices demonstrates a particular value of transmission — even neighboring regions facing the same large-scale heatwave may have differences in the hours of peak energy need enabling transmission to reduce high prices in both regions.


Key Limitations
The technical brief describes important caveats and key limitations to the analysis, including the implications of the ‘marginal’ value calculations and additional context.
See more in our technical brief at: https://emp.lbl.gov/publications/transmission-value-2023-market-data.
Acknowledgements
This work was funded by the U.S. Department of Energy’s Office of Energy Efficiency and Renewable Energy under Contract No. DE-AC02-05CH11231. The authors are solely responsible for any omissions or errors contained herein.
Learn more.
Email from Lawrence Berkeley National Laboratory.
Have a tip for CleanTechnica? Want to advertise? Want to suggest a guest for our CleanTech Talk podcast? Contact us here.
Latest CleanTechnica.TV Videos
CleanTechnica uses affiliate links. See our policy here.
CleanTechnica’s Comment Policy


