Overall, the Stainless Monthly Metals Index (MMI) reversed to the downside, with a 10.88% drop from June to July.
Nickel prices experienced heavy losses during June, securing the title of worst-performing base metal with an over 14% decline. Prices had fallen over 19% from their May 20 peak by early June as they remained in search of a new bottom.
Understand the macroeconomic factors affecting stainless steel and nickel prices with MetalMiner’s Weekly Newsletter.

Bearish Conditions Lead to Steep Stainless Discounts
Bearish conditions continued to reverberate through the stainless steel sector throughout June. Distributors and brokers reported an oversupplied market, with buyers continuing to show no interest in building out inventories. Sources also indicated little optimism that demand was on the verge of a turnaround. Although some remained hopeful that fall would see its typical seasonal pickup, it appeared unlikely to amount to year-over-year growth as uncertainty remains a fixture within the market.
Despite the gloomy outlook plaguing the stainless steel market for over a year, mills continued to hold firm on base prices. According to sources, mills simply do not believe that decreased base prices will translate to higher demand, leaving them no incentive to formally adjust them. Instead, mills intend to wait out current market dynamics, hoping buyers will return when the Federal Reserve begins to cut rates and more infrastructure projects commence construction.
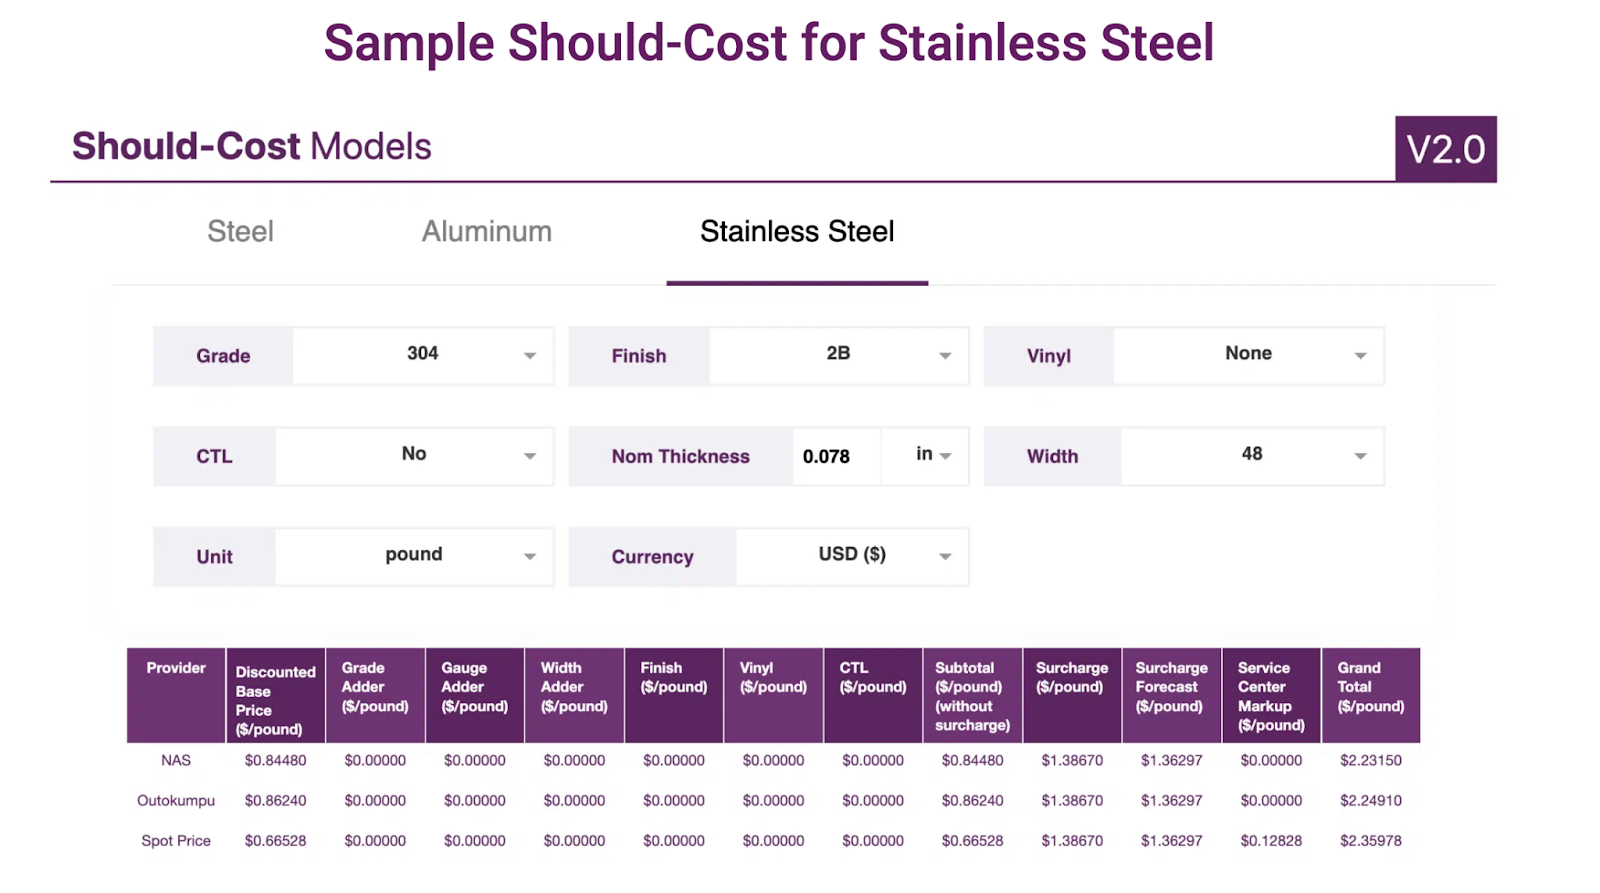
While mills hold firm on published base prices, weak conditions continued to offer substantial negotiating leverage to buyers. This continues to translate into steep discounts off the base price, especially for large-volume buyers. Meanwhile, mill lead times continued to trend historically short. However, they remained stable as mills appeared to exercise enough capacity discipline to maintain some balance, even amid lackluster demand. Recently reported discounts and current mill lead times are available in MetalMiner’s July Monthly Metal Outlook.
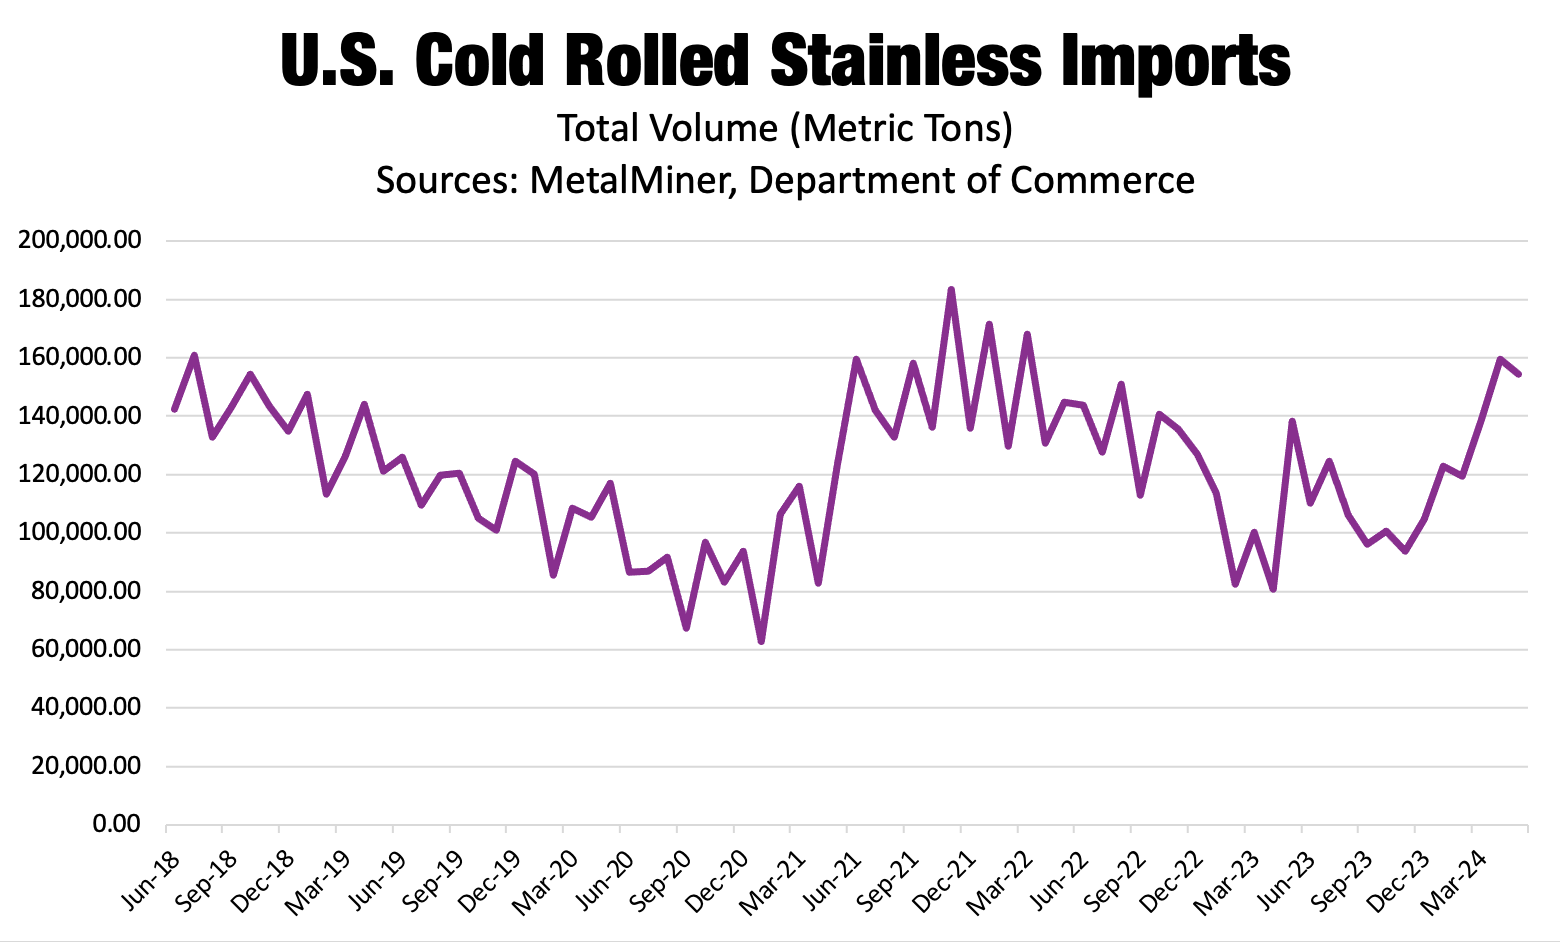
Cold Rolled Stainless Steel Imports Raise Despite Higher Freight Rates
Despite weak demand, the U.S. experienced a jump in cold rolled stainless steel imports from late 2023. Total monthly volumes jumped almost 65% from their low in November 2023 to where they stood in May 2024. Notably, April’s total trended near where volumes stood in 2021. That was when post-pandemic demand surged, forcing mills to institute allocations due to tight supply.
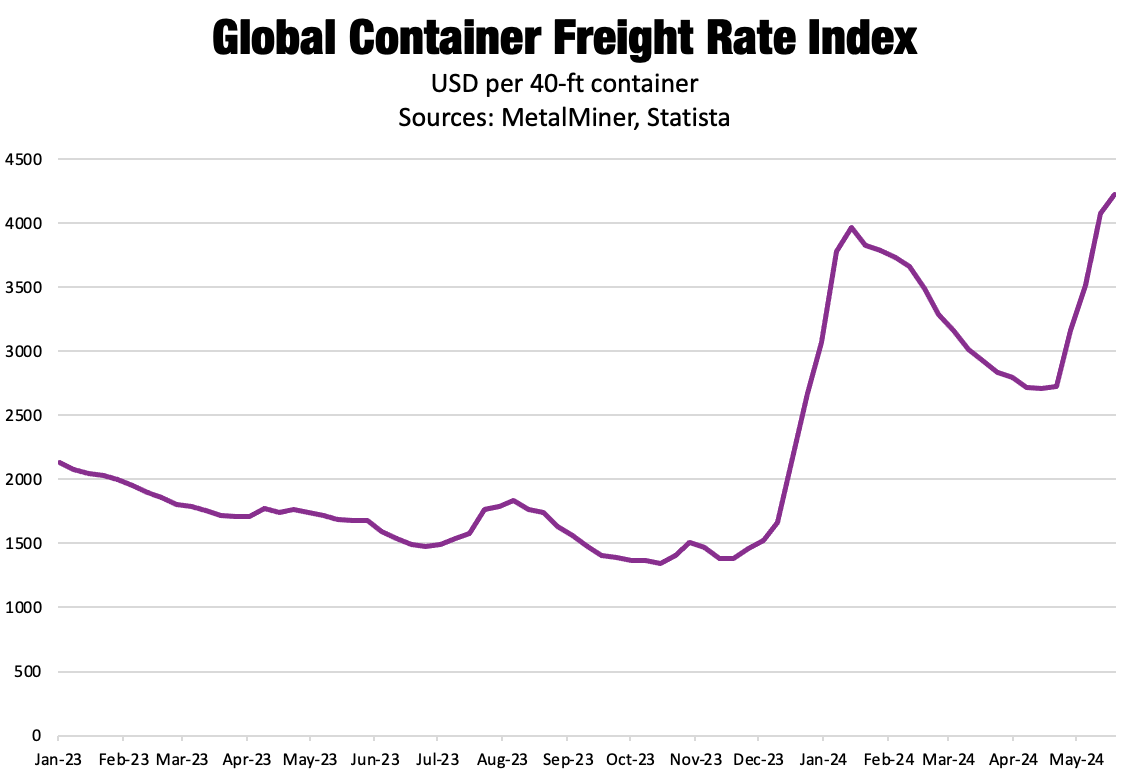
At first glance, higher import volumes come as a curious phenomenon. Current market conditions in the U.S. remain weak, while longer lead times and higher freight rates serve as a considerable disadvantage for import demand. According to Statista, the global container freight rate index jumped nearly 155% from December 2023 to May 2024, eroding the competitive advantage of import prices over their domestic counterparts.
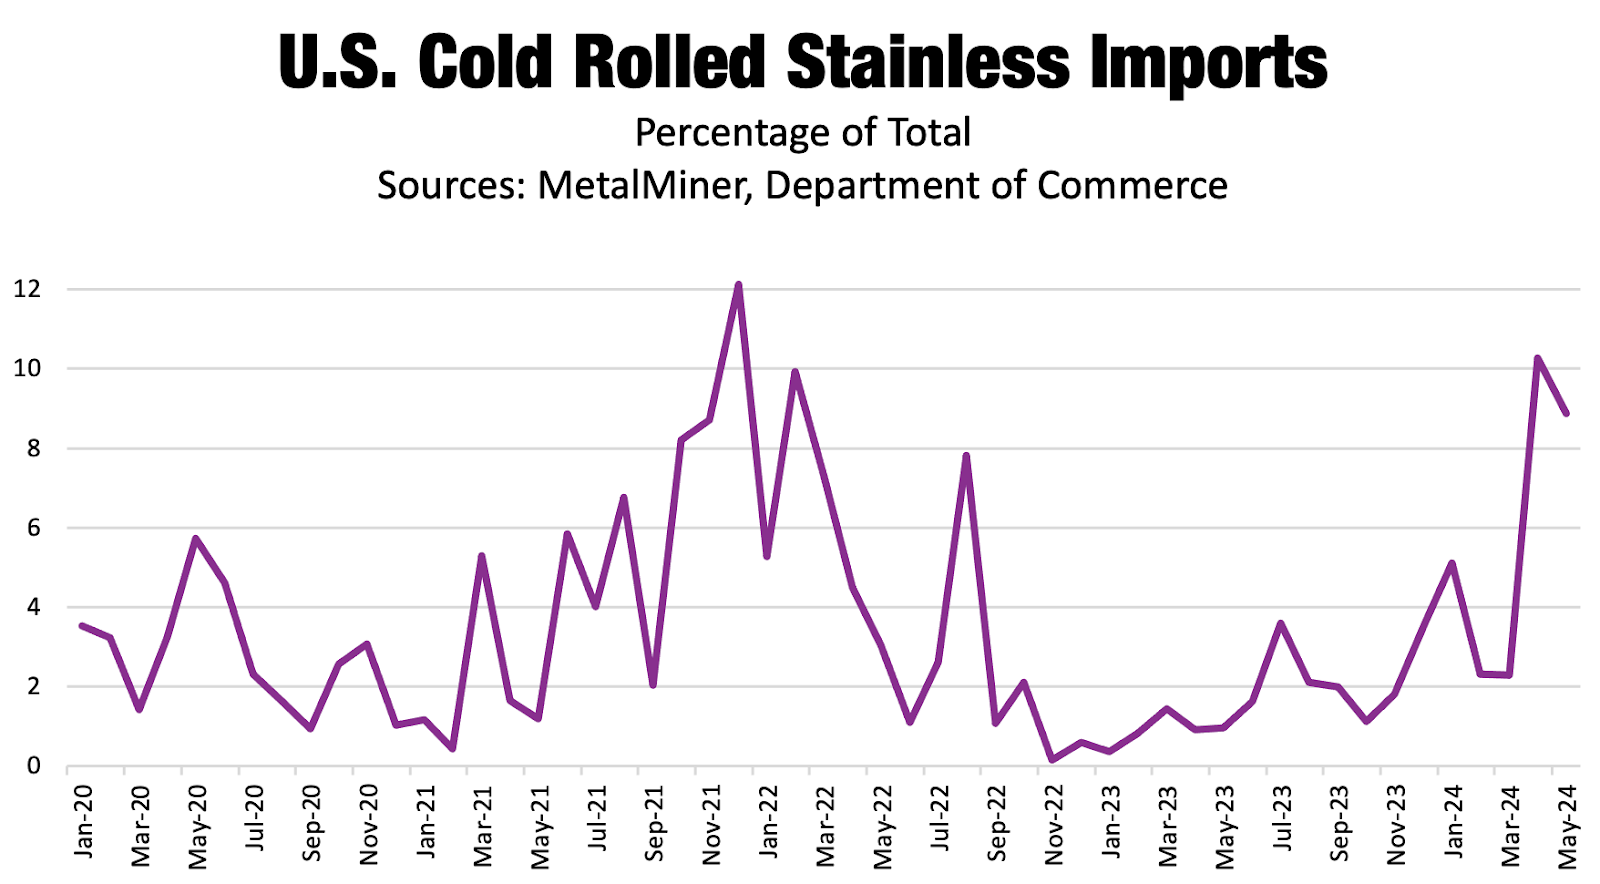
Vietnam Echos Carbon Steel, Increased Share of Total Imports
However, not every exporting country experienced the same degree of uptick. A closer look at the data reveals that volumes from Vietnam appeared to increase disproportionately. Since 2018, monthly imports from Vietnam averaged around 5.77% of total cold rolled stainless imports. Yet April and May saw Vietnam’s share rise to 10.26% and 8.88%, respectively, close to the levels seen when China was still in the middle of zero-COVID lockdowns. It’s worth noting that carbon steel has witnessed a similar trend since the start of 2024.
Monthly volumes always vary, so it remains premature to suggest that higher imports from Vietnam will become a sustained trend rather than a brief anomaly. However, considering the country in question, it may suggest Chinese dumping efforts.
Meanwhile, Chinese overcapacity remains a leading concern within geopolitics. The U.S. and other Western countries stepped up protectionist measures throughout the year on materials ranging from steel and aluminum to products like solar panels and EVs. However, weak consumer demand in China leaves China with few options to achieve its economic goals. Its property sector, once the engine for economic growth, has yet to bottom out, let alone rebound.
This has forced China to lean on export demand to support its industrial base, a strategy that includes potentially dumping products in countries like Vietnam to avoid duties from other countries. Learn about how to utilize nickel and stainless prices forecasting and granular stainless price data to save your company money. Join us in our July workshop: “Secrets to Embedding Deep Price Intelligence from Source-to-Pay”.
Glut of Chinese Material Pulling Markets Down
Due to tariffs, cold rolled stainless imports from China remain a negligible portion of the total. However, China’s share of the total has also increased. Since 2018, Chinese monthly imports have averaged around 0.06% of the total. The first five months of 2024 saw that average jump to 0.2%. While the total volumes from China appear meaningless with respect to domestic stainless supply and the market impact, the disproportionate increase suggests that demand conditions in China appear weak enough that prices can overcome U.S. duties.

The remainder of Chinese supply far surpasses the volumes that enter the U.S. and the amount China can consume. That leaves other countries like Vietnam on the hook. As Chinese material continued to make its way to the global marketplace, the invariable result seems to be a bearish impact on global prices.
Biggest Moves for Nickel Prices and Stainless Steel
MetalMiner’s Annual Metals Outlook provides 12 full months of industrial metal price forecasting. Our June interim update just released, get a sample report.
- Korean 304 cold rolled stainless stainless steel prices rose by a modest 0.87% to $2,626 per metric ton as of July 1.
- Chinese 316 stainless steel prices moved sideways, with a 0.21% increase to $3,746 per metric ton.
- Meanwhile, Chinese ferromolybdenum prices fell 3.58% to $32,830 per metric ton.
- Chinese primary nickel prices dropped 9.72% to $18,845 per metric ton.
- Indian primary nickel prices saw a 13.95% decline to $17.58 per kilogram.


