Sign up for daily news updates from CleanTechnica on email. Or follow us on Google News!
A new map tool from the Union of Concerned Scientists shows you where and when critical pieces of coastal infrastructure such as public housing buildings, schools and power plants are at risk of repeated, disruptive flooding due to climate change-driven sea level rise.
The map tool is based on data from our new analysis and report, Looming Deadlines for Coastal Resilience: Rising Seas, Disruptive Tides, and Risks to Coastal Infrastructure. Covering the contiguous United States, Puerto Rico, the US Virgin Islands, and Guam, the analysis finds that by 2050, with a medium sea level rise scenario, seawater would flood more than 1,600 critical coastal infrastructure assets twice or more per year. This scenario projects roughly one foot of sea level rise by 2050 relative to a 2000 baseline and is consistent with the trajectory of observed sea level rise for most regions of the United States.
With the map tool, you can see exactly which facilities in your community are at risk, which we hope sparks discussions and planning around how to cope with future sea level rise and flood risks. In this post, we’ll explore the tool and highlight the types of information it can provide. For those who want to dive deeper, we’ll also show you where you can find even more information that you can use to engage your community, your elected officials, and candidates running for office in conversations about how to plan for sea level rise.
Explore infrastructure at risk from sea level rise through 2050
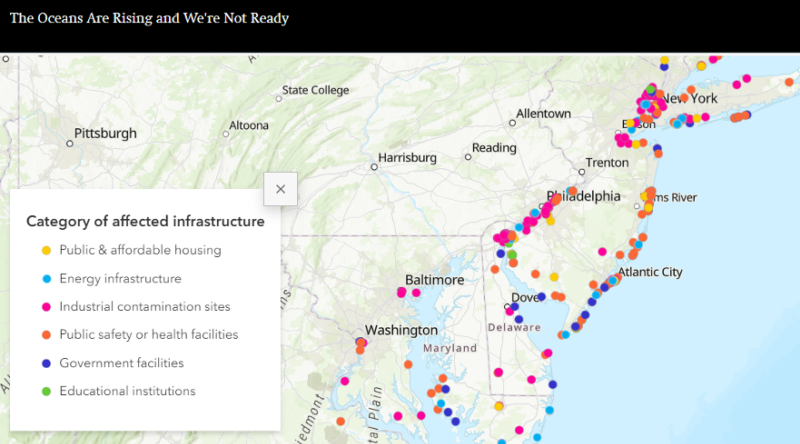
The first map you’ll come to in the Looming Deadlines mapping tool shows critical coastal infrastructure assets at risk of flooding twice or more per year by 2050 under the medium sea level rise scenario described above. The symbols on the map correspond to the six different categories of infrastructure we included in our analysis:
- Public housing buildings and affordable housing units
- Energy infrastructure, including power plants and electrical substations
- Industrial contamination sites, such as Superfund sites and brownfields
- Public safety and health facilities, such as hospitals and fire stations
- Educational institutions, including K-12 schools as well as colleges and universities
- Government facilities, such as city halls, post offices, and prisons

Clicking on any facility will bring up more information, including the name and address of the facility, what subcategory of infrastructure it belongs to (e.g., a hospital or a fire station within the category of public safety and health facilities), and an assessment of how frequently it is expected to flood in the 2050 timeframe. Of the 1,600 assets we identify as being at risk of disruptive flooding by 2050, roughly 1,100 are expected to flood, on average, monthly and more than 900 would flood an average of every other week.
With this information, you’ll be able to see exactly what is at risk—an important first step in thinking through how to make your community more resilient.
Examples of communities with infrastructure at risk from sea level rise
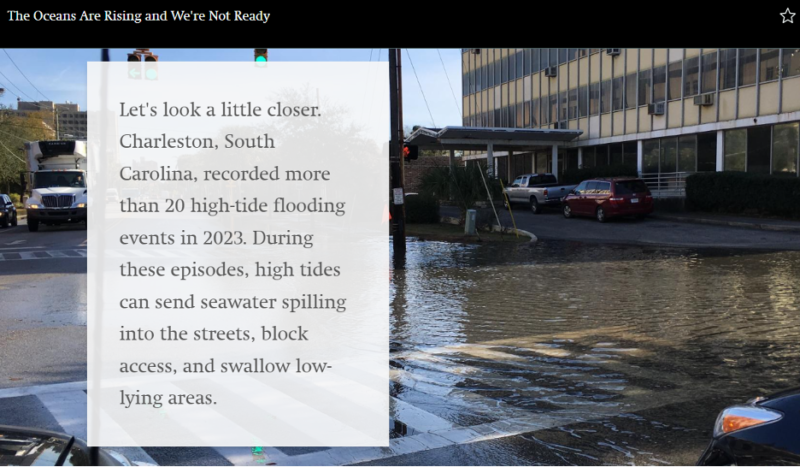
Most coastal communities in the United States have at least some infrastructure assets at risk of flooding due to sea level rise in the decades ahead. Some communities are already grappling with frequent flooding that poses an increasingly real threat to infrastructure with each passing year. The second section of the map tool provides a window into the risks and complexities a few communities are already facing. In doing so, it drives home just how much is at stake along our coasts.
Here’s an example we highlight from Charleston, South Carolina:

Seeing why our choices today matter for our kids and grandkids
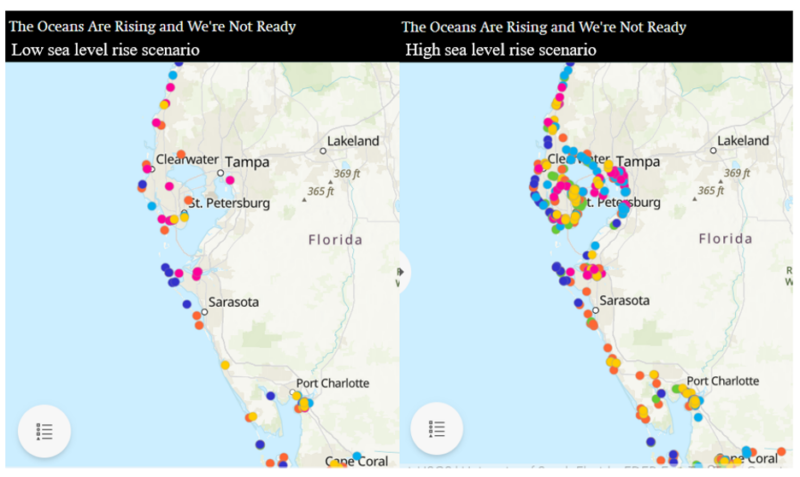
The amount of sea level rise expected between now and 2050 is fairly certain because it is largely dictated by how much global-warming pollution we’ve already dumped into the atmosphere. The amount of sea level rise that happens over the second half of the century, however, is much less certain because it will depend on our future emissions of heat-trapping gases as well as how glaciers, ice sheets, and other Earth systems respond to those emissions. The third section of our map tool explores the range of late-century possibilities through the lens of our collective emissions choices.

Limiting future warming to 1.5°C or 2°C would improve our chances of limiting future sea level rise. The way to do that is by slashing heat-trapping emissions—by phasing out global fossil fuel use and ramping up clean energy. Under a low sea level rise scenario, our analysis finds that roughly 3,500 critical infrastructure assets along US coastlines are at risk of flooding twice or more per year by 2100. On the other hand, if global emissions continue to rise and global temperatures rise to 3°C or more, there’s an increased chance that a higher sea level rise scenario would come to fruition. Under a high sea level rise scenario, roughly four times as many infrastructure assets—nearly 15,100 total—are at risk of disruptive flooding.
What did you say? You want more data? And ways to act, too?
Our map tool is a great way to start exploring what is at risk as sea level rises, but it contains just a few slivers of the giant data pie that we baked for this report. If you’re hungry for a bigger piece of that pie, our downloadable spreadsheets will no doubt satisfy. These spreadsheets contain:
- Data for assets at risk in 2020 and 2030 as well as in 2050 and 2100.
- Filterable lists of all the assets at risk.
- Data for assets at risk under three different sea level rise and with three different flooding frequencies (2, 12, or 26 floods per year)
- Community-level data summarizing the total assets at risk in each category of infrastructure
- Estimates of the number of people living in communities with infrastructure at risk
- Data on how many of these assets fall into communities designated as “disadvantaged” by the federal Climate and Environmental Justice Screening Tool and what the demographics of affected communities are like.
Our Looming Deadlines for Coastal Resilience report points to risks to coastal infrastructure that are largely flying under the radar. But it also points to the many solutions already available to communities and the many ways that planners, policymakers, and the private sector can help communities build the resilience they need as sea level rise. For a full set of recommendations, check out the report itself.
Using our new map tool, we can see clearly the problems sea level rise poses for the infrastructure we rely on for homes, electricity, public health, safety, education, and much more. But we can also see a clear path to a coastline dotted with resilient communities. Armed with information from our maps and a set of commonsense recommendations, we hope you can too.
Kristina Dahl, Principal Climate Scientist, Union of Concerned Scientists
Have a tip for CleanTechnica? Want to advertise? Want to suggest a guest for our CleanTech Talk podcast? Contact us here.
Latest CleanTechnica.TV Videos
CleanTechnica uses affiliate links. See our policy here.


