Sign up for daily news updates from CleanTechnica on email. Or follow us on Google News!
In recent days I’ve become aware that a purportedly neutral and data-centric transit organization, the Canadian Urban Transit Research and Innovation Consortium (CUTRIC), has been advancing hydrogen for urban transit in contradiction of global evidence of failure. A contact forwarded me a more detailed study that they’d done for the Canadian city of Brampton, one that led the city’s transit staff to recommend adopting hydrogen buses as part of their mix. The study has some glaring challenges that create a fiscal swing almost 40 times bigger than the winning scenario’s cost variance over a pure battery-electric scenario which are worth calling out.
This is part of what is turning out to be a mini-series with CUTRIC as a main character. My assumption outline in the first assessment, Canadian City About To Buy Hydrogen Buses Because Feds & CUTRIC Captured by Hydrogen Lobby, was that a good organization had been spun by the rather large number of gas distribution companies and hydrogen lobbyists that had become members. Really, why are natural gas distributors and lobbyists Fortis BC, Fortis Alberta, and Enbridge members of an urban transit research organization whose mission includes:
“CUTRIC’s work generates solutions that decrease fuel consumption, reduce emissions, eliminate redundancies, reduce congestion, improve the quality of life for Canadians, advance the digital integration of low-cost mobility solutions for urban, sub-urban, rural and remote communities across Canada, increase road safety and reduce road accidents. CUTRIC supports the technologies required for a 21st century low-carbon economy.”
In that piece, I went around the world looking at data from hydrogen fleet trial after hydrogen fleet trial. Empirically, the following statements are unequivocal:
- Hydrogen buses cost a lot more than battery-electric buses.
- Battery-electric buses are getting cheaper and hydrogen buses aren’t.
- Batteries are getting cheaper and hydrogen isn’t.
- Electric bus range is increasing while hydrogen remains the same.
- Battery-electric buses are much more efficient — wind turbine to wheel — than hydrogen buses.
- Hydrogen refueling facilities are much more expensive than electric charging facilities.
- Hydrogen refueling facilities have very high failure rates and maintenance costs.
- Hydrogen electrolysis facilities for transit have very high failure rates and maintenance costs.
- Hydrogen buses have much higher maintenance costs than battery-electric buses and are out of service much more.
- Hydrogen buses have much higher well or wind turbine to wheel greenhouse gas emissions than battery-electric buses.
- Hydrogen buses can’t get warranties fit for transit operators, while battery-electric buses can.
The piece provided data and references from California’s multiple bus fleets and 55 hydrogen refueling stations. It provided data from European hydrogen transportation annual status reports. It provided data from Quebec’s failed hydrogen fleet pilot. It provided information from bus trials in Whistler, Spain, and London.
Empirical evidence, not hypothetical models or vendor claims, shows that hydrogen is a terrible choice for urban transit. Costs are much higher, reliability is much lower, emissions are much higher and the trajectory isn’t remotely one that is showing any improvement. 25 years of trials have not resulted in hydrogen fuel cell buses and related infrastructure improving significantly. The conditions for the kinds of improvements seen with battery-electric drivetrains don’t apply to hydrogen.
The second piece, Mississauga Could Get A Dozen Electric Buses For The Cost Of Five Hydrogen Ones, applied a lightweight version of Professor Bent Flyvbjerg’s reference class forecasting to capital, maintenance costs for hydrogen vs battery-electric buses. Once again, looking at real world case studies and data from Europe and North America of actual results, realistic numbers were applied to the components and costs. Empirical reality finds hydrogen buses are vastly more expensive than battery-electric ones, swamping all concerns with battery-electric buses.
The City of Brampton has also been subject to the CUTRIC process and city staff didn’t do the necessary due diligence of checking with other transit operators globally which had been sucked into the same vortex in earlier iterations. As a result, they believed CUTRIC’s data was accurate and that they were making the right decision. As a result, on April 10th, 2024, they endorsed the CUTRIC study. Brampton is now heading down the path of including hydrogen in the mix for decarbonizing transport and will waste a great deal of time, money, and political goodwill from its citizens as a result.
But it does give more material to assess to try to figure out where CUTRIC has gone so wrong, and oh boy, are there some doozies. The CUTRIC report is publicly available information via the Brampton municipal website, so its results are freely available to review and share.
First, a clear statement. It’s not all bad. CUTRIC isn’t recommending hydrogen for everything, they are recommending a majority of buses be electric. However, the ratio is 724 electric buses to 408 hydrogen buses. They assert based on their cost workups that this blended fleet would be the most economical option. However, the difference in their cost cast — one which doesn’t stand up to scrutiny — only managed to achieve a slight savings with $8.94 billion vs $8.95 billion for the full battery-electric scenario.
That’s a 0.1% variance in cost between the scenarios, which is to say from a planning perspective, a non-existent gap far inside the error bars. That this is being promoted in the following way in the executive summary is remarkable.
“This solution is the most financially viable costing less than Scenario One (full E BEB solution) or Scenario Two (full FCEB solution).”
At the level of granularity of the report and the findings, this should have been represented as them being of equal cost. However, the hydrogen and battery-electric numbers have such serious concerns that in fact they are much further apart, and in favor of the battery-electric only scenario.
Let’s start with the very first problem, the cost of hydrogen. The costs in the report for green hydrogen aren’t bad, actually, but the costs for gray hydrogen are remarkable. As I noted in the reference class estimation piece against Mississauga based on US DOE reports of actuals, the real cost of delivered hydrogen in Ontario will be in the range of $16, and for a solution that only reduces emissions by 50% over diesel. That was without a recent peer-reviewed study in Nature out of Europe finding that hydrogen facilities in Groningen leak 4.2% of the hydrogen contained, and hydrogen has a GWP20 of 37 and a GWP100 of 12. That adds about 8.7 tons of CO2e per bus per year to the 30 tons from manufacturing gray hydrogen, further reducing any actual climate benefits.
The report, and hence Brampton, assumes gray hydrogen will cost $8 delivered. For context, in the industrial heartland of Europe, where gray hydrogen is manufactured by steam reformation and delivered by pipeline to major industrial consumers, the cost per kilogram is $9 to $12 Canadian. That’s the cheapest possible hydrogen. The transit organization will be receiving it by truck at much greater expense.
Brampton leans into gray hydrogen with this statement:
“A mixed fleet solution can leverage grey hydrogen supplies in Ontario while shifting toward increasingly lower carbon intense (green) hydrogen supplies by 2040.”
The difference between likely delivered cost of gray hydrogen vs CUTRIC’s low cost point alone is in the range of $200 million additional costs for the mixed scenario, 20 times the variance. Accurate costing for gray hydrogen alone increases the mixed fleet cost case above the battery-electric only cost case.
Next we have costs for storing and pumping the hydrogen at Bramptons two major bus yards, Sandalwood and Clark. Remember, this is for 408 hydrogen buses between the two facilities, with 30,000 kilograms of storage between them. They cost this at $3 million for each, and include a hydrogen delivery system (delivers fuel to the agency), hydrogen storage tank(s), vaporizer (for liquid storage), compressor, chiller, and a dispensing system (delivers the fuel to the vehicle).
For context, bus refueling facilities without liquid hydrogen storage in California run CA$4 million each for US DOE reports on the facilities there. Adding hydrogen liquification increases costs substantially. As a data point, the single car at a time facility in Quebec City for its now abandoned hydrogen fleet cost $5.2 million. That did not include liquification, but did include roughly equivalently expensive electrolysis facilities. That facility served 46 governmental hydrogen cars that averaged 2,600 kilometers of driving per year each, not 408 buses running 70,000 kilometers a year each with 10 times the hydrogen demand for the same distance traveled.
Real world data on hydrogen refueling and liquification costs globally make it clear that there is no world in which two hydrogen liquification, storage, compression, and dispensing facilities will cost only $6 million Canadian. Realistic costs for this point alone are likely in the range of the $10 million variance.
CUTRIC appears to think that batteries haven’t changed in five years, or perhaps longer, and aren’t changing further. As noted in the first article, EV batteries increasingly don’t contain cobalt anymore, with lithium phosphate iron chemistries dominating along with low-cobalt lithium-ion chemistries, and battery minerals aren’t particularly scarce or expensive, yet CUTRIC calls out expensive and scarce minerals for batteries as a concern.
One of the data points on this from the report, where they have their underlying assumptions listed, is that they cite the replacement battery pack for electric buses being required every 6-7 years and costing $260,000 each time.
Let’s just tear that $260,000 apart. Their average battery size assumption appears to be 500 kWh, five times as much as a Tesla Model X or Y. Replacing a Tesla battery costs in the range of $25,000 in 2024. The first problem with their assumption is that they are assuming double the replacement cost currently experienced today.
The second problem is that they are assuming that that cost does not decline at all over the almost two decades of the study period. Battery costs have been plummeting globally and so have battery packs as a result. We are, with end of 2024 battery price points of $77 per kWh for LFP batteries from CATL, starting to see balance of battery pack costs equaling and exceeding battery costs, but we’re just starting to flatten off on that ratio. I know this because one of my professional engagements this year was working with a European infrastructure investment fund focused on grid storage on exactly this point.
The third problem is that they are assuming 6- to 7-year replacements. Current data on battery-electric vehicles and fleets globally is that batteries are outlasting vehicles. As noted in a previous article in this study, Chinese OEMs are offering 8-year full drivetrain warranties on buses, including the batteries. CATL, the world’s biggest EV battery manufacturer, is warrantying its new batteries for 1.6 million kilometers or 15 years. That’s double the distance and equal to the 15-year lifespan in the CUTRIC study. The 6-7 years is at best defensible as conservative, unlike many other assumptions in the report, but it’s not remotely defensible when projecting battery replacements in 2032 and 2038.
The fourth problem is the comparison to fuel cell buses. They are asserting, correctly, that fuel cell systems and battery replacement is more expensive than just batteries. They are, however, asserting the same 6- to 7-year replacement cycle. The global reality is 3-year lifecycles for fuel cells operating with heavy duty cycles in urban environments. Despite spending extraordinary amounts of money on attempting to harden fuel cells over the past 20 years, the EU’s IMMORTAL program hasn’t achieved remotely good results.
A more accurate modeling assumption given global empirical reality would be a 7- to 8-year replacement for battery-electric buses and a 3- to 4-year replacement for fuel cells, along with lower battery pack replacement costs and declining battery pack replacement costs with each subsequent year.
Given 408 hydrogen buses, replacing their fuel cells four times over their lifespans would cost $50 million, once again exceeding the $10 million variance between the purportedly cheaper blended solution and the full battery-electric solution.
Similarly, in the full battery-electric solution, costing battery pack replacement and timing accurately per global empirical data would decrease its costs substantially. Per the report, 1,161 battery-electric buses would be required in the full battery-electric option. At more realistic declining battery replacement costs with one replacement in the lifecycle of the vehicle instead of two, that’s a roughly $150 million swing in that scenario’s costs. Once again, this swamps the $10 million variance between the scenarios.
As a note on that 1,161 battery-electric vehicles, sharp eyes will notice that 408 hydrogen buses plus 724 battery-electric buses equals 1,132 buses. That’s a 29-bus variance from the mixed scenario. Despite this, the first disadvantage listed for the battery-electric bus only scenario is the following:
“Requires substantial growth in the fleet size with hundreds of additional buses necessary to achieve full decarbonization over the base case scenario”
A 2.5% variance in number of buses gets labeled as hundreds of buses extra, while the mixed scenario, which has almost exactly the same number of buses, is not mentioned as requiring virtually the same number of buses. What is going on? Amusingly, the hydrogen only scenario requires a couple of hundred more buses than either the battery or mixed scenario, yet only has the following listed as the second disadvantage.
“Results in the largest number of vehicles required to achieve full decarbonization in Brampton”
Accurate, but not hyperbolic, as is the case with the battery-only choice. Regardless of oddities of language, and having written a great number of consulting reports, I know oddities creep in and aren’t caught, once again the difference in buses between the full battery-electric scenario and the mixed scenario isn’t material given the coarseness of the estimation.
Another key point on CUTRIC’s battery assumptions is that not only do batteries never get cheaper, they never get denser. Buses purchased in 2038 appear to have the same range as buses available in 2020. This despite CATL delivering batteries with double the energy density per kilogram of the cells in the Tesla Semi in 2024, and now offering 20% higher energy density in lithium iron phosphate cells as well.
CUTRIC’s modeling on batteries makes them much more expensive, while hydrogen fuel cells are given multiple thumbs on the scale.
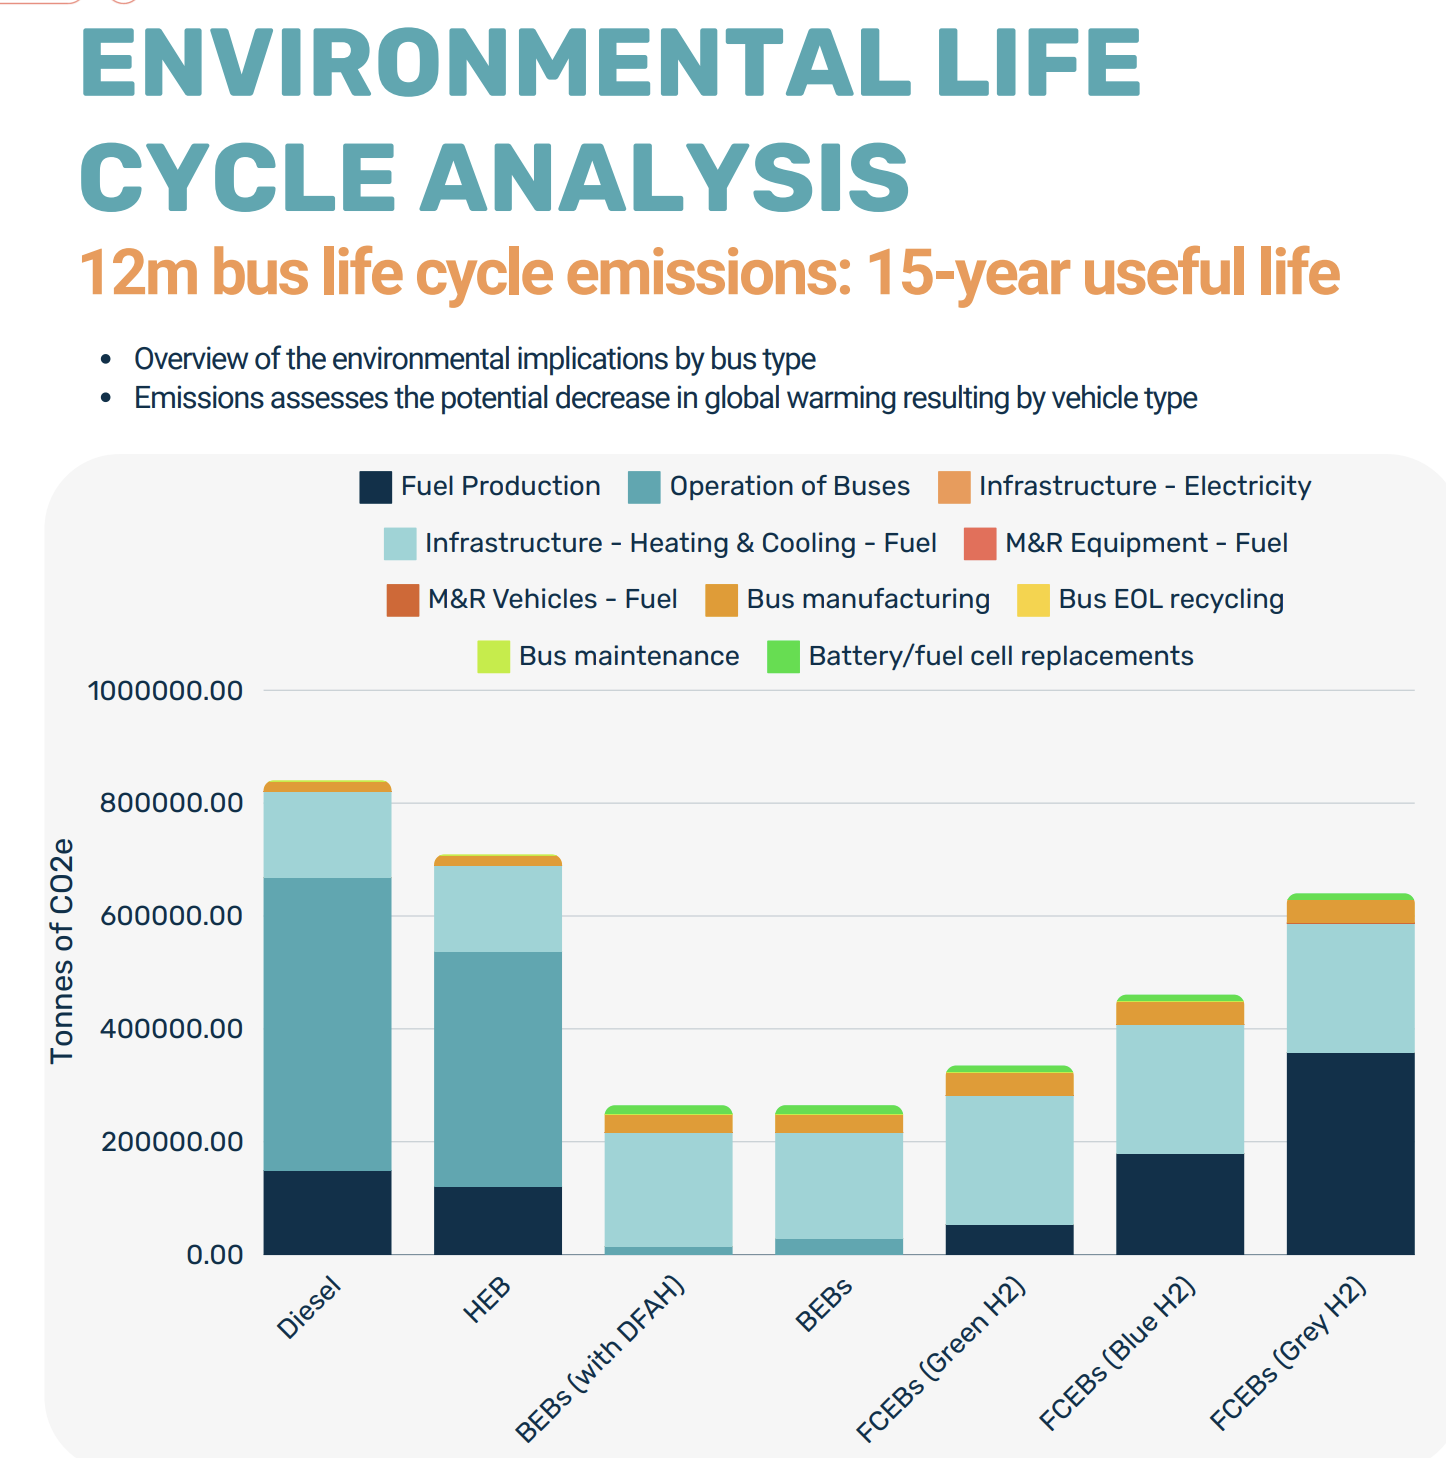
Another problem emerges when we look at this chart from the report. The dark gray bar at the bottom of the battery electric buses bar is equivalent to the much darker bar at the bottom of the fuel cell buses bar. As noted earlier, the leakage of hydrogen with its GWP20 of 37 and GWP100 of 12 are ignored in CUTRIC’s modeling, so the numbers are low regardless.
However, green hydrogen option is manufacturing hydrogen, compressing it, trucking it, liquifying it, and pumping it into lower efficiency fuel cell buses with grid electricity in Ontario instead of just using the grid electricity directly. As the previous two articles made clear with references from Europe and elsewhere, battery-electric buses are about three times more efficient in the use of electricity as hydrogen buses. The dark bar for fuel cell emissions should be three times the height of the battery-electric darker gray bar, but is only twice the height. One assumes that their model creates these charts and are accurate representations of underlying numbers, so this indicates another error in their modeling.
However, this pales in comparison to another point. The report posits lots of gray hydrogen being used and indeed the Brampton transit staff report makes that clear. However, at no point is the price of the federal carbon price considered against the price of the fuel.
As noted in previous articles, Ontario’s electricity is fairly low carbon, albeit rising somewhat due to bad provincial governmental policies and still much higher than neighboring Manitoba and Quebec. But the emissions from the gray hydrogen are high and aren’t priced.
Manufacturing hydrogen with steam reformation emits 10-12 kilograms of CO2e per kilogram of hydrogen at present, excluding hydrogen leakage. A hydrogen fuel cell bus, over its lifecycle if using gray hydrogen, per CUTRIC calculations will emit around 375,000 tons of CO2e.
At $170 per ton of CO2e, Canada’s carbon price in the rapidly approaching 2030 and for the 408 fuel cell buses represents another cost in the range of $25 million, once again and by itself exceeding the $10 million variance between full battery-electric and the hydrogen option. While Canada’s carbon price is at risk due to populist and uninformed rhetoric at present, no rational transit agency would ignore the implications of its costs in their budget projections, or for that matter exclude the very likely addition of hydrogen to it in the coming years.
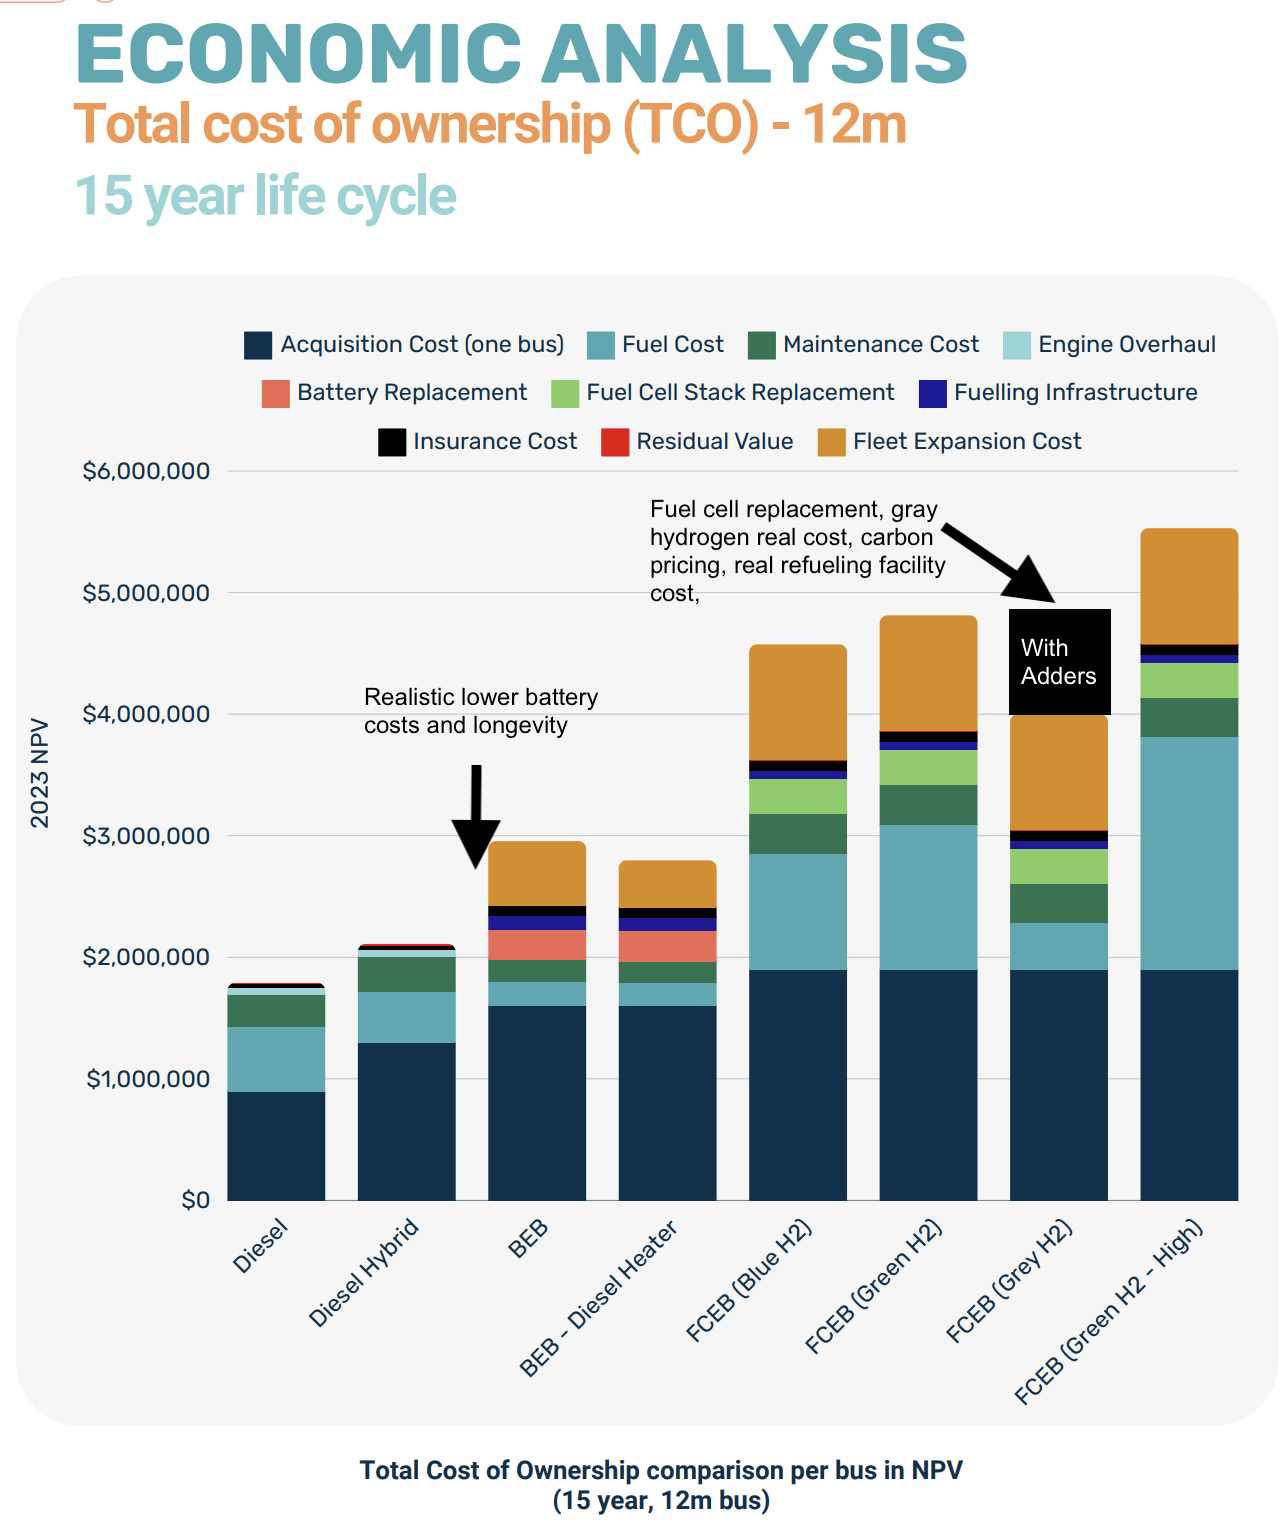
As a note on this graph, its vertical axis is labeled NPV, that is net present value. But this is net present costs, not value. The lack of quality in labeling basic material, something likely repeated in transit report after transit report, is par for the course for CUTRIC. Michael Raynor, former managing director of Deloitte, author of a couple of books on strategy and innovation and now running a carbon insets startup, caught that in discussions today. It’s just shoddy work.
This assessment of actual vs CUTRIC costs for the blended scenario finds the following:
- $200 million extra for gray hydrogen costs
- $10 million extra for hydrogen storage and refueling facilities
- $25 million extra in costs for hydrogen fuel cell replacements
- $100 million less for replacement of batteries in battery-electric buses
- $25 million extra for carbon pricing for gray hydrogen
The $10 million variance that is positive for the blended scenario becomes a variance of about $360 million in favor of battery-electric buses only. That gray hydrogen fuel cell bus cost bar is much, much taller. Oh, and at the reduction of massive amounts of greenhouse gas emissions too, which is the point of this exercise.

Chip in a few dollars a month to help support independent cleantech coverage that helps to accelerate the cleantech revolution!
Have a tip for CleanTechnica? Want to advertise? Want to suggest a guest for our CleanTech Talk podcast? Contact us here.
CleanTechnica uses affiliate links. See our policy here.
CleanTechnica’s Comment Policy


